
Abstract
Determination of mechanical loading regimen that would induce a prescribed new bone formation rate and its site-specific distribution, may be desirable to treat some orthopaedic conditions such as bone loss due to muscle disuse, e.g. because of space flight, bed-rest, osteopenia etc. Site-specific new bone formation has been determined earlier experimentally and numerically for a given loading regimen; however these models are mostly non-invertible, which means that they cannot be easily inverted to predict loading parameters for a desired new bone formation. The present work proposes an invertible model of bone remodeling, which can predict loading parameters such as peak strain, or magnitude and direction of periodic forces for a desired or prescribed site-specific mineral apposition rate (MAR), and vice versa. This fast, mathematical model has a potential to be developed into an important aid for orthopaedic surgeons for prescribing exercise or exogenous loading of bone to treat bone-loss due to muscle disuse.
Introduction
Bone adapts to exogenous mechanical loading1. For example, bone in the playing arm of a tennis player may have bone cross-sectional area as much as 35% more than that in the non-playing arm2. Conversely, disuse of muscle such as in space-flight can induce hip bone density loss up to 2% per month3. Mechanical strain engendered in long bones of various species during normal physical activities is strikingly similar, namely in the range of 0–0.2%, i.e. 0–2000 microstrain (με)4. There exists an upper threshold of strain above which new bone formation starts to keep up with the increased mechanical strain5. Similarly there is a lower threshold below which bone resorption starts in order to optimize bone mass to the decreased level of mechanical loading5. With a plenty of experimental studies it has been established that new bone formation not only depends on the strain magnitude but also on loading waveform, number of cycles, number of bouts and time between the loading bouts6,7,8,9. Accordingly, there have been efforts to numerically or parametrically relate new bone formation to loading parameters7,10,11,12. The average bone formation rate (BFR) has been explicitly expressed in terms of the loading parameters in some cases11,12. Site-specific bone formation has been numerically modeled in other cases7,10. There is, however, no consensus regarding how exactly the new bone formation relates to the mechanical environment10. Moreover, existing numerical models for site-specific new bone formation are not invertible, which means loading parameters cannot be easily determined for a desired average or site-specific bone formation rate.
The objective of this study is to develop a mathematical model of bone adaptation that can be easily inverted. Most of the bone adaptation models are based on strain magnitude7,12, strain energy10,13, fluid shear10,14 and fatigue11 as mechanical stimuli. This work attempts to integrate most of these theories into one. In addition, relevant biological factors such as bone cell network of osteocytes and osteoblasts have also been used to include cell-to-cell communication resulting in intracellular calcium (Ca2+) signaling15,16,17,18,19, as implemented by Srinivasan et al.7,20. It is well established that the molecular cascade that follows a mechanical loading has an important role of Ca2+ as a secondary messenger in activation of the transcription factor NFAT (Nucleus Factor for Activation of T-Cells), which has been implicated in new bone formation through Calcineurin (CaN), CAMK (Ca2+/calmodulin-dependent protein kinase) and MAPK (Mitogen-activated protein kinase)15. In the present new model, biological signal transduction is purposefully much simplified in order to maintain invertiblity, and communication between the cells along the cell network has been modeled as diffusion. The model is inherently based on accumulated damage of material due to fatigue loading as a stimulus, and therefore automatically relates stress amplitude and number of loading cycles to new bone formation rate. The effect of fluid flow on new bone formation has been additionally captured through viscoelasticity-like macroscopic behavior of the bone tissue.
Rest of this paper is organized as follows. Section 2 describes the methodology used for computation of overall bone formation rate (BFR) and site-specific mineral apposition rate (MAR). Section 3 details the results, which have been discussed in Section 4. Conclusions have been drawn in Section 5.
Methods
The Average BFR Model
In vivo experiments involve loading a bone (Fig. 1(A)) with a periodic force F(t), composed of a number of cycles N of a loading waveform (Fig. 1(B)). This loading is repeated for a number of days d every week and the loading is typically continued for a number of weeks, end of which bone formation rate (BFR) or mineral apposition rate (MAR) is computed at a bone section (Fig. 1(C)) based on labeling and histological techniques6,7,21,22,23. The loading induces strain field ε(x, y) on the section of interest (Fig. 1(C)). The strain at a point on that section may have a different waveform than the force due to viscoelastic effects, e.g. arising because of fluid flow (Fig. 1(D)). Some in vivo experiments are accompanied with strain-gauging and finite element analysis (FEA) to ascertain global peak strain εpeak and its location on the section6,7,21,22. If εpeak is more than a threshold strain εthres, new bone formation has been observed in the literature. We hypothesize that bone formation rate for the section in consideration can be given by
where p, q, εthres and β are the parameters to be determined. Δεmax is the amplitude of oscillation of strain at that point (Fig. 1(D)). For a given loading F(t), both εpeak and Δεmax depend on the material properties of the bone, viz. Young’s modulus E and effective viscosity η arising from the effect of interstitial fluid flow inside bone. E for bone may be assumed to be 20 GPa24. η is the fourth constant to be determined. Using the beam theory and assuming the bone to be a Kelvin-Voigt material, εpeak and Δεmax may be easily computed, as given in the Supplementary Methods available online, for any periodic loading. Calcein/alizarin labelling days have not been included in equation (1) assuming BFR remains constant while new bone is being labeled. This assumption may not be valid if labelling days are not appropriately chosen.
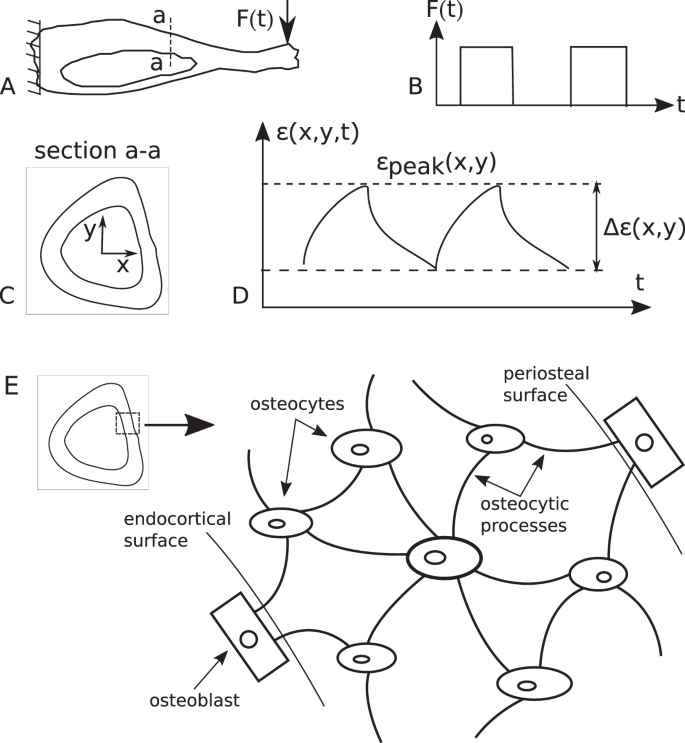
A long bone loaded by a cyclic force, resulting strain at a cross-section of interest and the osteocyte-osteoblast network. (A) Tibia fixed at proximal end and loaded at the distal end. (B) The periodic load F(t) is composed of a number of cycles of a waveform (e.g. rectangular waveform as shown). (C) The idealized mid-diaphyseal cross-section of tibia with its coordinate system. The bone cross-section used for this study is adapted from Srinivasan et al.7. The outer and inner curves correspond to periosteal and endocortical surfaces, respectively. The section corresponds to the mid-diaphysis of a 16 week old C57BL/6 mouse. Origin of the Cartesian coordinate system (x, y) is at the centroid of the bone section. x and y axes are aligned with lateral and anterior anatomical directions, respectively. (D) The strain induced by the cyclic loading has different waveform than the loading waveform due to damping effects. (E) The osteocytes, through their processes, are connected to osteoblasts. Strain above a threshold makes an osteocyte release calcium ions (Ca2+) in its cytoplasm. These ions diffuse through the osteocytic processes to reach osteoblasts, which utilize Ca2+ for new bone formation.
Equation (1) has been derived analogous to fatigue damage11 following fatigue failure theory25,26, (see Supplementary Methods). This equation can be mathematically fit to the BFR data found from an experiment for different loading protocols, numbered l = 1 to nl. For each loading protocol, bone formation rate may be computed as follows:
where \({\xi }_{l}(\eta )=\frac{{\rm{\Delta }}{\varepsilon }_{{\rm{\max }}}^{l}(\eta )}{{\varepsilon }_{peak}^{l}(\eta )}\), which is a function of viscosity η.
Parameters p, εthres, η, q and β can be obtained by minimizing the following error squared:
The above equation (3) has been mathematically fit to the BFR data (\({B}_{l}^{0}\)) reported by Srinivasan et al.7 for a tibial section (1.8 mm proximal to tibia-fibula junction) of a 16-week old female C57BL/6 mice as a response to a cantilever loading. The mathematical software SageMath Ver. 6.627, in particular the “find_fit” function and Levenberg-Marquardt algorithm28,29, was used to fit the data by minimizing mean square error between the mathematical model and the experimental data. Equation (2) will be referred to as “Average BFR Model”, results for which is given in Section 3.1.1.
Note that the parameter p will be different for endocortical and periosteal surfaces, as endocortical surfaces have relatively lower strain. p will also be different for different loading conditions (e.g. axial loading6,30,31, cantilever loading7,32, three-point bending21,33, four-point bending22,34), as different loading cases have different strain distribution. A refined model is, therefore, needed which is valid for any loading case. Accordingly a “Site-Specific Model” has been developed, which will use the other four parameters identified here, viz. εthres, η, q and β, as described in the next section.
The Site-Specific Model
The stimulus at an individual osteocyte is computed similar to that in equation (1) except that εpeak and Δεmax now correspond to the local strains experienced by the osteocyte in consideration. Accordingly, stimulus at i-th cell is proposed to be
where \({\varepsilon }_{peak}^{i}=max(|\varepsilon ({x}_{i},{y}_{i},t)|)\) is the peak strain experienced by the i-th cell. (xi, yi) is the coordinates of the i-th cell. h is a constant to be determined. Parameters εthres, η, q and β are already determined by the Average BFR Model (Section 2.1).
The stimuli are proposed to diffuse through the osteocyte-osteoblast network (Fig. 1(E)). The stimuli finally reach the osteoblasts, which in turn produce new bone proportional to the stimuli reaching them.
Assuming Ca2+ to be the secondary stimulus as a response to mechanical loading7, h in equation (4) relates to the increase in Ca2+ concentration in cytoplasm of osteocytes as a response to mechanical loading. Accordingly, si presents the ‘strength’ of calcium signaling, which is a function of strain and its number of cycles. The value of h is not critical for this study as the value is not explicitly needed. One way to define h, however, would be the peak amplitude of Ca2+ concentration spike with respect to the baseline, when bone matrix around the osteocyte is loaded with a single square pulse of loading of 1s duration producing 1 με more than the threshold strain for bone formation. Then h can be roughly estimated by studying Ca2+ response to a single cycle of loading such as in Jing et al.16, where applying 1546 με to the bone matrix around an osteocyte results in rougly trianglular spike of Ca2+ concentration in cytosol with respect to its baseline. This spike has approximate amplitude of 1.7 times the baseline concentration. Assuming this baseline to be 50 nM (as for rat osteoblasts reported by Donahue et al.17), the spike amplitude would be 85 nM. ξ(r) = 1 approximately for this case because of rest-inserted loading, similar to what is expected in case of a single pulse loading. h is thus simply the ratio of the peak concentration and strain excess to the threshold (i.e., 1546–856 με). The value of h would, therefore, be 0.123 nM/με.
The stimuli produced inside the cells are assumed to ‘diffuse’ through each of the one-dimensional osteocytic processes and follow the Fick’s first law for steady-state diffusion:
where J is the diffusion flux (mols of Ca2+ diffusing per unit area per unit time), D is the diffusivity (a constant, which may be assumed to be 5.3 × 10⁻⁶ cm2 s−1 as measured by Donahue and Abercrombie18 for Ca2+ in vivo), ψ is the concentration of the stimulus (mols per unit volume) and x is the position along the cell process. This differential equation may be solved using a finite element method and may be accordingly discretized as follows:
where Q is a vector containing stimulus flow rate (mols of Ca2+ per unit time) at nodes and Ψ is vector containing the nodal concentration of the stimuli. Ψ includes the stimulus concentration computed earlier (si) using equation (4), i.e. ψi = si. K is the diffusion stiffness matrix assembled from stiffness matrix of individual osteocytic processes kj. ‘Stiffness’ of the jth process is taken as
where Aj and Lj are cross-sectional area and length of jth process. It has been assumed that every osteocytic cell process has a uniform cross-sectional area of A0 = 0.025 μm2 19.
The stimulus should be fully ‘utilized’ by the osteoblasts to form new bone. The nodal concentrations of the stimulus (ψi) at the osteoblasts are thus assumed to be zero. The corresponding stimulus flow rate (qi) at the osteoblasts will be negative as osteoblasts act like a sink for the osteogenic stimuli.
The mineral apposition rate (MAR) at an osteoblast is assumed to be proportional to the stimulus flow rate (qi) at the osteoblast in consideration. In other words, MAR of i-th osteoblast is given by
where k is the constant of proportionality to be determined by fitting this mathematical model to experimental data. k is a negative real number as qi at osteoblasts is also negative. Due to linearity of equation (8) and proportionality of si to h, the stimulus flow rate qi will vary directly proportional to h, if other parameters are kept the same. Similarly, qi is also directly proportional to D. The values of h and D are therefore not critical, as the process of curve fitting will automatically find a suitable k to get the same mi. The value of k is that minimizes the following error-squared function φ(k):
where \({m}_{i}^{0}\) is the experimental mineral apposition rate (MAR) at i-th osteoblast and nb is the total number of osteoblasts. The value of k is obtained by linear regression:
If \({m}_{i}^{0}\) is not known and instead the overall (i.e. average) bone formation rate (B) for the section is given to be B0, then k can be computed by using the following relationship:
If nl number of loading protocols are used as mentioned in Section 2.2, the optimal value of k is obtained by minimizing the following squared error:
where \({q}_{i}^{l}\) is the stimulus flow rate at i-th osteoblast for l-th loading protocol. k is accordingly obtained as
In absence of sufficient site-specific new bone formation data, the constant k has been determined using overall BFR data (\({B}_{l}^{0}\)) given in Srinivasan et al.7 for 16-week old wild-type (C57BL/6) female mice. This site-specific model has been summarized in the flow chart given in Fig. 2. The results for this model are given in Sections 3.1.2 to 3.1.4 for different loading conditions.

Flowchart of the site-specific model and its relation to the average BFR model and the inverted model. Given the number of cycles of a loading waveform, the site-specific model computes site-specific MAR distribution as well as average BFR at periosteal surface. The inverted model reverses the problem, i.e. it finds the loading parameters needed to achieve a prescribed site-specific MAR distribution. The average BFR model computes average BFR/BS at the section of interest based on loading parameters (including resulting peak viscoelastic strain) without computing osteocyte-level stimulus and its diffusion in osteocyte-osteoblast network.
The Inverted Model
The current model is invertible, i.e. if site-specific MAR is prescribed, it is possible to easily find the normal force and bending moment (or alternatively strain distribution) at the section that would give the prescribed site-specific new bone formation (Fig. 2). If \({m}_{j}^{0}\), j = 1 to \({n}_{p}\le {n}_{b}\), is the desired mineral apposition rate at j-th chosen osteoblast, mj is the corresponding computationally obtained MAR; and BFR0 and BFR are the desired and computational bone formation rates, respectively, then the following error squared function is to be minimized by varying amplitudes of normal force (\({F}_{z}^{0}\)), bending moment about medial-lateral axis (\({M}_{x}^{0}\)) and bending moment about anterior-posterior axis (\({M}_{y}^{0}\)) for a prescribed waveform of unit amplitude (u(t)) and number of cycles (N) of this waveform:
where mj = kqj is obtained by solving equation (6), i.e. Q = K ψ. Stimulus concentration matrix Ψ, stiffness matrix K and stimulus flow rate Q, are computed as described earlier. Ψ is composed of si computed as per equation (4), where h, εthres, η, q and β are known constants from the Site-Specific Model (Section 2.2). Number of cycles, N, is to be prescribed. B is computed using equation (11). λ is a Lagrange multiplier, which can be chosen based on relative weightage of the overall BFR equality constraint, i.e. B = B0. If B0 is not known, then λ = 0. As there are three unknowns, at least three of B0 and \({m}_{j}^{0}\)’s should be known/prescribed for a unique solution. Since the unit waveform (u(t)) is prescribed, Fz, Mx, and My are given by:
The objective function g(Fz, Mx, My) may be minimized by using a standard optimization method with a reasonable initial guess for \({F}_{z}^{0}\), \({M}_{x}^{0}\) and \({M}_{y}^{0}\), whose optimal values are obtained after a number of iterations. We used the mathematical software SciLab35, in particular the “lsqrsolve” function to get the optimal values for \({F}_{z}^{0}\), \({M}_{x}^{0}\) and \({M}_{y}^{0}\) using Levenberg-Marquardt algorithm28,29. One example has been solved using this inverted model and the corresponding results are shown in Section 3.1.4.
Statistical Tests
The new bone formation predicted by the developed mathematical model has been evaluated with respect to experimental findings by two statistical tests, viz. Student’s t-test and Watson’s U2 test36,37. A one-sample two-tailed t-test has been used to compare the average bone formation rate per unit bone surface (BFR/BS) values, while a circular goodness-of-fit test viz. Watson’s U2 test has been used to compare site-specific MAR. Watson’s U2 test is used to compare two circular probability distribution functions36,37. Probability distribution function (PDF) for the experimental results is assumed to be proportional to experimental MAR distribution. Similarly, PDF for the mathematical model predictions is assumed to be proportional to the predicted MAR distribution. Both t-test and Watson’s U2 test have been done using Scilab35 programming. The Watson’s test has been done based on works by Watson36 and Stephens38.
Results
Lamellar Bone Adaptation at Periosteal Surface
The Average BFR Model: Cantilever Loading
The developed theory has been tested for cantilever bending7,32. In particular, periosteal in vivo data for tibia of 16 week old female C57BL/6 mice for the ten loading protocols obtained from Srinivasan et al.7 have been used to calibrate the developed model. The loading waveform used in the original in vivo study was trapezoidal, starting from 0 to the peak in 0.1 s, holding at the peak for 0.8 s and decreasing linearly to 0 in 0.1 s. In some of the protocols, there was 10 s rest given between two loading waveforms. The peak strain varied (viz. 1000 με, 1250 με, 1600 με) among the protocols and so did the number of cycles (viz. 10, 50, 250). The loading was given three alternate days in a week, for 3 weeks. All mice received calcein labels on days 10 and 19 (day 1 corresponded to first loading). Values of mid-diaphysis section properties – A, Ix, Iy and Ixy have also been taken from Srinivansan et al.7. After curve fitting according to equations27,28,29, the parameters that fit the BFR data in Srinivasan et al.7 at mid-diaphyseal cross-section 1.8 mm proximal to tibia-fibula junction are as follows: p.dβ = 1.06859 × 10⁻⁴ μm/day/με, q = 0.404736, r = 2πη/E = 0.436235 s, and εthres = 856.126 με. As d = 3 for all protocols, β could not be separately determined and hence the value of p.dβ has been computed. As shown in Fig. 3, the model BFR/BS values are found to be not significantly different from the mean experimental values (p > 0.48 for every protocol).

Comparison between the mathematical model and the in vivo experiment for new bone formation. Relative periosteal bone formation rate (rp.BFR/BS) obtained by the mathematical model (black bars) is statistically equal to that obtained by in vivo experiments for each of the 10 protocols used by Srinivasan et al.7.
Site-Specific Model: Cantilever Loading
Using the same in vivo data used in Section 3.1.1, the site-specific model has been established by finding k according to equation (13). The locations of osteocytes and osteoblasts on the tibial cross-section and their network have been taken from the same source. The value of the product of k, h, D, A0 and dβ has been approximately found to be khDA0dβ = −1.8563 × 10⁻³ μm2 day−1με−1 (where d = 3) i.e. khDA0 = −1.8563 × 10⁻³/3β μm2 day−1με−1. As compared in Fig. 4(A), the BFR/BS predicted by the site specific model is not significantly different from the in vivo data (p > 0.15 for every protocol; average p-value = 0.576 for the ten protocols).

Comparison of new bone formation between the site-specific model and the in vivo experiment. (A) Periosteal bone formation rate obtained by the site-specific mathematical model (black bars) is not significantly different from that of in vivo experiments for each of the 10 protocols used by Srinivasan et al.7. (B) In vivo distribution of new bone formation for Protocol 6 is shown in green, which is adapted from Srinivasan et al.7. (C) Outer boundaries of periosteal and endocortical osteogenesis predicted by the mathematical model for Protocol 6 are shown as dashed line.
The in-vivo new bone formation is approximately as shown in Fig. 4(B) for loading protocol no. 6 of Srinivasan et al.7. This loading protocol has peak strain (εpeak) of 1600 με, rest of 10 s and number of cycles (N) of 50. The corresponding periosteal osteogenesis predicted by the site-specific model for the same loading protocol is shown in Fig. 4(C). The total BFR/BS is 0.436 μm3/μm2/day, which is close to the experimental value of 0.377 ± 0.084 (SE) μm3/μm2/day (p = 0.51, t-test). The predicted MAR distribution is also significantly close to that of the experimentally obtained new bone distribution (p = 0.99 for Watson’s U2 test36).
Site-Specific Model: Axial Loading
Example 1: The first axial loading example solved is that from Weatherholt et al.31, where tibia of 16 week old female C57BL/6 mice underwent axial loading of 7N magnitude having 360 cycles of 2 Hz haversine waveform for 4 weeks at the rate of 3 days a week. Strain distribution is kept similar to Weatherholt et al.31 (e.g. 1833 με at medial side). The model parameters i.e. k, h, D, A0 and dβ have been kept the same as that in the cantilever loading example (Section 3.1.2). The experimental and predicted new bone formations are shown in Fig. 5(A,B), respectively. The predicted BFR/BS is 1.63 μm3/μm3/day, which is not significantly different from the experimental value of about 1.5 ± 0.17 (SE) μm3/μm3/day (Fig. 6(A), p = 0.456). The predicted site-specific MAR distribution (Fig. 5(B)) on the periosteal surface is close to that in the experimental case (Fig. 5(A)) (p = 0.997).

Comparison of site-specific new bone formation between experimental and mathematical models in axial loading cases. In vivo bone section showing new formation in green which has been adapted from (A) Weatherholt et al.31 and (C) Mahaffey et al.39. Dashed lines in (B) and (D) respectively show the corresponding new bone formation predicted by the mathematical model.

Comparison of relative periosteal bone formation rates (rp.BFR/BS) between model predictions and actual experimental values. (A) Axial loading examples 1, 2 and 3 have been taken from Weatherholt et al.31, Mahaffey et al.39 and Willie et al.43, respectively. (B) Four-point bending examples have been taken from Turner et al.22 (examples 1 and 2) and Kuruvilla et al.40 (example 3).
Example 2: The second axial loading example solved is from Mahaffey et al.39, where 16 week old female C57BL/6 mice were loaded with 60 cycles of 2 Hz haversine waveform of 5N magnitude for 2 weeks at the rate of 3 days per week. The strain distribution is kept similar to that of the experimental study39, e.g. the strain is about 1200 με at anteromedial aspect of mid-diaphysis. The new bone formation experimentally obtained and that predicted by the model are shown in Fig. 5(C,D), respectively. The BFR/BS predicted by the model is 0.26 μm3/μm3/day, which is close to the experimental value of 0.27 ± 0.12 μm3/μm3/day (Fig. 6(A)) (p = 0.936). The predicted MAR distribution (Fig. 5(D)) is not significantly different from the in vivo study (Fig. 5(C)) (p = 0.994 for Watson’s U2 test). Some difference in MAR distribution may be attributed to the difference in shape of the cross-section.
Example 3: Another axial loading example is taken from the work of Willie et al.30, where tibiae of 26 week old female C57Bl/6 J mice were loaded with 216 cycles of 4 Hz triangular waveform with 11N peak compressive load for 2 weeks at the rate of 5 days per week. The waveform had a 5 s rest period inserted after every 4 cycles. The strain distribution is similar to that in the original experimental study30, e.g. the peak tensile and compressive strains are approximately 1080 and −1695 με, respectively. The model parameters k, h, D, A0 are the same as that in Examples 1 and 2 in this section, whereas β = 0.465 has been used in accordance with Section 3.1.4. The predicted BFR/BS (0.27 μm3/μm3/day) is close to that experimentally obtained value of 0.33 ± 0.12 (SE) (Fig. 6(A)) (p = 0.63 for t-test).
Site-Specific Model: Four-Point Loading
Examples 1 and 2: The site-specificity of the model was further tested for the four-point bending case reported by Turner et al.22. The original study was for tibia of 9-month-old female Sprague-Dawley rats. The loading waveform was sinusoidal with 2 Hz frequency, applied for 36 cycles a day for 14 days. The rats received calcein label on days 5 and 12 (day 1 corresponds to the first day of loading). The study lasted for 14 days. The force amplitudes were 27 (Example 1) and 33N (Example 2), which resulted into peak strains of 1404 and 1484 με, respectively. Applying these loading protocol including the strain distribution, the mathematical model was fitted to experimental BFR. The corresponding khDA0dβ value is found to be −2.7527 × 10⁻³ (where d = 7) i.e. khDA0 = −2.7527 × 10⁻³/7β μm2 day−1με−1. Equating khDA0 for the cantilever and four-point bending cases, we get β = 0.465, which is slightly more than the value of q (=0.405) given in Section 3.1.1. Based on the estimated values of h, D, and A0 given earlier, the value of k would accordingly be 7.908 × 106 μm/nmol. The corresponding BFRs computed by the model are 0.330 and 0.396 μm3/μm2/day, respectively, which are close to the experimental values 0.321 ± 0.058 (SE) and 0.408 ± 0.065 μm3/μm2/day (Fig. 6(B)) (p = 0.875 and 0.858, respectively). Unfortunately, no histological section showing lamellar new bone formation or site-specific MAR data are available for these loading cases, so the predicted site-specific MAR could not be tested against the experimental values.
Example 3: This 4-point bending example is taken from the work of Kuruvilla et al.40, where tibiae of 16 week old C57BL/6 J mice were loaded with 99 cycles of 2 Hz haversine waveform per day for 3 weeks at the rate of 3 days a week. The strain distribution is also kept similar to that in the experimental study40, e.g. approximately 2000 με at the lateral surface of tibia. The predicted BFR/BS is 0.853 μm3/μm2/day, while the experimental value is 0.745 ± 0.076 μm3/μm2/day (Fig. 6(B)) (p = 0.195). The predicted new bone formation primarily at the lateral surface of the section is in accordance with the incomplete histological section shown by Kuruvilla et al.40.
The Inverted Model: Axial Loading
The average BFR is invertible as it is an explicit algebraic function (equation (1)). The peak strain required to achieve a desirable overall BFR may be given by:
The site-specific osteogenesis can also be easily inverted using optimization methods28,29,35. As the axial loading on mouse tibia has been extensively studied earlier6,14,30,31,41,42,43,44, the inverted mathematical model has been tested for the axial loading case, viz. with respect to the in vivo studies by Willie et al.30. The corresponding experimental new bone formation shown in Fig. 7(A) is for 10-week-old female C57BL/6 mice. The loading waveform used for this study was the same as that given in Section 3.1.3 (Example 3).

In vivo osteogenesis due to axial loading versus that predicted by the inverse model. (A) For axial loading condition6,41,42,43, in vivo new bone formation is roughly shown in green, which is adapted from Willie et al.43. (B) The computational new bone formation corresponding to the forces predicted by the ‘inverse’ mathematical model is shown by dashed lines. (C) The peak magnitude of tensile and compressive strains predicted by the mathematical model have been compared to the respective experimental values.
We prescribed periosteal MAR values approximately similar to that (relative to experimental control) in Willie et al.30, as roughly shown in Fig. 7(A). In particular, one osteoblast at the posterior-medial vertex, one at posterior side and one at posterior-lateral vertex of the bone cross-section are prescribed MAR of 0.9, 2.7 and 0.9 μm/day, respectively. Additionally, one osteoblast each at the lateral side, anterior vertex, and medial side is also prescribed MAR of 0 μm/day. The waveform is kept approximately the same as that for corresponding in vivo study, except that the amplitude of the waveform is unity. The number of cycles N is also kept the same (216 per bout). After optimization, we get the sectional forces (\({F}_{z}^{0}\), \({M}_{y}^{0}\) and \({M}_{x}^{0}\)) that produce peak tensile and compressive strains of 1127 and −2563 με, respectively, which are close to 1174 ± 140 (SE) and −2410 ± 500 με (Fig. 7(C)) (p = 0.743 and 0.766, t-test), respectively resulting from \({F}_{z}^{0}=11N\) of axial loading. The site-specific bone formation due to the predicted loading is shown in Fig. 7(B), which is site-specifically, approximately similar to that of the in vivo case (p > 0.99 for Watson’s U2 test). The BFR/BS computed by the model (0.884 μm3/μm2/day) is also close to the experimental value 0.930 ± 0.145 μm3/μm2/day (p = 0.760). The predicted neutral axis is approximately horizontal (\({\tan }^{-1}({M}_{y}^{0}/{M}_{x}^{0})=3^\circ \)) as also evident in the original in vivo study30 and other works in the literature involving axial loading of mouse tibia6,45.
Lamellar Bone Adaptation at Endocortical Surface
Cantilever Loading
Although the endocortical bone formation data are not studied in Srinivasan et al.7, the comparison has been approximately made to only one section shown there. Based on the model parameters given in Section 3.1.2, the predicted new bone distribution at the endocortical surface is also shown in Fig. 4(C), which is not significantly similar to the experimental distribution (p = 0.89 for Watson’s U2 test). The predicted BFR/BS is 0.132 μm3/μm2/day, which is less than estimated experimental BFR/BS of 0.5 μm3/μm2/day. This is in accordance with the literature that endocortical surface is more mechano-responsive than the periosteal surface due to extra recruitment of osteoblasts from bone marrow10,39,44,46. As such, endocortical surfaces remodel differently10,47 e.g. endocortical remodeling depends on age of animal more than periosteal remodeling does44. The periosteal new bone formation is, therefore, more consistent than endocortical new bone formation, as also evident from other works of Srinivasan et al.48,49. The current model does not take into account of such differences between the two surfaces.
Four-Point Loading
In continuation to and for the model parameters given in Section 3.1.4, the endocortical BFR/BS computed by the model are 0.080 μm3/μm2/day (p = 0.92) and 0.112 μm3/μm2/day (p = 0.01), respectively. The corresponding experimental values are 0.085 ± 0.052 (SE) and 0.041 ± 0.019 μm3/μm2/day, respectively22. This discrepancy between model prediction and experimental values may be due to the bone resorption at endocortical surfaces in adult rodents44, similar to that observed in human adults as well50. The current model does not take into account for the natural bone resorption at the endocortical surfaces.
Woven Bone Adaptation
Four-Point Loading
Turner et al.22 show a section corresponding to 64N load which induces 3010 με peak strain and results in woven bone formation at periosteal surface (Fig. 8(A)). Note that the current model does not account for woven bone formation, which is regulated by a different osteogenic mechanism and results in elevated bone formation22,42,51. Hence, based on the model parameters given in Section 3.1.4 (Examples 1 and 2), the predicted periosteal new bone formation (1.768 μm3/μm2/day) is very less than the estimated experimental elevated BFR/BS of 8.563 μm3/μm2/day. The model’s site-specificity prediction is shown in Fig. 8(B). Both (the in vivo experiment and the model) have new bone formation at the lateral and medial sides. The in vivo case additionally has woven bone formed as anterior-medial side, which is also present in the sham loading case. The new bone distribution relative to the sham loading was found to be close to that predicted by the present model (p > 0.99, Watson’s U2 test).

In vivo new bone formation for 4-point and 3-point bending versus that predicted by the model. (A) The in vivo new bone formation for 4-point loading condition is shown in solid black, which is adapted from Turner et al.22. (B) For 4-point bending22,34, periosteal and endocortical new bone obtained from the model is shown with dashed lines. (C) The in vivo new bone formation for 3-point loading is shown in green, which is adapted from Sakai et al.21. (D) For 3-point bending condition21,33, periosteal and endocortical new bone formation predicted by the model is shown by dashed lines.
The endocortical new bone formation rate (BFR/BS) for 65N load is predicted to be 0.916 μm3/μm2/day, which is significantly less than the experimental value of 2.466 ± 0.173 μm3/μm2/day (p < 0.001) due to woven bone formation. The predicted MAR distribution is similar to that of experimental distribution (p > 0.99).
Three-Point Loading
The original in vivo study reported by Sakai et al.21 is for 3-point loading of tibia of 10-week-old male C57BL/6 mice. The loading waveform was rectangular pulse of 6N amplitude and 0.5 s duration followed by 39.5 s rest. The tibia was loaded for 36 cycles each day for three alternate days in the first week only. The peak strain was 2100 με. There was no loading in the second week. The mice received Calcein labels on days −2, 3, 8, and 13 (day 0 being the first loading day). The study was conducted only for 2 weeks. The corresponding site-specific new bone formation is shown in Fig. 8(C). Note that the shown section has woven bone formation, which has not been incorporated in the current model. Keeping the same peak strain, orientation of the neutral axis and loading waveform as that of the in vivo study, the developed model predicts site-specificity as shown in Fig. 8(D), which is approximately similar to that of the in vivo bone formation (p > 0.99, for both periosteal and endocortical surfaces for Watson’s U2 test). Both have new bone formation on medial and lateral sides.
Summary of Results and Future Work
-
The newly developed mathematical model is able to predict lamellar periosteal BFR/BS and site-specific MAR for not only cantilever loading but also for axial loading cases, as evident from Section 3.1.1 to 3.1.3.
-
For four-point loading case (Section 3.1.4), the model also works for predicting lamellar periosteal BFR/BS, while site-specificity could not be tested due to unavailability of data.
-
As demonstrated in Section 3.1.5, the inverted model predicts the strain distribution that would produce the prescribed site-specific lamellar periosteal MAR and thus the force required for the desired new lamellar bone formation.
-
As described in Section 3.2, the current mathematical model is unable to predict BFR/BS and site-specific MAR at endocortical surfaces. There are three reasons for that – (i) the endocortical surfaces respond differently than periosteal surfaces10,44,47, (ii) there is a continuous age-dependent bone resorption at endocortical surface in normal adults44,50, and (iii) endocortical surfaces are more responsive to exogenous loading than periosteal surface39,44,46. These have not been implemented in the current model and this has been acknowledged as a limitation.
-
As discussed in Section 3.3, the model is also unable to predict woven BFR/BS and site-specific MAR at either of periosteal and endocortical surfaces. This is because the woven bone is formed by a different osteogenic mechanism than that of lamellar bone formation22,42,51.
-
As such, new bone formation at endocortical surface is more complex than that at periosteal surface. Mathematical modeling of endocortical new bone formation itself would be more difficult and therefore has been taken as future work.
-
Similarly, developing a model of woven bone adaptation itself would be a major task and hence would be taken as a future work.
Discussion
The results establish that there are four main mechanical factors on which new bone formation depends. The first is how much the induced normal strain is above the threshold value (εthres). This factor is responsible for why there is no bone formation when induced strains are within the threshold value. The second factor is the ratio of trough-to-crest amplitude of normal strain and the maximum magnitude of normal strain. This ratio brings out the difference between loading waveforms with and without rest inserted between two consecutive waveforms. Assuming bone to be simply elastic does not differentiate between these two kinds of loading waveforms, whereas assuming bone to be viscoelastic does. This emphasizes the role interstitial fluid flow plays in new bone formation. This accounts for why rest-inserted loading is more osteogenic than a loading without any rest. The third factor is the number of cycles of a waveform. Larger the number of loading cycles, the more is the new bone formation; however, the osteogenic potential of each loading cycle is less than that of the previous cycle. This is akin to the fatigue damage accumulation and hints at possible role of micro-cracks in new bone formation. The fourth factor is the number of days of loading per week. Larger the number of days, the greater is the new bone formation; however, osteogenic potential of each day of loading is less than the previous one. Factor β being slightly larger than the factor q indicates that daily loading is better than the same total number of cycles spread over less number of days.
The main feature of the developed model is that it is invertible, i.e. load magnitude and directions or alternatively, strain distribution on the cross-section can be found out that would induce a desired site-specific new bone formation. The ‘average BFR model’, ‘site-specific model’ and the ‘inverted model’ developed here may be extended for clinical purposes. For example, the magnitude and direction of mechanical loading may be in future, prescribed by orthopaedic surgeons for a desired overall or site-specific new bone formation. Researchers can also estimate loading for a desired BFR.
The average BFR model can be established for any kind of loading condition – cantilever, 3-point, 4-point or axial loading. For a given loading condition, there are five variables – peak strain, unit waveform, rest between two loading waveforms, number of cycles everyday and number of days of loading every week, out of which the peak strain can be found out applying equation (18). Alternatively, the number of cycles can be determined if the other four are prescribed along with the desired BFR.
For the given unit loading waveform, rest between two waveforms, the number of cycles everyday and the number of loading days per week, the inverted model is able to find the normal force (\({F}_{z}^{0}\)) and bending moments (\({M}_{x}^{0}\),\(\,{M}_{y}^{0}\)) at the section that would get the desired new bone formation. This inverted model can be used when a given site-specific new bone distribution is desired. A small normal force will indicate no axial loading and the neutral axis in that case will pass approximately through the centroid of the section. The angle \({\tan }^{-1}({M}_{y}^{0}/{M}_{x}^{0})\) is the approximate orientation of the neutral axis to the medial-lateral direction. In order to get the given site-specific MAR, a bone is loaded such that the net normal force is \({F}_{z}^{0}\), bending moment is \(\sqrt{{({M}_{x}^{0})}^{2}+{({M}_{y}^{0})}^{2}}\) and the neutral axis is approximately oriented \({\tan }^{-1}({M}_{y}^{0}/{M}_{x}^{0})\) angle to the medial-lateral direction.
In general, the developed mathematical model approximately predicted periosteal lamellar bone formation both in terms of the average BFR and site-specific MAR distribution. Some differences may be attributed to the difference in age, section shapes, calcein labeling days, and coordinates of osteocytes and osteoblasts. The model does not incorporate woven bone formation, age-related bone resorption and enhanced response of endocortical surface to exogenous loading, and, therefore, cannot predict woven bone formation rate and endocortical remodeling. The site specificity can, however, still be predicted for woven bone, as evident from the 3-point and 4-point loading cases described in Section 3.3.
Conclusions
In summary, the elegant mathematical relationships developed here are robust as they approximately hold true for diverse loading conditions. These relationships are also invertible, which implies that it will make possible for the orthopaedic surgeons to readily compute and prescribe an exercise that would lead to a desired new bone formation. The current model can be improved further by incorporating natural endocortical resorption and woven bone formation at elevated strain environment. Even for lamellar bone formation, the model can be made more robust by taking into account the age of the mice, calcein labeling days, total weeks of loading, and also testing it for a large number of cases. For that, however, a very large number of experimental data will be needed covering variety of loading conditions, peak strains, loading waveforms, rest periods, number of cycles per loading bout, number of bouts per week, total number of loading weeks, period of calcein labeling, age of animals etc. In spite of unavailability of such large data in the literature, the current model attempts to connect presently available data for diverse loading conditions into a single mathematical model.
Data Availability
All experimental data used in this work (such as the shape of bone cross-section, the locations of osteoblasts and osteocytes on the section, bone formation rate (BFR), site-specific MAR etc.) are from publicly available literature, as mentioned in the manuscript.
References
Wolff, J. Ueber die innere Architectur der Knochen und ihre Bedeutung für die Frage vom Knochenwachsthum. Arch. Für Pathol. Anat. Physiol. Für Klin. Med. 50, 389–450 (1870).
Jones, H. H., Priest, J. D., Hayes, W. C., Tichenor, C. C. & Nagel, D. A. Humeral hypertrophy in response to exercise. J. Bone Joint Surg. Am. 59, 204–208 (1977).
Lang, T. et al. Cortical and Trabecular Bone Mineral Loss From the Spine and Hip in Long-Duration Spaceflight. J. Bone Miner. Res. 19, 1006–1012 (2004).
Rubin, C. T. & Lanyon, L. E. Dynamic strain similarity in vertebrates; an alternative to allometric limb bone scaling. J. Theor. Biol. 107, 321–327 (1984).
Frost, H. M. Bone ‘mass’ and the ‘mechanostat’: A proposal. Anat. Rec. 219, 1–9 (1987).
Moustafa, A. et al. Mechanical loading-related changes in osteocyte sclerostin expression in mice are more closely associated with the subsequent osteogenic response than the peak strains engendered. Osteoporos. Int. 23, 1225–1234 (2012).
Srinivasan, S. et al. Rescuing Loading Induced Bone Formation at Senescence. PLoS Comput. Biol. 6, e1000924 (2010).
Burr, D. B., Robling, A. G. & Turner, C. H. Effects of biomechanical stress on bones in animals. Bone 30, 781–786 (2002).
Sun, D., Brodt, M. D., Zannit, H. M., Holguin, N. & Silva, M. J. Evaluation of loading parameters for murine axial tibial loading: Stimulating cortical bone formation while reducing loading duration: evaluation of loading parameters for murine axial tibial. J. Orthop. Res. https://doi.org/10.1002/jor.23727 (2017).
Tiwari, A. K. & Prasad, J. Computer modelling of bone’s adaptation: the role of normal strain, shear strain and fluid flow. Biomech. Model. Mechanobiol. 16, 395–410 (2017).
Carter, D. R., Fyhrie, D. P. & Whalen, R. T. Trabecular bone density and loading history: regulation of connective tissue biology by mechanical energy. J. Biomech. 20, 785–794 (1987).
Turner, C. H. Three rules for bone adaptation to mechanical stimuli. Bone 23, 399–407 (1998).
Cowin, S. C. Bone stress adaptation models. J. Biomech. Eng. 115, 528–533 (1993).
Pereira, A. F., Javaheri, B., Pitsillides, A. A. & Shefelbine, S. J. Predicting cortical bone adaptation to axial loading in the mouse tibia. J. R. Soc. Interface 12, 20150590 (2015).
Srinivasan, S., Gross, T. S. & Bain, S. D. Bone mechanotransduction may require augmentation in order to strengthen the senescent skeleton. Ageing Res. Rev. 11, 353–360 (2012).
Jing, D. et al. In situ intracellular calcium oscillations in osteocytes in intact mouse long bones under dynamic mechanical loading. FASEB J. 28, 1582–1592 (2014).
Donahue, S. W., Jacobs, C. R. & Donahue, H. J. Flow-induced calcium oscillations in rat osteoblasts are age, loading frequency, and shear stress dependent. Am. J. Physiol. Cell Physiol. 281, C1635–1641 (2001).
Donahue, B. S. & Abercrombie, R. F. Free diffusion coefficient of ionic calcium in cytoplasm. Cell Calcium 8, 437–448 (1987).
You, L.-D., Weinbaum, S., Cowin, S. C. & Schaffler, M. B. Ultrastructure of the osteocyte process and its pericellular matrix. Anat. Rec. 278A, 505–513 (2004).
Ausk, B. J., Gross, T. S. & Srinivasan, S. An agent based model for real-time signaling induced in osteocytic networks by mechanical stimuli. J. Biomech. 39, 2638–2646 (2006).
Sakai, D. et al. Remodeling of Actin Cytoskeleton in Mouse Periosteal Cells under Mechanical Loading Induces Periosteal Cell Proliferation during Bone Formation. PLoS ONE 6, e24847 (2011).
Turner, C. H., Forwood, M. R., Rho, J.-Y. & Yoshikawa, T. Mechanical loading thresholds for lamellar and woven bone formation. J. Bone Miner. Res. 9, 87–97 (2009).
Dempster, D. W. et al. Standardized nomenclature, symbols, and units for bone histomorphometry: A 2012 update of the report of the ASBMR Histomorphometry Nomenclature Committee. J. Bone Miner. Res. 28, 2–17 (2013).
Prasad, J., Wiater, B. P., Nork, S. E., Bain, S. D. & Gross, T. S. Characterizing gait induced normal strains in a murine tibia cortical bone defect model. J. Biomech. 43, 2765–2770 (2010).
Wöhler, A. Über die Festigkeitsversuche mit Eisen und Stahl. In Zeitschrift für Bauwesen 20, 73–106 (Ernst & Korn, 1870).
Mechanics of materials. (McGraw-Hill Education, 2015).
SageMath, the Sage Mathematics Software System. (The Sage Developers, 2015).
Levenberg, K. A method for the solution of certain non-linear problems in least squares. Q. Appl. Math. 2, 164–168 (1944).
Marquardt, D. W. An Algorithm for Least-Squares Estimation of Nonlinear Parameters. J. Soc. Ind. Appl. Math. 11, 431–441 (1963).
Willie, B. M. et al. Diminished response to in vivo mechanical loading in trabecular and not cortical bone in adulthood of female C57Bl/6 mice coincides with a reduction in deformation to load. Bone 55, 335–346 (2013).
Weatherholt, A. M., Fuchs, R. K. & Warden, S. J. Cortical and trabecular bone adaptation to incremental load magnitudes using the mouse tibial axial compression loading model. Bone 52, 372–379 (2013).
LaMothe, J. M. Rest insertion combined with high-frequency loading enhances osteogenesis. J. Appl. Physiol. 96, 1788–1793 (2004).
Matsumoto, H. N., Koyama, Y. & Takakuda, K. Effect of Mechanical Loading Timeline on Periosteal Bone Formation. J. Biomech. Sci. Eng. 3, 176–187 (2008).
Roberts, M. D., Santner, T. J. & Hart, R. T. Local bone formation due to combined mechanical loading and intermittent hPTH-(1-34) treatment and its correlation to mechanical signal distributions. J. Biomech. 42, 2431–2438 (2009).
Scilab: Free and Open Source software for numerical computation. (Scilab Enterprises, 2015).
Watson, G. S. Goodness-Of-Fit Tests on a Circle. Biometrika 48, 109 (1961).
Watson, G. S. Goodness-of-Fit Tests on a Circle. II. Biometrika 49, 57 (1962).
Stephens, M. A. Use of the Kolmogorov-Smirnov, Cramer-von Mises and related statistics without extensive tables. J. R. Stat. Soc. 32, 115–122 (1970).
Mahaffey, I., Cole, W., Russell, A. & Castillo, A. B. Aging mice exhibit reduced periosteal and greater endosteal bone formation in response to two weeks of axial compressive loading compared to adult mice. In Proceedings of the Orthopaedic Research Society 38, Session PS1-018, Poster No. 0643 (59th Annual Meeting of the Orthopaedic Research Society, San Antonio, Texas, 2013).
Kuruvilla, S. J., Fox, S. D., Cullen, D. M. & Akhter, M. P. Site specific bone adaptation response to mechanical loading. J. Musculoskelet. Neuronal Interact. 8, 71–78 (2008).
De Souza, R. L. et al. Non-invasive axial loading of mouse tibiae increases cortical bone formation and modifies trabecular organization: A new model to study cortical and cancellous compartments in a single loaded element. Bone 37, 810–818 (2005).
Sugiyama, T. et al. Bones’ adaptive response to mechanical loading is essentially linear between the low strains associated with disuse and the high strains associated with the lamellar/woven bone transition. J. Bone Miner. Res. 27, 1784–1793 (2012).
Sugiyama, T., Price, J. S. & Lanyon, L. E. Functional adaptation to mechanical loading in both cortical and cancellous bone is controlled locally and is confined to the loaded bones. Bone 46, 314–321 (2010).
Birkhold, A. I. et al. The Periosteal Bone Surface is Less Mechano-Responsive than the Endocortical. Sci. Rep. 6 (2016).
Patel, T. K., Brodt, M. D. & Silva, M. J. Experimental and finite element analysis of strains induced by axial tibial compression in young-adult and old female C57Bl/6 mice. J. Biomech. 47, 451–457 (2014).
Turner, C., Owan, I., Alvey, T., Hulman, J. & Hock, J. Recruitment and Proliferative Responses of Osteoblasts After Mechanical Loading In Vivo Determined Using Sustained-Release Bromodeoxyuridine. Bone 22, 463–469 (1998).
Tiwari, A. K. & Prasad, J. Finding the difference between periosteal and endocortical bone adaptation by using Artificial Neural Networks. BioRxiv. https://doi.org/10.1101/357871 (2018).
Srinivasan, S., Weimer, D. A., Agans, S. C., Bain, S. D. & Gross, T. S. Low-Magnitude Mechanical Loading Becomes Osteogenic When Rest Is Inserted Between Each Load Cycle. J. Bone Miner. Res. 17, 1613–1620 (2002).
Srinivasan, S. et al. Distinct Cyclosporin A Doses Are Required to Enhance Bone Formation Induced by Cyclic and Rest-Inserted Loading in the Senescent Skeleton. PLoS ONE 9, e84868 (2014).
Frost, H. M. From Wolff’s law to the Utah paradigm: Insights about bone physiology and its clinical applications. Anat. Rec. 262, 398–419 (2001).
Gorski, J. P. Is all bone the same? Distinctive distributions and properties of non-collagenous matrix proteins in lamellar vs. woven bone imply the existence of different underlying osteogenic mechanisms. Crit. Rev. Oral Biol. Med. Off. Publ. Am. Assoc. Oral Biol. 9, 201–223 (1998).
Acknowledgements
The authors acknowledge funding from the Science and Engineering Research Board (SERB), a statutory body of the Department of Science and Technology (DST), Government of India (grant no. SB/S3/MMER/0046/2013) for this work.
Author information
Authors and Affiliations
Contributions
J.P. conceived of the study, designed the study, received the funding, coordinated the study and drafted the manuscript; A.G. participated in the design of the study, collected data from the literature, participated in data analysis, carried out the statistical analyses. Both authors gave final approval for publication.
Corresponding author
Ethics declarations
Competing Interests
The authors declare no competing interests.
Additional information
Publisher’s note: Springer Nature remains neutral with regard to jurisdictional claims in published maps and institutional affiliations.
Supplementary information
Rights and permissions
Open Access This article is licensed under a Creative Commons Attribution 4.0 International License, which permits use, sharing, adaptation, distribution and reproduction in any medium or format, as long as you give appropriate credit to the original author(s) and the source, provide a link to the Creative Commons license, and indicate if changes were made. The images or other third party material in this article are included in the article’s Creative Commons license, unless indicated otherwise in a credit line to the material. If material is not included in the article’s Creative Commons license and your intended use is not permitted by statutory regulation or exceeds the permitted use, you will need to obtain permission directly from the copyright holder. To view a copy of this license, visit http://creativecommons.org/licenses/by/4.0/.
About this article

Cite this article
Prasad, J., Goyal, A. An Invertible Mathematical Model of Cortical Bone’s Adaptation to Mechanical Loading. Sci Rep 9, 5890 (2019). https://doi.org/10.1038/s41598-019-42378-5
Received:
Accepted:
Published:
DOI: https://doi.org/10.1038/s41598-019-42378-5
This article is cited by
-
Using Finite Element Modeling in Bone Mechanoadaptation
Current Osteoporosis Reports (2023)
-
An in silico model for woven bone adaptation to heavy loading conditions in murine tibia
Biomechanics and Modeling in Mechanobiology (2022)
Comments
By submitting a comment you agree to abide by our Terms and Community Guidelines. If you find something abusive or that does not comply with our terms or guidelines please flag it as inappropriate.
