
Abstract
Sacroiliac (SI) screw loosening may indicate persistent instability, non-union and contribute to pain. Yet, there is no reliable objective measurement technique to detect and monitor SI screw loosening. In 9 cadaveric pelvises one of two SI screw was turned back approximately 20 mm and subsequently assessed by optical measurement, fluoroscopy and a 3D scan using an image intensifier. CTs were segmented and a contour-based registration of the 3D models and the fluoroscopies was performed to measure SI backing out (X-ray module). Three independent observers performed measurements with three repetitions. Deviation of the measurement techniques to the 3D scan, intra- and interrater reliabilities and method equivalence to the 3D scan were assessed. The X-ray module and two fluoroscopic measurement techniques yielded a difference less than 5 mm compared to the 3D scan and equivalence to the 3D scan. Intrarater reliability was for two observers and almost all techniques very good. Three fluoroscopic measurement techniques and optical measurements displayed a very good interrater reliability. The 3D scan and X-ray module yielded the most precise values for SI screw loosening but only the fluoroscopic measurement of the inlet lateral loosening displayed a good reliability and equivalence to the 3D scan.
Introduction
Sacroiliac (SI) screw loosening may cause pain and indicate missing fracture healing and persistent instability1,2,3. In the elderly, this is most probably caused by a decreased bone stock in the alar region but also in the sacral body1,4,5,6,7. The incidence of SI screw loosening with a backing out of the SI screw was described with 2–20% and fractures of the vertical shear type were identified as risk factor1,2,3,7,8,9. Nonetheless, SI screw loosening did not generally lead to pain or indicate instability1,3,8. Especially if the SI screw loosening persists without progress, revision surgery is not required1,3,8. Though previous studies described SI screw loosening qualitatively1,2,3,5,7, quantitative measurement techniques were not mentioned bearing the risk to overlook SI screw loosening progression and leading to missing data regarding values indicating clinical relevant SI screw loosening.
The assessment of the healing progress is not only based on the functional outcome, but also radiographic follow-up is of high interest10. However, the reliability of radiological measurement methods has to be assessed before correlating functional and radiological outcome11.
Radiographic measurement techniques, previously introduced to determine pelvic fracture reduction, revealed a poor level of evidence, missing standardization, reliability assessment and a lack of instructions how to perform the measurement10. Lefaivre et al.11 examined the interrater reliability of some promising radiographic techniques and observed poor to moderate results. Only the cross-measurement technique of Keshishyan et al.12 assessing pelvic instability yielded excellent results11. Especially for the posterior pelvic ring a poor reliability of radiographic measurements was observed13. In spine surgery, CT was proposed to assess implant loosening14. More sophisticated and expensive examinations such as single photon emission computed tomography (SPECT)/computed tomography (CT) are highly sensitive and specific detecting implant loosening14,15. However, the tracer uptake might be increased within the first year after surgery leading to false- positive results14,15. Taking the time of SI screw loosening into account (6–69 days) false-positive results might be determined1. There is lacking evidence describing techniques to assess specifically SI screw loosening with readily available conventional X-ray.
As yet there are no reliable methods to quantify SI screw loosening, we aimed to develop and study different methods using cadavers. We investigated three-dimensional (3D) scan, optical measurements, a novel developed X-ray module and fluoroscopic measurement techniques to reveal an accurate and reliable measurement technique to detect and monitor SI screw loosening.
Materials and Methods
Ethical statement
Cadaver pelvises were obtained from body donors who gave their signed consent for the use of their bodies for educational and research purposes in medical school in accordance to the Saxonian Death and Funeral Act of 1994.
Cadavers
Nine fresh-frozen cadaveric pelvises (mean age: 85.89 ± 4.96 years; 3 female, 6 male; Supplementary Table S1) were analysed. The complete pelvic ring including the fifth lumbar vertebra was obtained. Surrounding soft tissue and femora were removed and the ligamentous structures were preserved. The pelvises were used beforehand in a biomechanical study of Höch et al.16 to test the stability of augmented vs. non-augmented SI screws. Therefore, both-sided alar fracture of the sacrum was set with an oscillating saw and the symphysis was cut16. In each pelvis, one side was fixed with a single non-augmented fenestrated SI screw in S1 and the other with a single bone cement (3 ml polymethylmethacrylat [PMMA]) augmented fenestrated SI screw in S1. For the present study, the non-augmented SI screw was retracted in each pelvis after biomechanical testing (Supplementary Table S1).
Scenario definition and SI screw loosening
The position of the non-augmented SI screw was investigated by CT (voxel size: 0.71 × 0.071 × 3 mm, axial orientation, Brilliance, Philips Medical Systems, Cleveland, USA) and fluoroscopic images (anterior-posterior [AP], outlet, and inlet view). This was defined as non-implant failure time point (T0) (Fig. 1). Then, the non-augmented SI screw was turned back manually approximately 20 mm (18.9 ± 3 mm). This was measured by a parallel-applied Kirschner wire (K-wire) comparable to a measurement with a calliper13. Three independent observers at three repetitions performed all below- mentioned measurements.

Study protocol and data acquisition. A CT-scan and fluoroscopic images (anterior-posterior [AP], outlet, and inlet view) were obtained at the non-implant failure time point (T0) after biomechanical testing16. The CT scan was used to generate a 3D model. Subsequently, the non-augmented screw was turned back. Now, at the implant failure time point (T1), a 3D scan, an optical measurement, and fluoroscopy were performed. Fluoroscopy was registered to the previously generated 3D model and with the X-ray module the SI screw turn back was computed. The SI screw loosening was calculated (T1 − T0) using fluoroscopic images and assessed in the 3D scan and the optical measurement.
3D Scan based measurements
At T1, an axial 3D scan with a voxel size of 0.38 × 0.38 × 1 mm was generated with the image intensifier Ziehm Vision FD Vario 3D© (Ziehm Imaging GmbH, Nürnberg, Germany). The scan centre was set at the anterior-posterior centre of the SI joint of the loosened SI screw. For each pelvis a scan was carried out, exported in DICOM format and imported in Mimics (Version 16, Materialise, Leuven, Belgium). The distance of the SI screw turning back was measured in the slice of the maximum radiolucency (chosen by each observer individually). The turn back was measured from the tip of the screw to the end of the visible radiolucency created by the bone void of the manually turned back SI screw (Fig. 2A, red line)17.

Measurement of SI screw loosening using the 3D scan (A), optical measurement (B) and the X-ray module (C), n = 9. (A) SI screw turn back (red line) indicated by the radiolucency was measured in the 3D scan. (B) Optical measurement: A K-wire within a drill sleeve was applied parallel to the SI screw. After retraction of the drill sleeve to the screw head, the length of the extruding K-wire was assessed after placing on millimetre paper using ImageJ (black line). (C) X ray module: A 3D model based on the CT scan was generated using Mimics and each fluoroscopic image (AP, outlet, inlet) of T1 was manually registered to the beforehand-created 3D model (C1). The registration was further enhanced by contour-based registration (C2). One screw model (in red) was adjusted to the screw position of the CT scan, another screw model (green) was positioned according to the fluoroscopic images of T1 (green screw). The distance between these screws (white line) was measured.
Optical measurement
As mentioned above, the screw turn back was controlled by a parallel set K-wire, in a comparable manner as done with a calliper13. Following screw turn back (T1), each pelvis was placed on millimetre paper with the SI screw parallel to the millimetre paper. A K-wire in a drill sleeve was set parallel to the turned back SI screw with the tip in contact with the cortical bone. The drill sleeve was retracted up to the level of the screw head, placed on the millimetre paper and photographed (Fig. 2B, black line). SI screw loosening was defined as distance from the tip of the K-wire to the drill sleeve and measured using Image J (ImageJ 1.43, imagej.nih.gov/ij/). Considering the interindividual application of the K-wire and previous obtained similar values for manual and digital measurements18, all observers measured the SI screw turn back digitally in photographs.
2D/3D Image registration using the X-ray module
DICOM data of the CT scan at T0 were imported into Mimics. M.L. segmented manually the cortical bone of the innominate bones, sacrum, fracture fragments and SI screws separately. On the basis of these segmentations the 3D model was generated.
The fluoroscopic images (AP, outlet, inlet) of T1 were imported using the X-ray module of Mimics (Fig. 2C). The following steps were performed by each observer for each repetition.
The sacrum, fracture fragments and the non-loosened SI screw were used as reference to match the fluoroscopic images on the 3D model (Fig. 2C1). We used the contour-based registration function of the X-ray module to improve the manual performed overlay of the 3D model and fluoroscopic images (Fig. 2C2). A stereo lithography (STL) file of the SI screw, with the respective length (75–90 mm), was imported and positioned to the SI screw location within the CT scan (T0). Subsequently, we duplicated the STL file of the SI screw. The duplicate was then set to the position found in the fluoroscopy (T1, Fig. 2C3).
SI screw turn back was determined using the centre of mass translation function of the X-ray module to assess the distance of the two virtual screws.
Fluoroscopic measurements
To determine SI screw turn back, we used the following workflow after the import and registration of all fluoroscopic images of T0 and T1:
-
1.
The cranial sacral alae were connected19 (Fig. 3 line 1) in AP and outlet views.
Figure 3 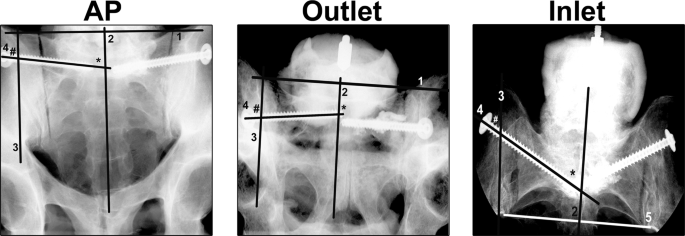
Fluoroscopic Measurements. Line 1 connects the most cranial projections of the sacral alae horizontally (1) in the anterior-posterior (AP) and outlet view. Line 2 runs through the spinous processes of the sacrum, line 3 indicates the lateral borders of the sacral ala and line 4 marks the course of the loosened SI screw. In the inlet view the most ventral parts of the sacral alae were connected horizontally by line 5. Line 2 and 3 were set perpendicular to line 1 in AP and outlet view or respectively to line 5 in the inlet view. Medial loosening (*) was determined on line 4 as distance from the tip of the screw to line 2. The lateral loosening (#) was measured on line 4 as distance from the screw head to line 3.
-
2.
Perpendicular to the cranial connection of the sacral alae, the sacral midline was defined at the level of the sacral processes (Fig. 3, line 2).
-
3.
For the inlet view, the sacral midline (Fig. 3, line 2) was perpendicular to a line connecting the most ventral located portion of the sacral alae (Fig. 3, line 5).
-
4.
Perpendicular to line 1 (AP, outlet) or line 5 (inlet) a line marking the superior lateral border or respectively the lateral border of sacral alae was set (Fig. 3, line 3).
-
5.
The course of the SI screw was marked (Fig. 3, line 4).

Screw turn back was calculated as difference (T1 − T0) of the values obtained before (T0) and after (T1) SI screw turn back in each pelvis in AP, inlet and outlet views. The medial loosening (Fig. 3, *) was determined as distance of the SI screw tip to the sacral midline (Fig. 3, line 2). The lateral loosening (Fig. 3, #) was defined as the distance between the screw head and the superior lateral border/lateral border of the sacral alae (Fig. 3, line 3).
Four pelvises were excluded form fluoroscopic measurements because at least one of the used lines was not visualized due to an overlaying polyurethane block fixing the fifth lumbar vertebra or to the limited range of image space. For the remaining imaging methods, all nine pelvises were evaluated.
Raw data
Descriptive statistics were carried out for all data as mean ± standard deviation (SD) and corresponding range independent of observer and measurement repetition using Graph Pad Prism 7 (GraphPad software, La Jolla, CA, USA). The theoretical accuracy of each method was obtained from the pixel solution of the respective data.
Differences of the measurement techniques to the 3D scan
Data regardless of observer and repetition were merged and mean values for the 3D scan and other methods were generated for each pelvis specifically. The differences between the 3D scan and each method were calculated for each pelvis as absolute value. The here-obtained data were merged and are presented as mean ± SD including range.
Intrarater Reliability - ICC (1)
The raw data without generating a mean value were used to study the reliability for each measurement method using a MatLab script (Version R2013a, MathWorks, Natick, Massachusetts, USA).
ICC (1) was chosen in accordance to McGraw and Wong 1996 to estimate the reproducibility of observer data in relation to the performed repetitions20. Thus, measurements of each obtained value on the basis of the measurement method from a specific pelvis are interchangeable but the measurements of observers and the other pelvis are not. The grading of Landis and Koch21,22 were applied: ICC(1) 1 perfect, 0.81–1 very good, 0.61–0.80 good, 0.41–0.60 moderate, <0.4 poor. The 95% confidence interval (95% CI) was used to define upper (97.5% of values) and lower limit (2.5% of values). If the CI was <0, it was set to 0 related to the definition of the investigated range of ICC (0 to 1). Data are presented as mean and 95% CI.
Interrater Reliability - ICC (A,1)
Accordingly, to assess intrarater reliability the raw data for each measurement method, pelvis and the three observer data and their repetitions were used. Prior to analyses, a mean value of the three repetitions of each observer for each pelvis and measurement method was generated. The ICC (A,1) was chosen to compare the repeatability between observers20. Hence, within the measurement methods the measurements for the pelvis might be changed but the observer data are not interchangeable. The criteria for ICC (A,1) were analysed regarding confidence interval and quality as done for the ICC (1). Data are presented as mean and 95% CI.
Method Comparison
The 3D scan was defined as “gold standard” as CT is the recommended radiological examination to detect implant related complications in spine surgery14.
A mean value of the three repetitions of each observer for each pelvis and measurement method was generated. The generated mean values of each measurement method were subtracted from the mean value of the 3D scan for each pelvis and observer. These difference values were averaged and presented. To verify the application of the 3D scan as “gold standard”, the data of the K-wire measured screw turn back (Supplementary Tables S1 and S4) were included in the method comparison.
A two one-sided test was used estimating equality/divergence of each method to the 3D scan. First, a mean value (1) for all measurement methods was generated for each observer based on the three repetitions for each pelvis. These mean values (1) were pooled for each measurement method and new mean values (2) including standard deviation were generated which were used for the analysis23 using a MatLab script. Methods were considered equal if the 95% CI of the measurement method was fully contained in the extreme values (minimum, maximum) of the 3D scan. Values are presented as absolute deviation from “gold standard” (mean and 95% CI). The minimal detectable screw extrusion was determined based on the 95% CI from each method.
Results
The obtained data of SI screw loosening for each pelvis were merged and the mean ± SD as well as the range are indicated in Supplementary Tables S2 and S3. The theoretical accuracies for all methods were 0.4 mm, calculated on the basis of the respective image solution.
Differences of the measurement techniques to the 3D scan
The determined SI screw turn back in the 3D scan as well as the differences between the 3D scan and each method are summarized in Table 1.
None of the used method showed a difference of more than 10 mm compared to the 3D scan. The X-ray module, the medial outlet loosening and the inlet lateral loosening yielded differences less than 5 mm.
Intrarater Reliability ICC (1)
The ICC (1) using 3D scan was very good for observer 1 and 2 and good for observer 3 (Table 2). The ICC (1) for the optical measurement was very good for all observers. The X-rays module yielded very good ICC (1) for observer 1 and 2 and a moderate ICC (1) for observer 3.
The following ICC (1) were determined for fluoroscopic measurements: AP medial loosening very good for observer 1 and 2 and good for observer 3, AP lateral loosening very good for all observers, outlet medial loosening was very good for observer 1 and 2 and good for observer 3, outlet lateral loosening very good for all observers, inlet medial loosening for observer 1 good, for observer 2 very good and for observer 3 poor, inlet lateral loosening very good for all observers.
Interrater Reliability ICC (A,1)
The ICC (A,1) was moderate for the 3D Scan (Table 3), very good for the optical measurement and poor for the X-ray module. Very good ICC (A,1) were obtained for AP lateral, inlet lateral, and outlet lateral loosening using fluoroscopy. The ICC (A,1) was good for AP medial loosening, moderate for outlet lateral loosening, and poor for inlet medial loosening.
Method Comparison
The mean deviation from the K-wire measured SI screw turn back (Supplementary Table S1) to the 3D scan was 0.6 mm.
To estimate methodological identity, we used the extreme values of the 3D scan (−4.9 mm; 5.7 mm) to construct its “equivalence interval”. Comparing the absolute differences of the measurement methods yielded values presented in Supplementary Table S4 and Fig. 4. This analysis revealed the K-wire measured screw turn back equivalent to the 3D scan and supports the use of the 3D scan as suitable “gold standard” (Fig. 4). Furthermore, the X-ray module, outlet medial loosening and inlet lateral loosening were identified as equivalent to the 3D scan. The other methods were out of the predefined range.

Method comparison. A mean value of the three repetitions of each observer for each pelvis and measurement method was calculated. These generated mean values of each measurement method were subtracted from the mean value of the 3D scan for each pelvis and observer. Subsequently, these difference values were averaged and presented as mean and 95% CI. Extreme values of the 3D scan are indicated by the dotted lines. KST K wire measured screw turn back. *Methods considered equal to the 3D scan.
Based on the 95% CI of each method, the minimal measurable screw extrusion was calculated as followed: 3D scan 1.8 mm, optical measurement and X-ray module 2.3 mm, AP medial loosening 2.8 mm, AP lateral loosening 2.5 mm, outlet medial loosening 3.1 mm, outlet lateral loosening and inlet medial loosening 3 mm, inlet lateral loosening 2.5 mm.
Discussion
Compared to 3D scan, the most equivalent estimation of SI screw turn back was assessed by the application of the X-ray module and in fluoroscopy by measuring the inlet lateral loosening and the outlet medial loosening. These techniques yielded a deviation less than 5 mm compared to the 3D scan.
Percutaneous SI screw fixation is a common procedure for the fixation of unstable fractures of the pelvic ring24,25,26,27,28. A loosening rate of 2–20% for SI screws was reported1,2,3,7,8. Especially in the elderly population the loosening rate might rise up to 20%8. Radiography in AP, inlet and outlet projection are used to assess the instability of pelvic ring fractures29,30,31. Postoperatively, these radiographs are used to grade fracture reduction of the pelvic ring32,33. After mobilization, radiographs might reveal SI screw loosening indicating a possible persistent instability or non- union1,2,3,8. However, radiographic SI screw loosening was not always symptomatic, especially if there is no progression of the loosening1,8. Radiolucent lines, cup migration or gaps indicating cup loosening following hip arthroplasty34,35 or other criteria for implant loosening were previously not established on the pelvic ring possibly due to the impeded visualization of the posterior pelvic ring36,37.
Currently, there are no quantitative data on the assessment of SI screw loosening available. Recent studies generally stated if the SI screw is loosened or not1,2,3,8, therefore the definition of the critical SI screw loosening is not possible. To our best knowledge, no quantitative measurement techniques are published yet. Probably, the missing quantitative data are related to the impaired visualization of the posterior pelvic ring36,37 and the non- routinely performed CT scans.
Radiographs were found to be less accurate compared to CT determining the anteversion of the cup following hip arthroplasty38. Though the registration of a 3D model to plain radiographs and the subsequent determination of the acetabular cup position yielded comparable results, the CT scan remains the “gold standard” for the determination of acetabular cup position39. The CT was also superior in the assessment of implant loosening following ankle replacement defined as osteolytic areas, when compared to radiographs40.
Due to individual sacral and lumbar anatomy, the angulation for optimal visualization of pelvic anatomy in AP, inlet and outlet radiographs is variable41,42,43,44,45. This leads to a different projection of the posterior pelvic ring and individualized outlet and inlet projection angles were proposed46,47. However, these individualized angles are difficult to obtain in daily routine. In the present study, the very good ICC (1) and ICC (A,1) for the inlet lateral loosening were not affected by the missing adaption of angulation for the inlet fluoroscopic view. In contrast, the missing adaption of the angulation might explain the worse ICC (A,1) of the outlet medial loosening though it was less than 5 mm different from 3D scan and yielded equivalence to the 3D scan. Thus, the impaired visualization of the bony structures used for the measurements might led to the differing values between the observers42,48. The good results of the inlet lateral loosening might be resulted from the consistent upper SI joint projection in the inlet view irrespective to the pelvic tilt. Nonetheless, all these parameters are sensitive to patient positioning, i.e. when the patient lies oblique on the table (symphysis is not centred on the sacral midline), the distances might be distorted.
Radiographic evaluation of the pelvic ring in the elderly is impaired and CT is recommended for fracture detection36,37. Recently it was shown that the fluoroscopy after SI screw fixation is insufficient to exclude malpositioning and a postoperative CT scan is required49.
In consideration of these data, also a possible impairment of SI screw loosening detection in radiographs might be discussed. Hence, in the present study radiographic measurements were compared to multi-dimensional fluoroscopy from a 3D image intensifier as “gold standard”. Indeed, 3D image intensifier based 3D scans are inferior compared to CT, but they still reveal satisfactory results regarding osteosynthesis position as reported for malpositioning rates of SI screws50,51,52. The improvement of multi-dimensional fluoroscopy by 3D image intensifiers allows appropriate evaluation of implant position and fracture reduction comparable to a CT scan17,53. We therefore considered the 3D scan as “gold standard” in the present study.
Beside an accurate determination of the implant loosening, a good radiographic measurement method should also display appropriate ICC (1) and ICC (A,1)10. Intrarater reliability (ICC (1)) was for two observers very good using the majority of measurement techniques. Possibly, the data of the remaining observer led to the worse ICC (A,1) determined especially for the 3D scan and X-ray module. In addition, the worse ICC (A,1) for those methods might be caused by the higher individual observer’s choice reducing the reliability11. Here, the observer decides independently the slice for measurement in the 3D scan and for optimal sizing as well as accuracy of the contour-based registration in the X-ray module possibly affecting the ICC (A,1).
All fluoroscopic measurements irrespective to their projection (AP, outlet, inlet) for the lateral loosening displayed a very good ICC (A,1), but only the X-ray module, outlet medial loosening and inlet lateral loosening yielded equivalence to the 3D scan. The AP view displayed at least good ICC (1) and ICC (A,1). However, no equivalence to the 3D scan and a higher absolute difference to 3D scan compared to other fluoroscopic measurements were detected. This might be caused by the disguised anatomical landmarks in the AP view, as previously discussed54.
Beside the opportunity reducing the choices of the observer, computer-based registrations and their improvement may increase the reliability55.
Our results are limited by the small sample size, especially for the fluoroscopic measurements (n = 5) leading to increased deviations compared to the remaining methods. The fluoroscopic measurement techniques presented better results due to the removal of internal organs and missing gas known to impair the visualization of the posterior pelvic ring36,37. Thus, future studies are needed to support the presented findings in a clinical setup and prove their validity. The measurements of fluoroscopies following 3D model registration might also increase the reliability due to the correct scaling which might be absent in the clinical practice except by the introduction of a scaling reference56. In the present study, the reference was digitally implicated by the registration to the 3D model and the results should not be impaired. But for clinical studies a reference should be included in radiographs. Furthermore, the clinically relevant SI screw extrusion remains unclear. The optical measurement may be underestimated related to the “false” higher values measured digitally; however using the here used approach we were also able to investigate the reliability of this method and in future studies we also recommend to analyse the validity and reliability of calliper based measurements. Moreover, besides SI screw turning back, also a cutout of SI screws or a washer penetration occurs16. This implant failure mode should also be evaluated; however the SI screw turn back is the most common observed failure and the only one which might be clinically inconspicuous or indicate persistent instability underlining the need for a quantitative differentiation1,3.
Although the X-ray module displayed the smallest deviation to the 3D scan, at least good ICC (1) and an equivalence to the 3D scan, the ICC (A,1) was poor. In contrast, determining the SI screw loosening as inlet lateral loosening showed beside a small deviation to the 3D scan, very good ICC (1), equivalence to the 3D scan also a very good ICC (A,1). Thus, using this method SI screw loosening can be monitored temporally and reduces the radiation for the patient by decreasing the need for CT scans. Moreover, the here presented results indicate the need for outlet and inlet views in the clinical follow- up after SI screw fixation. Furthermore, the X-ray module might be utilized to plan and control SI screw placement as well as to grade fracture reduction in radiographs after introducing reliable anatomical landmarks as known from hip arthroplasty for a faster registration39,49. In future studies the here presented measurement techniques should be validated in large clinical trials to reveal the clinically relevant SI screw loosening and correlate SI screw loosening to the functional outcome. Thus, the clinical consequence of SI screw loosening might be revealed. Here, we recommend measuring the lateral loosening in inlet radiographs.
Data Availability
The datasets generated and analysed during the current study are available from the corresponding author on reasonable request.
References
Reuther, G., Röhner, U., Will, T., Dehne, I. & Petereit, U. CT-guided screw fixation of vertical sacral fractures in local anaesthesia using a standard CT. RoFo: Fortschritte auf dem Gebiete der Rontgenstrahlen und der Nuklearmedizin 186, 1134–1139, https://doi.org/10.1055/s-0034-1366605 (2014).
Fischer, S. et al. Percutaneous cannulated screw fixation of sacral fractures and sacroiliac joint disruptions with CT-controlled guidewires performed by interventionalists: single center experience in treating posterior pelvic instability. European journal of radiology 84, 290–294, https://doi.org/10.1016/j.ejrad.2014.11.017 (2015).
Kim, J.-W. et al. The incidence of and factors affecting iliosacral screw loosening in pelvic ring injury. Archives of orthopaedic and trauma surgery 136, 921–927, https://doi.org/10.1007/s00402-016-2471-3 (2016).
Mears, S. C., Sutter, E. G., Wall, S. J., Rose, D. M. & Belkoff, S. M. Biomechanical comparison of three methods of sacral fracture fixation in osteoporotic bone. Spine 35, E392–5, https://doi.org/10.1097/BRS.0b013e3181cb4fcd (2010).
Griffin, D. R., Starr, A. J., Reinert, C. M., Jones, A. L. & Whitlock, S. Vertically unstable pelvic fractures fixed with percutaneous iliosacral screws: does posterior injury pattern predict fixation failure? Journal of orthopaedic trauma 17, 399–405 (2003).
Wagner, D. et al. Sacral Bone Mass Distribution Assessed by Averaged Three-Dimensional CT Models: Implications for Pathogenesis and Treatment of Fragility Fractures of the Sacrum. The Journal of bone and joint surgery. American volume 98, 584–590, https://doi.org/10.2106/JBJS.15.00726 (2016).
Sagi, H. C., Militano, U., Caron, T. & Lindvall, E. A comprehensive analysis with minimum 1-year follow-up of vertically unstable transforaminal sacral fractures treated with triangular osteosynthesis. Journal of orthopaedic trauma 23, 313–9; discussion 319–21; https://doi.org/10.1097/BOT.0b013e3181a32b91 (2009).
Eckardt, H. et al. Good functional outcome in patients suffering fragility fractures of the pelvis treated with percutaneous screw stabilisation. Assessment of complications and factors influencing failure. Injury 48, 2717–2723, https://doi.org/10.1016/j.injury.2017.11.002 (2017).
Grüneweller, N. et al. Biomechanical comparison of augmented versus non-augmented sacroiliac screws in a novel hemi-pelvis test model. Journal of orthopaedic research: official publication of the Orthopaedic Research Society 35, 1485–1493, https://doi.org/10.1002/jor.23401 (2017).
Lefaivre, K. A. et al. Methodology and interpretation of radiographic outcomes in surgically treated pelvic fractures: a systematic review. Journal of orthopaedic trauma 26, 474–481, https://doi.org/10.1097/BOT.0b013e3182323aa2 (2012).
Lefaivre, K. A., Blachut, P. A., Starr, A. J., Slobogean, G. P. & O’Brien, P. J. Radiographic displacement in pelvic ring disruption: reliability of 3 previously described measurement techniques. Journal of orthopaedic trauma 28, 160–166, https://doi.org/10.1097/BOT.0b013e31829efcc5 (2014).
Keshishyan, R. A. et al. Pelvic polyfractures in children. Radiographic diagnosis and treatment. Clinical orthopaedics and related research, 28–33 (1995).
Nystrom, L. M., McKinley, T. O. & Marsh, J. L. Accuracy in radiographic assessment of pelvic ring fracture deformity: analysis of current methods. Journal of orthopaedic trauma 27, 708–715, https://doi.org/10.1097/BOT.0b013e318298e6cf (2013).
Berquist, T. H. Imaging of the postoperative spine. Radiologic clinics of North America 44, 407–418, https://doi.org/10.1016/j.rcl.2006.01.002 (2006).
Hudyana, H. et al. Accuracy of bone SPECT/CT for identifying hardware loosening in patients who underwent lumbar fusion with pedicle screws. European journal of nuclear medicine and molecular imaging 43, 349–354, https://doi.org/10.1007/s00259-015-3158-7 (2016).
Höch, A. et al. Biomechanical analysis of stiffness and fracture displacement after using PMMA-augmented sacroiliac screw fixation for sacrum fractures. Biomedizinische Technik. Biomedical engineering 62, 421–428, https://doi.org/10.1515/bmt-2016-0235 (2017).
Ohashi, K., El-Khoury, G. Y., Bennett, D. L., Restrepo, J. M. & Berbaum, K. S. Orthopedic hardware complications diagnosed with multi-detector row CT. Radiology 237, 570–577, https://doi.org/10.1148/radiol.2372041681 (2005).
Pohl, M. B. & Farr, L. A comparison of foot arch measurement reliability using both digital photography and calliper methods. Journal of foot and ankle research 3, 14, https://doi.org/10.1186/1757-1146-3-14 (2010).
Boulay, C. et al. Three-dimensional study of pelvic asymmetry on anatomical specimens and its clinical perspectives. Journal of anatomy 208, 21–33, https://doi.org/10.1111/j.1469-7580.2006.00513.x (2006).
McGraw, K. O. & Wong, S. P. Forming inferences about some intraclass correlation coefficients. Psychological Methods 1, 30–46, https://doi.org/10.1037/1082-989X.1.1.30 (1996).
Landis, J. R. & Koch, G. G. The measurement of observer agreement for categorical data. Biometrics 33, 159–174 (1977).
Walter, S. D., Eliasziw, M. & Donner, A. Sample size and optimal designs for reliability studies. Statistics in medicine 17, 101–110 (1998).
Schuirmann, D. J. A comparison of the two one-sided tests procedure and the power approach for assessing the equivalence of average bioavailability. Journal of pharmacokinetics and biopharmaceutics 15, 657–680 (1987).
Routt, M. L., Simonian, P. T. & Mills, W. J. Iliosacral screw fixation. Early complications of the percutaneous technique. Journal of orthopaedic trauma 11, 584–589 (1997).
Rommens, P. M. & Hofmann, A. Comprehensive classification of fragility fractures of the pelvic ring. Recommendations for surgical treatment. Injury 44, 1733–1744, https://doi.org/10.1016/j.injury.2013.06.023 (2013).
Routt, M. L. & Simonian, P. T. Closed reduction and percutaneous skeletal fixation of sacral fractures. Clinical orthopaedics and related research, 121–128 (1996).
Rommens, P. M. et al. Clinical pathways for fragility fractures of the pelvic ring. Personal experience and review of the literature. Journal of orthopaedic science: official journal of the Japanese Orthopaedic Association 20, 1–11, https://doi.org/10.1007/s00776-014-0653-9 (2015).
Wagner, D., Ossendorf, C., Gruszka, D., Hofmann, A. & Rommens, P. M. Fragility fractures of the sacrum. How to identify and when to treat surgically? European journal of trauma and emergency surgery: official publication of the European Trauma Society 41, 349–362, https://doi.org/10.1007/s00068-015-0530-z (2015).
Pennal, G. F., Tile, M., Waddell, J. P. & Garside, H. Pelvic disruption. Assessment and classification. Clinical orthopaedics and related research, 12–21 (1980).
Swartz, J., Vaidya, R., Hudson, I., Oliphant, B. & Tonnos, F. Effect of Pelvic Binder Placement on OTA Classification of Pelvic Ring Injuries Using Computed Tomography. Does It Mask the Injury? Journal of orthopaedic trauma 30, 325–330, https://doi.org/10.1097/BOT.0000000000000515 (2016).
Fagg, J. A. C., Acharya, M. R., Chesser, T. J. S. & Ward, A. J. The value of ‘binder-off’ imaging to identify occult and unexpected pelvic ring injuries. Injury; https://doi.org/10.1016/j.injury.2017.11.023 (2017).
Moed, B. R. & Geer, B. L. S2 iliosacral screw fixation for disruptions of the posterior pelvic ring. A report of 49 cases. Journal of orthopaedic trauma 20, 378–383 (2006).
Matta, J. M. & Tornetta, P. Internal fixation of unstable pelvic ring injuries. Clinical orthopaedics and related research, 129–140 (1996).
Tallroth, K., Slätis, P., Ylinen, P., Paavolainen, P. & Paavilainen, T. Loosening of threaded acetabular components. Radiographic manifestations. The Journal of arthroplasty 8, 581–584 (1993).
Udomkiat, P., Wan, Z. & Dorr, L. D. Comparison of preoperative radiographs and intraoperative findings of fixation of hemispheric porous-coated sockets. The Journal of bone and joint surgery. American volume 83-A, 1865–1870 (2001).
Böhme, J., Höch, A., Boldt, A. & Josten, C. Einfluss der Standard-Computertomografie hinsichtlich Frakturklassifikation und Therapie von Beckenringfrakturen bei Patienten über dem 65. Lebensjahr. Zeitschrift fur Orthopadie und Unfallchirurgie 150, 477–483, https://doi.org/10.1055/s-0032-1315270 (2012).
Schicho, A. et al. Pelvic X-ray misses out on detecting sacral fractures in the elderly - Importance of CT imaging in blunt pelvic trauma. Injury 47, 707–710, https://doi.org/10.1016/j.injury.2016.01.027 (2016).
Schwarzkopf, R. et al. Quantification of Imaging Error in the Measurement of Cup Position. A Cadaveric Comparison of Radiographic and Computed Tomography Imaging. Orthopedics 40, e952–e958, https://doi.org/10.3928/01477447-20170918-03 (2017).
Craiovan, B. et al. Is the acetabular cup orientation after total hip arthroplasty on a two dimension or three dimension model accurate? International orthopaedics 38, 2009–2015, https://doi.org/10.1007/s00264-014-2336-8 (2014).
Viste, A. et al. Periprosthetic osteolysis after AES total ankle replacement. Conventional radiography versus CT-scan. Foot and ankle surgery: official journal of the European Society of Foot and Ankle Surgeons 21, 164–170, https://doi.org/10.1016/j.fas.2014.11.002 (2015).
Graves, M. L. & Routt, M. L. C. Iliosacral screw placement. Are uniplanar changes realistic based on standard fluoroscopic imaging? The Journal of trauma 71, 204–8; discussion 208; https://doi.org/10.1097/TA.0b013e31821e842a (2011).
Ricci, W. M., Mamczak, C., Tynan, M., Streubel, P. & Gardner, M. Pelvic inlet and outlet radiographs redefined. The Journal of bone and joint surgery. American volume 92, 1947–1953, https://doi.org/10.2106/JBJS.I.01580 (2010).
Miller, A. N. & Routt, M. L. C. Variations in sacral morphology and implications for iliosacral screw fixation. The Journal of the American Academy of Orthopaedic Surgeons 20, 8–16, https://doi.org/10.5435/JAAOS-20-01-008 (2012).
Zhang, J. et al. Evaluation of Partial Cut-out of Sacroiliac Screws From the Sacral Ala Slope via Pelvic Inlet and Outlet View. Spine 40, E1264–8, https://doi.org/10.1097/BRS.0000000000001134 (2015).
Wagner, D. et al. Morphometry of the sacrum and its implication on trans-sacral corridors using a computed tomography data-based three-dimensional statistical model. The spine journal: official journal of the North American Spine Society 17, 1141–1147, https://doi.org/10.1016/j.spinee.2017.03.023 (2017).
Eastman, J. G. & Routt, M. L. C. Correlating preoperative imaging with intraoperative fluoroscopy in iliosacral screw placement. Journal of orthopaedics and traumatology: official journal of the Italian Society of Orthopaedics and Traumatology 16, 309–316, https://doi.org/10.1007/s10195-015-0363-x (2015).
McAndrew, C. M., Merriman, D. J., Gardner, M. J. & Ricci, W. M. Standardized posterior pelvic imaging. Use of CT inlet and CT outlet for evaluation and management of pelvic ring injuries. Journal of orthopaedic trauma 28, 665–673, https://doi.org/10.1097/BOT.0000000000000127 (2014).
Ziran, B. H., Wasan, A. D., Marks, D. M., Olson, S. A. & Chapman, M. W. Fluoroscopic imaging guides of the posterior pelvis pertaining to iliosacral screw placement. The Journal of trauma 62, 347–56; discussion 356; https://doi.org/10.1097/01.ta.0000229789.18211.85 (2007).
Elnahal, W. A. et al. Routine Postoperative Computed Tomography Scans After Pelvic Fracture Fixation. A Necessity or a Luxury? Journal of orthopaedic trauma 32(Suppl 1), S66–S71, https://doi.org/10.1097/BOT.0000000000001092 (2018).
Zwingmann, J., Konrad, G., Kotter, E., Südkamp, N. P. & Oberst, M. Computer-navigated iliosacral screw insertion reduces malposition rate and radiation exposure. Clinical orthopaedics and related research 467, 1833–1838, https://doi.org/10.1007/s11999-008-0632-6 (2009).
Kotsianos, D. et al. 3D imaging with an isocentric mobile C-arm comparison of image quality with spiral CT. European radiology 14, 1590–1595, https://doi.org/10.1007/s00330-004-2316-2 (2004).
Thakkar, S. C. et al. 2D versus 3D fluoroscopy-based navigation in posterior pelvic fixation: review of the literature on current technology. International journal of computer assisted radiology and surgery 12, 69–76, https://doi.org/10.1007/s11548-016-1465-5 (2017).
Shaw, J. C., Routt, M. L. C. & Gary, J. L. Intra-operative multi-dimensional fluoroscopy of guidepin placement prior to iliosacral screw fixation for posterior pelvic ring injuries and sacroiliac dislocation: an early case series. International orthopaedics; https://doi.org/10.1007/s00264-017-3447-9 (2017).
Zhao, J.-X. et al. A computer aided measurement method for unstable pelvic fractures based on standardized radiographs. BMC medical imaging 15, 41, https://doi.org/10.1186/s12880-015-0084-x (2015).
Dimar, J. R. et al. Intra- and inter-observer reliability of determining radiographic sagittal parameters of the spine and pelvis using a manual and a computer-assisted methods. European spine journal: official publication of the European Spine Society, the European Spinal Deformity Society, and the European Section of the Cervical Spine Research Society 17, 1373–1379, https://doi.org/10.1007/s00586-008-0755-1 (2008).
Wimsey, S., Pickard, R. & Shaw, G. Accurate scaling of digital radiographs of the pelvis. A prospective trial of two methods. The Journal of bone and joint surgery. British volume 88, 1508–1512, https://doi.org/10.1302/0301-620X.88B11.18017 (2006).
Acknowledgements
The authors would like to thank Dr. med. Odette Pieroh and Quentin Léguillette for technical assistance and the Institute of Anatomy of the University of Leipzig for help with the cadavers. The authors acknowledge support from the German Research Foundation (DFG) and Leipzig University within the program of Open Access Publishing. The authors would like to thank Materialise providing the license for the X-ray module.
Author information
Authors and Affiliations
Contributions
Conceived and designed the experiments: P.P., M.L., C.J. and J.B. Data acquisition: P.P., M.L., R.G., A.H. Analysed the data: P.P., M.L., R.G., T.H., D.W., A.H., C.J., J.B. Wrote the paper: P.P., T.H., D.W., C.J., A.H., J.B. Approved the final version of the manuscript: P.P., M.L., T.H., D.W., A.H., C.J., J.B.
Corresponding author
Ethics declarations
Competing Interests
The license for the X-ray module was provided by Materialise, Leuven, Belgium as part of the X-ray challenge. The German Research Foundation (DFG) and Leipzig University supported this work within the program of Open Access Publishing. Materialise, DFG and Leipzig University had no role in the design of the study, in the collection, analyses, or interpretation of data, in the writing of the manuscript, and in the decision to publish the results. The authors declare no further conflict of interest.
Additional information
Publisher’s note: Springer Nature remains neutral with regard to jurisdictional claims in published maps and institutional affiliations.
Supplementary information
Rights and permissions
Open Access This article is licensed under a Creative Commons Attribution 4.0 International License, which permits use, sharing, adaptation, distribution and reproduction in any medium or format, as long as you give appropriate credit to the original author(s) and the source, provide a link to the Creative Commons license, and indicate if changes were made. The images or other third party material in this article are included in the article’s Creative Commons license, unless indicated otherwise in a credit line to the material. If material is not included in the article’s Creative Commons license and your intended use is not permitted by statutory regulation or exceeds the permitted use, you will need to obtain permission directly from the copyright holder. To view a copy of this license, visit http://creativecommons.org/licenses/by/4.0/.
About this article

Cite this article
Pieroh, P., Lenk, M., Hohmann, T. et al. Intra- and interrater reliabilities and a method comparison of 2D and 3D techniques in cadavers to determine sacroiliac screw loosening. Sci Rep 9, 3141 (2019). https://doi.org/10.1038/s41598-019-40052-4
Received:
Accepted:
Published:
DOI: https://doi.org/10.1038/s41598-019-40052-4
This article is cited by
Comments
By submitting a comment you agree to abide by our Terms and Community Guidelines. If you find something abusive or that does not comply with our terms or guidelines please flag it as inappropriate.
