
Abstract
Triple-negative breast cancer (TNBC) is sometimes mistaken for fibroadenoma due to its tendency to show benign morphology on breast ultrasound (US) albeit its aggressive nature. This study aims to develop a radiomics score based on US texture analysis for differential diagnosis between TNBC and fibroadenoma, and to evaluate its diagnostic performance compared with pathologic results. We retrospectively included 715 pathology-proven fibroadenomas and 186 pathology-proven TNBCs which were examined by three different US machines. We developed the radiomics score by using penalized logistic regression with a least absolute shrinkage and selection operator (LASSO) analysis from 730 extracted features consisting of 14 intensity-based features, 132 textural features and 584 wavelet-based features. The constructed radiomics score showed significant difference between fibroadenoma and TNBC for all three US machines (p < 0.001). Although the radiomics score showed dependency on the type of US machine, we developed more elaborate radiomics score for a subgroup in which US examinations were performed with iU22. This subsequent radiomics score also showed good diagnostic performance, even for BI-RADS category 3 or 4a lesions (AUC 0.782) which were presumed as probably benign or low suspicious of malignancy by radiologists. It was expected to assist radiologist’s diagnosis and reduce the number of invasive biopsies, although US standardization should be overcome before clinical application.
Introduction
Breast cancer consists of heterogeneous subtypes that have distinct morphologic, genetic and clinical characteristics. Triple-negative breast cancer (TNBC) is one subtype that does not express the estrogen receptor (ER) and progesterone receptor (PR) or overexpress the human epidermal growth factor-2 (HER-2). TNBC accounts for 10–27% of whole breast cancers, and presents the highest rate of recurrence and the poorest outcomes1,2,3,4,5.
Breast ultrasonography (US) is an important and reliable modality used to diagnose breast cancer. In general, US signs that have a high positive predictive value (PPV) for malignancy according to the American College of Radiology Breast Imaging Reporting and Data System (BI-RADS) lexicon are irregular shape, spiculated/angular margins, marked hypoechogenicity, posterior acoustic shadowing, and a nonparallel orientation6,7,8. However, TNBC tends to have oval or round shapes and circumscribed margins, reflecting a rapidly proliferating tumor with pushing borders prior to significant stromal reaction. It is also more likely to present with posterior acoustic enhancement since highly cellular circumscribed carcinomas tend to have enhanced through-transmission9,10,11,12,13. This benign-looking appearance of TNBC might decrease the diagnostic performance of US and delay proper treatment.
Computer-aided diagnosis (CAD) systems have been used as second readers for analyzing breast lesions by using computational algorithms to make more conclusive diagnoses14,15,16. In US images, texture patterns have been regarded as useful features for differentiating malignant and benign tumors17,18,19. Several previous studies were capable of differential diagnosis between benign and malignant breast lesions, using texture features based on US images such as contrast from gray-level co-occurrence matrices (GLCM), correlation from Haralick’s texture features or combination of contrast and covariance from GLCM17,18,19. Radiomics is a natural extension of the texture analysis in that radiomics analyses usually extract hundreds of features from a medical image such as US, CT or MRI. It assumes that extracted imaging data are the product of mechanisms occurring at a genetic and molecular level, possibly connected with tumor behavior or patient’s prognosis20,21. It extracts a large number of quantitative features from digital images and unearths the data for hypothesis generation, testing or both. It finds intralesional heterogeneities from imaging data which are indistinguishable to the naked eye2 22. Theoretically, US images possibly contain hidden information that can be hardly perceived by radiologists. We hypothesized it might provide guidance for differential diagnosis between benign-looking TNBC and fibroadenoma. Among hundreds of features, a radiomics score is derived from the selected features which reflect or correlate with pathology more effectively using LASSO (least absolute shrinkage and selection operator) regression analysis method.
We evaluated diagnostic performance of developed radiomics score for differential diagnosis between TNBC and fibroadenoma, compared with proven pathology. We expected that it would reduce the number of false-negative US examinations or the number of invasive biopsies eventually.
Materials and Methods
This retrospective study was approved by the institutional review board (IRB) of Severance Hospital (Seoul, Korea), with a waiver for informed consent.
Patients and Data acqusition
Between January 2010 and December 2015, there were 2213 patients diagnosed with invasive breast cancer after US-guided core biopsy. 343 tumors were finally diagnosed as TNBC based on surgical pathology, which did not express ER and PR or overexpress HER-21. There were 2386 patients diagnosed with fibroadenoma after US-guided core biopsy during the same period. Of them, 979 had tumors definitely confirmed as fibroadenoma; 201 underwent surgical excision, 220 underwent vacuum-assisted excision and 558 had tumors which showed a stable appearance for more than 2 years (Fig. 1).
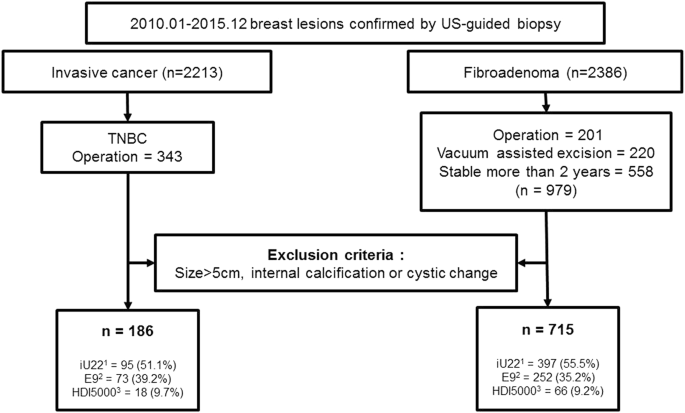
Flowchart for lesion selection. 1IU22, Philips Medical Systems, Bothell, WA. 2LOGIQ E9, GE Healthcare, Milwaukee, WI. 3HDI 5000, Philips Medical Systems, Bothell, WA.
US images were collected using three different ultrasound machines (iU22 and HDI 5000; Philips Medical Systems, Bothell, WA, LOQIG E9; GE Healthcare, Milwaukee, WI)) with linear array transducers. All US images were preprocessed by a routine setting including log-compression, compound imaging and scan conversion regardless of the type of devices. We excluded the images which were scanned by harmonic imaging. The aim of our study was to supply additional information to aid radiologists in distinguishing fibroadenoma and TNBC based on texture analysis. Therefore, we excluded lesions with calcifications or cystic changes that might have an extreme effect on pixel values. We also excluded tumors larger than 5 cm because these tumors were not fully included in a single plane which made it difficult to define a region-of-interest (ROI).
Finally, we included 186 TNBCs and 715 fibroadenomas from 840 patients (mean age, 42 yr; range, 13–90 yr). The mean lesion diameter was 15 mm (range, 3–49 mm) on US. Among 901 breast lesions, 492 (54.6%) lesions were examined by iU22 and 325 (36.1%) lesions were examined by LOGIQ E9. The rest (84, 9.3%) were examined by HDI 5000. Two radiologists assessed each breast mass according to the US BI-RADS lexicon, and categorized lesions as 3, 4, and 5 by consensus with probability of malignancy risk being less than 2%, 2–95%, and more than 95%, respectively. Category 4 was subdivided into 4a, 4b and 4c with probability of malignancy risk being 2–10%, 10–50% and 50–95%, respectively8.
Feature extraction
A radiologist (S.E.L, a third-year resident) who was blinded to the pathologic results selected one axial image among the ultrasound images of each breast mass and drew a ROI along the mass margin using the Microsoft Paint program.
For the multi-feature-based radiomics study, we extracted a large number of radiomics features including intensity-based features, textural features and wavelet-based features, many of which currently have no known clinical significance. We followed the feature set which was suggested by the previous review article22. Intensity-based features describe the distribution of pixel intensities within an US image such as energy, entropy and kurtosis. Texture features were extracted using the gray-level co-occurrence matrices(GLCM) and gray-level run-length matrices (GLRLM) in 0°, 45°, 90°, and 135° which are tabulations of how often different combinations of pixel brightness values (gray levels) occur in an image for each direction respectively23. Wavelet transformation decouples textural information by decomposing the original image in low and high frequencies. In this study, using two-dimensional coiflet wavelets, the original US image was decomposed into four decompositions (LH, HH, HL, LL). Finally we attained 730 features consisting of 14 intensity-based features, 132 textural features, 584 wavelet-based features quantifying tumor imaging features by using in-house algorithms implemented by Matlab software (version R2017b, MathWorks).
Interobserver agreement for defining the region-of-interest (ROI)
ROIs were manually drawn and not found with the segmentation process. To exclude the possibility of interobserver variability affecting the ROI, another staff radiologist (E.K.K, specializing in breast imaging for 22 years) drew ROIs in 50 randomly selected lesions to analyze interobserver reproducibility. Interobserver agreement was evaluated by the intraclass correlation coefficient (ICC) with the 95% confidence interval (CI) based on a two-way random effect model between the 730 feature parameters of the 50 randomly selected lesions.
Logistic LASSO Regression
Patients were divided into the training and validation set using random sampling and there were no significant differences in the average values of age, lesion size, distribution of BI-RADS category and pathology ratio. Because the number of patients has to be superior to the number of covariates by at least 10 times for multivariate analysis24, radiomics features were generated by using the penalized logistic regression with a least absolute shrinkage and selection operator (LASSO) in the training set. The pathology of the breast masses was entered as a dependent variable, Y, in the logistic regression model and the 730 radiomics features were entered as covariates. A tuning parameter (lambda) was selected to maximize the AUC based on 10-fold cross-validation in the training set. A radiomics score was computed by a linear combination of the selected features weighted by each coefficient. Using the formula for the radiomics score defined in the training set, we obtained and compared radiomics scores according to the type of US machine and lesion pathology. Because imaging features based on texture analysis might depend on the type of US machine used, we repeated the LASSO analysis in patients who underwent US examinations with iU22 which was the most commonly used machine. Since breast lesions of BI-RADS category 4b, 4c or 5 are morphologically distinct enough for malignancy to be suspected with the naked eye, we additionally evaluated the performance of the radiomics score in lesions previously diagnosed as BI-RADS category 3 and 4a. Radiomics scores were converted to the predicted probabilities of malignancy (%) for convenient reference. The conversion equation was as follows.
Statistical analyses were performed using R software, version 3.3.2 (http://www.R-project.org). All tests were two-sided, and p values of less than 0.05 were considered to indicate statistical significance.
The datasets generated and/or analysed during the current study are available from the corresponding author on reasonable request.
Results
Clinical characteristics
There were no significant differences between the training and validation set for lesion size, final pathology ratio, or US BI-RADS category (p = 0.183–0.964; Table 1). We used Student’s t-test and Chi-square test for comparsion.
Interobserver agreement
The interobserver reproducibility of texture feature extraction between the two radiologists for 50 randomly selected lesions was high (ICC, 0.691–1.000; Table 2). Therefore, all outcomes were based on the measurements of the first radiologist.
Construction and validation of the radiomics score
Twenty-three radiomics features were selected to maximize AUC values among a total of 730 features in the training set using the LASSO analysis (Supplementary Table S1). Among the 23 features, the feature which suggested TNBC most strongly was HH_sre_45_90 (high/high, short run emphasis, 90 degree) and the feature which favored fibroadenoma most strongly was LH_imc1_35_90 (low/high, informational measure of correlation 1, 90 degree). The defined radiomics score showed significant difference between fibroadenoma and TNBC for all three US machines (p < 0.001, Table 3). This difference was also confirmed in the validation set. However, we found the total median values of the radiomics score varied according to the type of US machine, even though the pathologic ratio did not significantly differ according to the US machine used. Therefore, to exclude any effect on texture analysis originating from innate differences due to the type of US machine used, and not from pathologic differences, we decided to repeat the same process to define a radiomics score in a homogeneous subgroup who had undergone US examinations with iU22 only.
Subgroup analysis
Twenty-six radiomics features were newly selected by the LASSO analysis in the iU22 subgroup (Supplementary Table S2). Among the 26 features, the feature which suggested TNBC most strongly was LH_srlgle_52_90 (low/high, short run low gray level emphasis, 90 degree) and the feature which favored fibroadenoma most strongly was same as before, LH_imc1_35_90 (low/high, informational measure of correlation 1, 90 degree). The new radiomics score presented a high diagnostic performance for differentiating fibroadenoma and TNBC; AUC (95% CI) 0.910 (0.874, 0.946) in the training set and 0.853 (0.752, 0.954) in the validation set (Fig. 2). Among 415 lesions diagnosed as BI-RADS category 3 or 4a (377 fibroadenomas and 38 TNBCs), in which radiomics scores are expected to aid differential diagnosis, radiomics scores significantly differed according to pathology (p < 0.05 in the total, training and validation sets). However, AUC was slightly decreased for these lesions; 0.838 (0.768, 0.907) in the training set and 0.782 (0.599, 0.966) in the validation set (Table 4, Fig. 3).

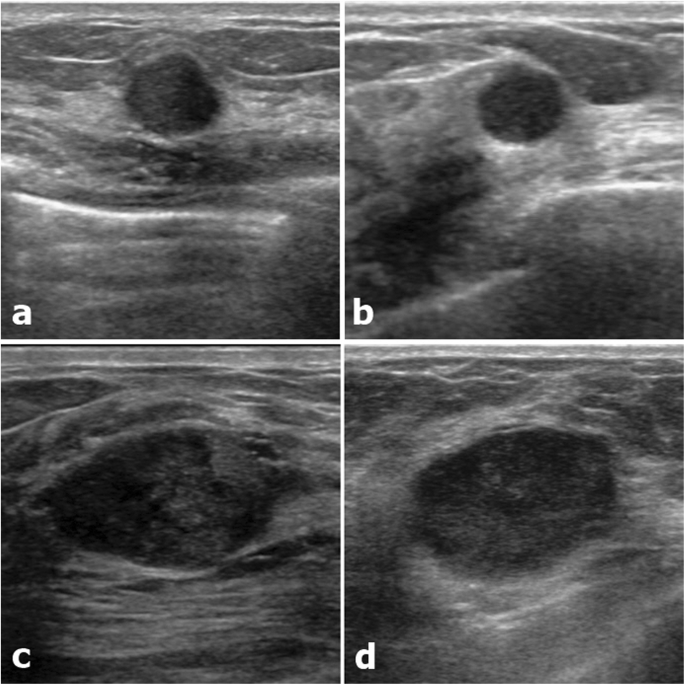
Two representative examples with defined ROI. (a) An 18mm-sized oval, microlobulated, hypoechoic lesion (BI-RADS category 4a) which was confirmed as fibroadenoma presented a low radiomics score (−3.83, predicted malignancy 0.4%). (b) A 20mm-sized irregular, spiculated, hypoechoic lesion (BI-RADS category 5) which was confirmed as TNBC presented a high radiomics score (3.01, predicted malignancy 99.6%).
Two couples of similar lesions with differences in the radiomics score. (a) A 10mm-sized round, microlobulated, hypoechoic lesion (BI-RADS 4a) confirmed as fibroadenoma showed a radiomics score of −2.19 (predicted malignancy 5%). (b) A 9mm-sized round, microlobulated, hypoechoic lesion (BI-RADS 4a) confirmed as TNBC showed a radiomics score of −1.36 (predicted malignancy 17%). (c) A 26mm-sized oval, angular, hypoechoic lesion (BI-RADS 4a) confirmed as fibroadenoma showed a radiomics score of −1.11 (predicted malignancy 24%). (d) A 25mm-sized oval, microlobulated, hypoechoic lesion (BI-RADS 4a) confirmed as TNBC showed a radiomics score of 0.22 (predicted malignancy 74%).
Discussion
TNBC, an aggressive subtype of breast cancer, requires fast and accurate diagnosis. However, in some cases, diagnosis might be delayed due to rather benign morphology on grayscale US9,10,11,12,13. We tried to investigate whether a radiomics score based on texture analysis can help differential diagnosis in these types of cases where malignancy is indiscernible with the naked eye. Moon et al.25 proved that conventional texture features combined with invariant texture features by ranklet transformation presented a very high diagnostic accuracy in discriminating TNBCs from fibroadenomas (AUC 0.970); however, their study was performed with a relatively small sample size using a single US platform. We tried to reproduce this result in a large number of lesions by using a more simple method that excluded the complicated process of segmentation and ranklet transformation, while also taking into consideration the BI-RADS categories.
When we applied a radiomics score defined in a total of 901 lesions with three different US machines, the radiomics score showed significant difference between benign and malignant lesions for each US machine (p < 0.001). Most of the selected radiomics features were wavelet-based features which were presumed to redisplay tumor characteristics hidden behind the speckle and show discriminative ability26. However, median values differed depending on the type of US machine used, even though there was no considerable difference in the pathologic ratio. This was considered to be originated from innate differences among the US platforms such as brightness or contrast, although we set the dynamic range to be equal. Most previous studies about texture analysis obtained images with a single US machine18,25,27,28,29, and a previous study additionally showed that different sonographic platforms might affect the consistency of diagnostic performance in smaller groups, especially in wavelet transformation30. This issue is associated with standardization of data acqusition, which is crucial point in radiomics research regarding the potential lack of reproducibility31. It is relatively more attainable in CT or MRI by setting the scan parameters or pulse sequences identically. That is why radiomics studies for breast cancer were also done by mostly using MRI21. However, US is much more easily accessible and effective tool for breast tumor screening and diagnosis, and a few previous studies dealt with more robust US features regardless of US platforms or gray-scale variations30,32,33. Our study had significance in that it reflected clinical situation using different kinds of US platforms and the result that even this platform-dependent radiomics score presented high diagnostic performance might imply generalizable potency of the radiomics score.
To reduce the effect of the US machine itself on texture analysis, we separately developed a radiomics score in a single major subgroup which was made up of patients examined with one machine, using the same LASSO analysis. This new radiomics score also differentiated between fibroadenoma and TNBC with high diagnostic accuracy (AUC 0.910 in the training set, 0.838 in the validation set; Table 4). However in the clinical field, lesions diagnosed as BI-RADS category 4b, 4c or 5 are morphologically distinct enough for malignancy to be suspected even without the radiomics score. When we obtained the AUC in BI-RADS category 3 and 4a lesions, it was slightly lower than the previous AUC of the total lesions (0.853 in the training set, 0.782 in the validation set; Table 4). In a previous study on category 3 lesions, the AUC was 0.58 by conventional texture analysis and upgraded to 0.83 by ranklet transformation33. The latter result was similar to our result. In some cases in which fibroadenoma and TNBC were hardly distinguishable to the naked eye, the radiomics score presented substantial differences in the predicted probability of malignancy (Fig. 3). Subsequent research seems to be required to assess the incremental value of radiomics scores in the clinical field, especially for BI-RADS category 3 and 4a lesions.
There were several limitations to this study. First, retrospective radiomics research based on US texture features cannot completely overcome the operator dependency of the initial examination. Further studies are required to standardize US measurements for more widely accessible and reproducible radiomics score. Second, we manually defined the ROIs for each lesion, which possibly yielded interobserver variablity although the two radiologists in our study showed good interobserver agreement. Recently, differential diagnosis of breast lesions based on deep learning showed higher diagnosic accuracy than conventional CAD, with potential errors due to defining ROIs or different US platforms being avoided34,35. Finally, additional reader studies in independent validation set is required to compare diagnostic performance between radimoics score and radiologists and evaluate how these results can be applied in actual clinical diagnosis.
In conclusion, a radiomics score based on US texure analysis presented a high diagnostic performance in the differential diagnosis of fibroadenoma and TNBC, even in BI-RADS category 3 and 4a lesions. It was expected to assist radiologist’s diagnosis and reduce the number of invasive biopsies, although US standardization should be overcome before clinical application.
References
Dent, R. et al. Triple-negative breast cancer: clinical features and patterns of recurrence. Clinical cancer research 13, 4429–4434 (2007).
Rodríguez-Pinilla, S. M. et al. Prognostic significance of basal-like phenotype and fascin expression in node-negative invasive breast carcinomas. Clinical cancer research 12, 1533–1539 (2006).
Mersin, H., Yildirim, E., Berberoglu, U. & Gülben, K. The prognostic importance of triple negative breast carcinoma. The Breast 17, 341–346 (2008).
Irshad, A. et al. Assessing the role of ultrasound in predicting the biological behavior of breast cancer. American Journal of Roentgenology 200, 284–290 (2013).
Cho, N. Molecular subtypes and imaging phenotypes of breast cancer. Ultrasonography 35, 281–288, https://doi.org/10.14366/usg.16030 (2016).
Costantini, M. et al. Solid breast mass characterisation: use of the sonographic BI-RADS classification. Radiol Med 112, 877–894, https://doi.org/10.1007/s11547-007-0189-6 (2007).
Hong, A. S., Rosen, E. L., Soo, M. S. & Baker, J. A. BI-RADS for sonography: positive and negative predictive values of sonographic features. AJR Am J Roentgenol 184, 1260–1265, https://doi.org/10.2214/ajr.184.4.01841260 (2005).
D’Orsi, C. J. ACR BI-RADS atlas: breast imaging reporting and data system (American College of Radiology, 2013).
Wojcinski, S. et al. Sonographic features of triple-negative and non-triple-negative breast cancer. J Ultrasound Med 31, 1531–1541 (2012).
Ko, E. S. et al. Triple-negative breast cancer: correlation between imaging and pathological findings. Eur Radiol 20, 1111–1117, https://doi.org/10.1007/s00330-009-1656-3 (2010).
Kim, M. Y. & Choi, N. Mammographic and ultrasonographic features of triple-negative breast cancer: a comparison with other breast cancer subtypes. Acta Radiol 54, 889–894, https://doi.org/10.1177/0284185113488580 (2013).
Yang, Q., Liu, H. Y., Liu, D. & Song, Y. Q. Ultrasonographic features of triple-negative breast cancer: a comparison with other breast cancer subtypes. Asian Pac J Cancer Prev 16, 3229–3232 (2015).
Yoon, G. Y. et al. Are there any sonographic features that can be used to differentiate between small triple-negative breast cancer and fibroadenoma? Ultrasonography 0, 0–0, https://doi.org/10.14366/usg.17036 (2017).
Drukker, K., Giger, M. L., Vyborny, C. J. & Mendelson, E. B. Computerized detection and classification of cancer on breast ultrasound. Acad Radiol 11, 526–535, https://doi.org/10.1016/s1076-6332(03)00723-2 (2004).
Chang, R. F. et al. Computer-aided diagnosis for surgical office-based breast ultrasound. Arch Surg 135, 696–699 (2000).
Singh, S., Maxwell, J., Baker, J. A., Nicholas, J. L. & Lo, J. Y. Computer-aided classification of breast masses: performance and interobserver variability of expert radiologists versus residents. Radiology 258, 73–80, https://doi.org/10.1148/radiol.10081308 (2011).
Sivaramakrishna, R., Powell, K. A., Lieber, M. L., Chilcote, W. A. & Shekhar, R. Texture analysis of lesions in breast ultrasound images. Computerized medical imaging and graphics 26, 303–307 (2002).
Alvarenga, A. V., Pereira, W. C., Infantosi, A. F. & Azevedo, C. M. Complexity curve and grey level co-occurrence matrix in the texture evaluation of breast tumor on ultrasound images. Med Phys 34, 379–387, https://doi.org/10.1118/1.2401039 (2007).
Kuo, W. J., Chang, R. F., Lee, C. C., Moon, W. K. & Chen, D. R. Retrieval technique for the diagnosis of solid breast tumors on sonogram. Ultrasound Med Biol 28, 903–909 (2002).
Limkin, E. J. et al. Promises and challenges for the implementation of computational medical imaging (radiomics) in oncology. Ann Oncol 28, 1191–1206, https://doi.org/10.1093/annonc/mdx034 (2017).
Valdora, F., Houssami, N., Rossi, F., Calabrese, M. & Tagliafico, A. S. Rapid review: radiomics and breast cancer. Breast Cancer Res Treat 169, 217–229, https://doi.org/10.1007/s10549-018-4675-4 (2018).
Aerts, H. J. et al. Decoding tumour phenotype by noninvasive imaging using a quantitative radiomics approach. Nat Commun 5, 4006, https://doi.org/10.1038/ncomms5006 (2014).
Gomez, W., Pereira, W. C. & Infantosi, A. F. Analysis of co-occurrence texture statistics as a function of gray-level quantization for classifying breast ultrasound. IEEE Trans Med Imaging 31, 1889–1899, https://doi.org/10.1109/tmi.2012.2206398 (2012).
Harrell, F. E. Jr. Regression modeling strategies: with applications to linear models, logistic and ordinal regression, and survival analysis (Springer, 2015).
Moon, W. K. et al. Computer-aided diagnosis for distinguishing between triple-negative breast cancer and fibroadenomas based on ultrasound texture features. Med Phys 42, 3024–3035, https://doi.org/10.1118/1.4921123 (2015).
Guo, Y. et al. Radiomics Analysis on Ultrasound for Prediction of Biologic Behavior in Breast Invasive Ductal Carcinoma. Clin Breast Cancer 18, e335–e344, https://doi.org/10.1016/j.clbc.2017.08.002 (2018).
Chang, R.-F., Wu, W.-J., Moon, W. K. & Chen, D.-R. Automatic ultrasound segmentation and morphology based diagnosis of solid breast tumors. Breast Cancer Research and Treatment 89, 179, https://doi.org/10.1007/s10549-004-2043-z (2005).
Ardakani, A. A., Gharbali, A. & Mohammadi, A. Classification of breast tumors using sonographic texture analysis. J Ultrasound Med 34, 225–231, https://doi.org/10.7863/ultra.34.2.225 (2015).
Chen, D. R., Huang, Y. L. & Lin, S. H. Computer-aided diagnosis with textural features for breast lesions in sonograms. Comput Med Imaging Graph 35, 220–226, https://doi.org/10.1016/j.compmedimag.2010.11.003 (2011).
Min-Chun, Y. et al. Robust Texture Analysis Using Multi-Resolution Gray-Scale Invariant Features for Breast Sonographic Tumor Diagnosis. IEEE Trans Med Imaging 32, 2262–2273, https://doi.org/10.1109/tmi.2013.2279938 (2013).
Lambin, P. et al. Radiomics: the bridge between medical imaging and personalized medicine. Nat Rev Clin Oncol 14, 749–762, https://doi.org/10.1038/nrclinonc.2017.141 (2017).
Cai, L. et al. Robust phase-based texture descriptor for classification of breast ultrasound images. Biomed Eng Online 14, 26, https://doi.org/10.1186/s12938-015-0022-8 (2015).
Lo, C. M. et al. Intensity-Invariant Texture Analysis for Classification of BI-RADS Category 3 Breast Masses. Ultrasound Med Biol 41, 2039–2048, https://doi.org/10.1016/j.ultrasmedbio.2015.03.003 (2015).
Cheng, J. Z. et al. Computer-Aided Diagnosis with Deep Learning Architecture: Applications to Breast Lesions in US Images and Pulmonary Nodules in CT Scans. Sci Rep 6, 24454, https://doi.org/10.1038/srep24454 (2016).
Antropova, N., Huynh, B. Q. & Giger, M. L. A deep feature fusion methodology for breast cancer diagnosis demonstrated on three imaging modality datasets. Med Phys 44, 5162–5171, https://doi.org/10.1002/mp.12453 (2017).
Author information
Authors and Affiliations
Contributions
Eun-Kyung Kim contributed to the study design. Eun-Kyung Kim and Si Eun Lee wrote the main manuscript and prepared figures. Jin Young Kwak, Eunjung Lee did the feature extraction and Kyunghwa Han did statistical work including developing radiomics score. All authors reviewed the manuscript.
Corresponding author
Ethics declarations
Competing Interests
The authors declare no competing interests.
Additional information
Publisher's note: Springer Nature remains neutral with regard to jurisdictional claims in published maps and institutional affiliations.
Electronic supplementary material
Rights and permissions
Open Access This article is licensed under a Creative Commons Attribution 4.0 International License, which permits use, sharing, adaptation, distribution and reproduction in any medium or format, as long as you give appropriate credit to the original author(s) and the source, provide a link to the Creative Commons license, and indicate if changes were made. The images or other third party material in this article are included in the article’s Creative Commons license, unless indicated otherwise in a credit line to the material. If material is not included in the article’s Creative Commons license and your intended use is not permitted by statutory regulation or exceeds the permitted use, you will need to obtain permission directly from the copyright holder. To view a copy of this license, visit http://creativecommons.org/licenses/by/4.0/.
About this article

Cite this article
Lee, S.E., Han, K., Kwak, J.Y. et al. Radiomics of US texture features in differential diagnosis between triple-negative breast cancer and fibroadenoma. Sci Rep 8, 13546 (2018). https://doi.org/10.1038/s41598-018-31906-4
Received:
Accepted:
Published:
DOI: https://doi.org/10.1038/s41598-018-31906-4
This article is cited by
-
A comprehensive review on computational techniques for breast cancer: past, present, and future
Multimedia Tools and Applications (2024)
-
Radiogenomic analysis of prediction HER2 status in breast cancer by linking ultrasound radiomic feature module with biological functions
Journal of Translational Medicine (2023)
-
Differential Diagnosis of DCIS and Fibroadenoma Based on Ultrasound Images: a Difference-Based Self-Supervised Approach
Interdisciplinary Sciences: Computational Life Sciences (2023)
-
Combined diagnosis of multiparametric MRI-based deep learning models facilitates differentiating triple-negative breast cancer from fibroadenoma magnetic resonance BI-RADS 4 lesions
Journal of Cancer Research and Clinical Oncology (2023)
-
Utilizing grayscale ultrasound-based radiomics nomogram for preoperative identification of triple negative breast cancer
La radiologia medica (2023)
Comments
By submitting a comment you agree to abide by our Terms and Community Guidelines. If you find something abusive or that does not comply with our terms or guidelines please flag it as inappropriate.
