
Abstract
Physiological function, disease expression and drug effects vary by time-of-day. Clock disruption in mice results in cardio-metabolic, immunological and neurological dysfunction; circadian misalignment using forced desynchrony increases cardiovascular risk factors in humans. Here we integrated data from remote sensors, physiological and multi-omics analyses to assess the feasibility of detecting time dependent signals - the chronobiome – despite the “noise” attributable to the behavioral differences of free-living human volunteers. The majority (62%) of sensor readouts showed time-specific variability including the expected variation in blood pressure, heart rate, and cortisol. While variance in the multi-omics is dominated by inter-individual differences, temporal patterns are evident in the metabolome (5.4% in plasma, 5.6% in saliva) and in several genera of the oral microbiome. This demonstrates, despite a small sample size and limited sampling, the feasibility of characterizing at scale the human chronobiome “in the wild”. Such reference data at scale are a prerequisite to detect and mechanistically interpret discordant data derived from patients with temporal patterns of disease expression, to develop time-specific therapeutic strategies and to refine existing treatments.
Introduction
The molecular circadian clock coordinates our body rhythms entrainable by environmental cues, such as light, to the 24 hour solar cycle. The master clock, located in the suprachiasmatic nucleus communicates with and is influenced by molecular clocks in peripheral tissues1. The system is highly conserved and tightly regulated by feedback and feed forward transcriptional loops, the elements of which exhibit a high degree of genetic redundancy2. A robust temporal organization is achieved by the functional overlap between many of the molecular circadian clock genes; however, nuanced differences, such as differential responsiveness to photic stimuli3, might impact chronotypes. Studies in model systems have implicated the clock as an integrative network across tissues of particular relevance to metabolism, immune function and vascular homeostasis4.
In humans, many aspects of physiology, including body temperature, blood glucose, catecholamines, insulin and many hormones, including melatonin, cortisol, TSH, ghrelin, leptin and prolactin undergo diurnal variation5, meaning that daily patterns can be discerned. These rhythms lose amplitude and synchrony with age in both humans and mice, and deletion of core clock genes in mice has been associated with accelerated aging6,7. However, more recent studies have suggested that disruption “off target” effects of these transcription factors may account for some of these phenomena8,9,10. In humans, the incidence or severity of many diseases, such as asthma, myocardial infarction, stroke and depression exhibit diurnal variation4. Similarly, the targets of many drugs oscillate, as do enzymes and transporters relevant to drug metabolism11. Despite this and the long recognized time dependent variation in disposition of many commonly used drugs, there has been little exploitation of chronotherapy in clinical practice12.
Indeed, our understanding of the role of the molecular clock in humans is limited13. The use of forced desynchrony protocols has permitted segregation of clock driven circadian rhythms from diurnal variability secondary to environmental exposures. Endogenous and environmentally driven rhythms often coincide, but may be out of phase, as is the case with blood pressure, where the morning surge associated with increased cardiovascular morbidity does not temporally align with the endogenous peak in blood pressure, revealed by forced desynchrony, that occurs in the evening14. The clinical implications of such divergence are unknown.
Although useful, such studies are performed in highly artificial circumstances in which light and other environmental cues are carefully controlled. In recent years the development of technologies for multiscale “omics” and remote sensors afford new opportunities to explore characterization of the chronobiome of humans free ranging “in the wild”, that is, not sequestered in artificial environments.
Studies in model systems have demonstrated the role of the clock in regulation of the genome15, the epigenome16, the metabolome17, the proteome18 and the microbiome19,20,21 as well as in the oscillation of temperature22, activity23 and blood pressure24. However, before we can explore how dysfunction in these outputs might relate to expression of human disease, we must establish the ability to discriminate an oscillatory signal from analytical and environmental noise in healthy volunteers and determine the influence on this physiological chronobiome of such variables as gender and age. In this regard, the detectable diurnal variation in body temperature, hormones and blood pressure might serve as “internal standards” for more novel technologies.
Here, we report a pilot study designed to gather preliminary information on the variability in healthy volunteers of the diurnal oscillation of cardiovascular and behavioral phenotypes and of diverse “omics” outputs. Despite the expected intra- and inter-individual variability in behavior, a clear pattern of time dependent oscillation of blood pressure, activity, light exposure, communications and food consumption was detected. Morning- versus evening-dependent differences in both the oral and rectal microbiome abundances were clearly evident, while detection of time-of-day variation in the metabolome, proteome and transcriptome was apparent, but constrained by the number of sampling times and by sample size. We achieved a first level of data integration suggesting multidimensional fingerprints unique to each person.
Methods
We enrolled 6 healthy male volunteers (32.3 ± 3.6 years of age, BMI 25.2 ± 3.4 kg/m2) after approval by the Institutional Review Board of the University of Pennsylvania (Federalwide Assurance FWA00004028; IRB Registration: IORG0000029) that included an institutional security and privacy information impact assessment and registration (clinicaltrials.gov NCT02249793). Informed consent was obtained from all subjects. This clinical research study was carried out in accordance with relevant guidelines and regulations. The main exclusion criteria consisted of travel across time zones and irregular work hours, e.g. shift work. Volunteers were studied over 4 months to collect data on activity, sleep patterns, light exposure and communication, as well as being deeply phenotyped during two 48 hour periods, 2 weeks apart. Biospecimens (plasma, serum, saliva, oral and rectal swabs) were collected from these outpatients in the Center for Human Phenomic Science (CHPS, University of Pennsylvania) at 12 hourly intervals, thus generating a time series of 5 consecutive sample collections during one single 48 hour session, i.e. 0 hrs = morning, 12 hrs = evening, 24 hrs = morning, 36 hrs = evening, and 48 hrs = morning. Plasma and saliva metabolites were analyzed using LC-MS as previously described25, a pre-specified protein panel was run on the SomaLogic platform26, the microbiomic analysis in saliva and from buccal and rectal swabs was conducted as established earlier27,28, and in-house qPCR was used for expression analysis of a small, selected panel of genes.
A triaxial actigraph device (wActiSleep-BT) recorded accelerometer and light sensor data with subsequent wear time analysis and sleep scoring in ActiLife 6.0 software. This achieved quantitative outputs for steps, energy expenditure and metabolic rate as additional outputs in this domain. The HIPAA-compliant Ginger.io platform®, consisting of an android mobile phone application and a web dashboard, was used to monitor cell phone calls and SMS messaging activity in real time. The application gathered communication and mobility data through a background process and transmitted encrypted data to firewall protected linux-based servers with access control lists. Blood pressure monitoring was performed in the ambulatory subjects using clinically validated devices (Spacelab 90207). Intake of food and beverages was collected with the SmartIntake© smartphone application, a validated remote food photography method® 29,30. To facilitate data quality and completeness, the app included Ecological Momentary Assessment (EMA) methodology to remind participants to capture images of the foods and beverages that they consumed. These reminders were text messages that were scheduled for delivery at the personalized meal times of the participants. The responses to EMAs were tracked in near real-time, which allowed us to identify quickly if data collection problems occurred. The app sends participants food/beverage images and accompanying food identifier data (e.g., barcodes, PLU numbers, food descriptions) to a server located at the Pennington Biomedical Research Center where bionutritionists analyze the images to estimate food/beverage intake based on the Food Photography Application© program. This allows the operator to identify a match for each food from the Food and Nutrient Database for Dietary Studies 5.0 and other sources, such as manufacturer’s information and Nutrition Fact Panels, to calculate energy and nutrient intake.
For the bioinformatics analysis, we adopted several packages in R and CircOS for data management, integration and visualization. The web-based version control repository GitHub was used as code development platform (https://github.com/itmat/chronobiome/). In addition to standard descriptive statistics, we applied permutation tests, principal component analysis, principal coordinate analysis, circadian multiresolution analyses, cosinor method, Ingenuity pathway analysis, variance correlation analysis, and a time-versus-subject contribution to variance analysis.
Results
We successfully integrated and analyzed this multidimensional dataset, roughly 2.2 million data points collected from 6 healthy volunteers over the course of 4 months, including two 48-hour sessions of additional deep phenotyping (Fig. 1, Figure S1). This led to several insights relevant to the pursuit of future studies in the field of human chronobiology.

Study Design. (A) Study participants were equipped with remote sensing devices to collect behavioral and environmental data including activity, communication, mobility, sleep-wake times, dietary intake and light exposure. Clinical assessments included ambulatory blood pressure and heart rate. (B) The observation time for the biosensor-derived data was a total of four months with two 48-hour sessions (Session 1 & 2) scheduled two weeks apart to extend the biosensor platform by ambulatory blood pressure monitoring (ABPM) and timestamped dietary intake (SmartIntake) as well as by collection of timed biospecimens for multiomics analysis at 12-hour intervals.
First, we sought to assess the validity of our dataset. We see this accomplished on several levels:
-
i.
A clear diurnal signal, as expected in these healthy young urban professional males, was detectable in blood pressure, dipping at night on average by 19.4 ± 3.2 mmHg in mean arterial pressure. This was accompanied by a nocturnal drop in heart rate by an average of 16.5 ± 6.6 bpm (Fig. 2).
Figure 2 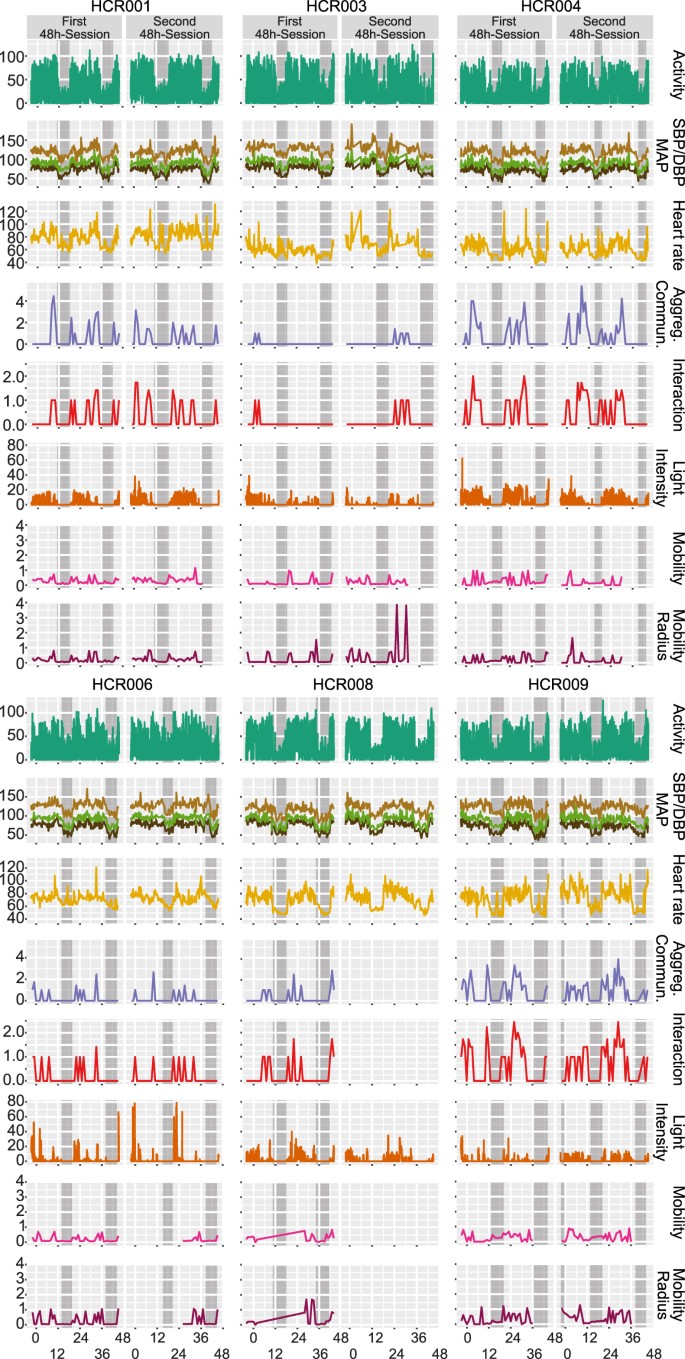
Remote Sensing, Blood Pressure & Heart Rate. Horizontal panels display the following data for each of the n = 6 participants: activity [square root of vector magnitude], systolic, mean arterial, and diastolic blood pressure [mmHg SBP and DBP], heart rate [bpm], aggregate communication [square root of the sum of counts of phone calls and text messages], interaction [square root of counts ∙ min−1], light intensity [square root of lux ∙ min−1], and mobility/mobility radius [square root of miles] sampled over 48 hours during the first and second sessions. Self-reported sleep times are marked as grey boxes.
-
ii.
Locomotor activity was highest during self-reported wake times, on average 1904 counts ∙ min−1 using the raw data outputs of the Actigraph’s accelerometer as reference. This compared to just 307 counts ∙ min−1 during self-reported sleep times (Fig. 2, Figure S2).
-
iii.
Remote sensors indicated that aggregate communication happened during self-reported wake times (18.7 calls and sms/wake hours) with close to none at night (0.9 calls and sms/sleep hours). The GPS informed readout of mobility confirmed the urban setting of our study. Participants traveled on average 1.6 miles/wake hours with absent mobility during self-reported sleep (0.2 miles/sleep hours) (Fig. 2, Figure S2).
-
iv.
Ambient light intensities followed the patterns of self-reported wake/sleep times where the wrist-worn luxmeter detected light on average 42.3 lux ∙ min−1 during wake hours compared to 2.7 lux ∙ min−1 during sleep hours (Fig. 2, Figure S2).
-
v.
Food intake did not occur during self-reported sleep times (Fig. 3, Figure S3).
Figure 3 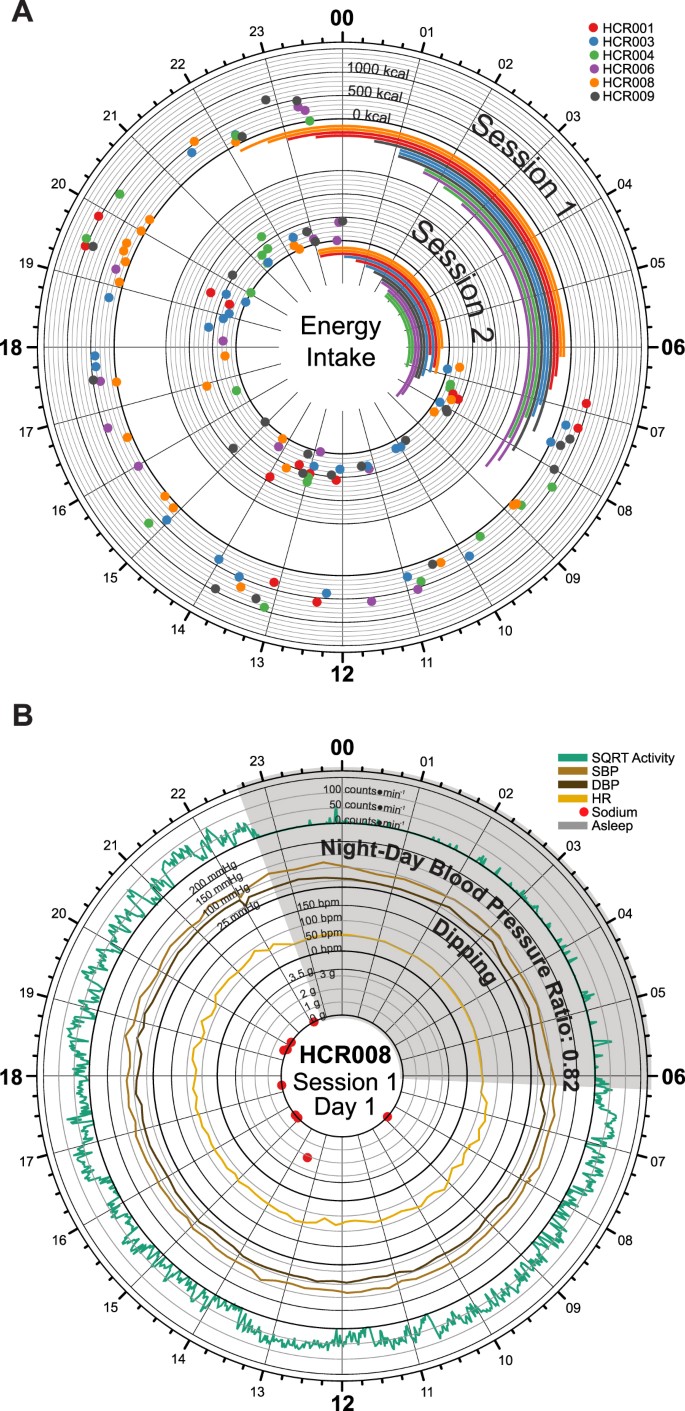
Dietary Intake by Remote Food Photography. (A) Time-of-day dependent energy intake for all subjects during session 1 (outer circle) and session 2 (inner circle). The data in each session track display energy intake for two full days of each session. 24-hour clock times are listed around the edge of the plot, with “00” corresponding to midnight, and “12” corresponding to noon. Dots are color-coded by subject and indicate the energy intake (kcal) at the corresponding clock time. Dark axis lines mark 0, 500, 1000, and 1500 kcal consumed. Lighter axis lines mark energy intake in 100 kcal steps. Sleep spans are also color-coded by subject and are indicated using the bars below each of the corresponding session. (B) Time-of-day dependent fluctuations in activity (counts * min−1, green), systolic (mmHg, brown) and diastolic (mmHg, black) blood pressure, heart rate (bpm, orange) plotted with time-specific dietary intake of sodium (g, red); sleep time marked as grey wedge. As expected, a dipping phenotype in blood pressure was observed for this subject.
-
vi.
Plasma cortisol showed the expected time-of-day-dependent variance with relative levels of 1.3 ± 0.4 higher in the morning than 0.8 ± 0.2 in the evening. Though noisier, cortisol levels in saliva followed this pattern (Fig. 4).
Figure 4 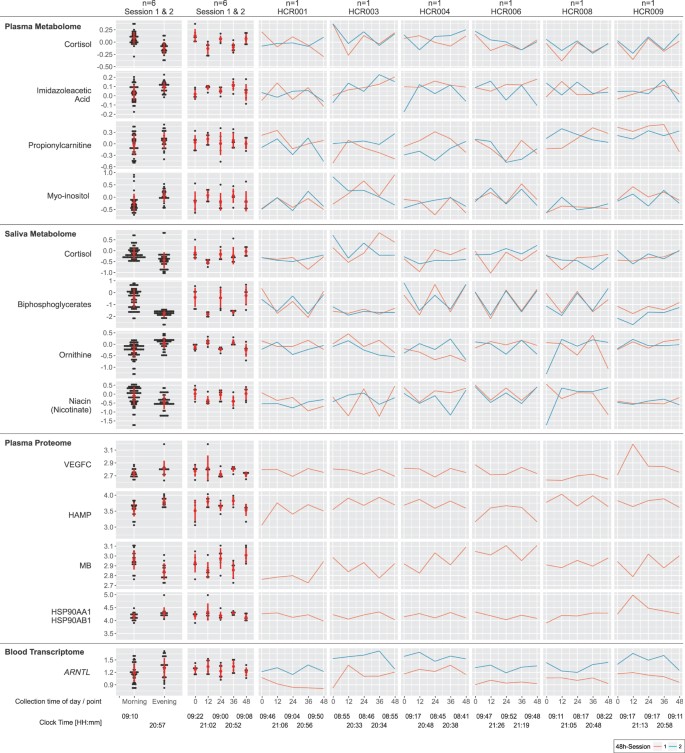
Metabolomics, Proteomics & Transcriptomics. Time-of-day dependent differences in metabolite/protein/gene levels are displayed selecting the top-ranked candidates per non-parametric statistical test: (i) aggregated by morning/evening for all n = 6 subjects (left column), (ii) aggregated by time point (0 h - morning, 12 h - evening, 24 h - morning, 36 h - evening, 48 h - morning) for all n = 6 subjects (second left column), and (iii) individual time series from session 1 (red) and session 2 (blue) for each subject (6 columns to the right). The red circles and bars in the two left-most columns indicate the mean and standard deviations for each aggregated dataset, respectively. Please note that data were visualized on a log10 scale.


In summary, we were able to detect internally consistent, time dependent patterns in blood pressure, heart rate, cortisol, activity, communication, mobility and light consistent with the physiological and behavioral expectations for this cohort in the natural setting under the conditions of this experiment.
Next, we were interested to assess the comparative contributions of time (the signal) and inter-subject behavioral differences (the noise) to variability in our datasets. There are many sources of variability in these data. By partitioning the total variability, we were able to attribute how much variability was explained by time, the variable of interest in our study (see Supplemental Methods for full details). For the multiomics dataset, the permutation distribution (obtained by permuting the time points in all possible ways) revealed patterns which displayed statistically significant temporal variation between morning (0 h, 24 h, 48 h) and evening (12 h, 36 h) measurements (permutation p-values: plasma metabolome p = 0.009; saliva metabolome p = 0.009, saliva microbiome p = 0.009). We determined that 5.4% (9/166) of the plasma metabolites, 5.6% (14/250) of the saliva metabolites, 0.5% (6/1141) of the serum proteins, and 3 of the 12 most abundant genera in the oral microbiota underwent time-specific variability (Figs 4, 5 and 6a). For the metabolites, examples include cortisol in plasma, and ornithine, xanthine and porphobilinogen in saliva. The plasma proteome overall failed to attain significance (p = 0.56). Accordingly, variance in protein abundances was driven by inter-subject differences in the majority of cases (99.2%), whereas for some proteins variance was exclusively contributed by inter-subject differences. For the oral microbiota, three genera, Streptococcus, Veillonella, and Actinomyces revealed a predominant time-dependent variance (Figs 5 and 6a). Thus, time-of-day-dependent patterning was detected in the metabolome and the microbiome despite the paucity of sampling times and the behavioral diversity of a small number of free ranging humans. This integrative approach allows us to discern candidate oscillatory variables despite the anticipated inter-individual differences, small sample size and sparse sampling. As expected for cortisol (Fig. 6a), time (33.6%) contributes more variance than inter-subject differences (21.8%), thus demonstrating first proof-of-concept.

Microbiomics, Salivatory, Buccal & Rectal. Time-of-day dependent differences in the relative fraction of bacterial genera are displayed: (i) aggregated by morning/evening for all n = 6 subjects (left column), (ii) aggregated by time point (0 h - morning, 12 h - evening, 24 h - morning, 36 h - evening, 48 h - morning) for all n = 6 subjects (second left column), and (iii) individual time series from session 1 (red) and session 2 (blue) for each subject (6 columns to the right). The red circles and bars in the two left-most columns indicate the mean and standard deviations for each aggregated dataset, respectively. Please note that data were visualized on a log10 scale.

Time-versus-Subject Contribution to Variance Analysis. (a) Percent contribution to variance by subject versus time-of-day is displayed for the multiomic, e.g. for cortisol, as expected, the time variance contribution is higher than by subject. Note that time-of-day refers to the three morning and two evening replicates within one 48 hour session. We defined a 5% cutoff (dotted line) to discern variables with a higher time-of-day from subject contribution to variance. (b) Readouts collected from remote sensors and wearable devices segregate according to the percent degree of how much variance is contributed by subject versus time, e.g. for blood pressure (SBP, DBP) the variance contribution by time is higher than by subject, thus underscoring the diurnality of this phenotype. (SBP/DBP: systolic/diastolic blood pressure; MAP: mean arterial pressure; HR: heart rate; PP: pulse pressure). (Insert) This blow up magnifies for dietary food the percent contribution to variance by subject versus time-of-day. Time-specific data was collected by the phone application SmartIntake© during the 48 hrs sessions. (Axis 1–3 refer to the Actigraph’s accelerometers).
In our dataset obtained from remote sensors and wearables, we identified 62% of the variables to show time-specific variability. Here, variables from almost all domains, behavior (activity, mobility), cardiovascular (SDB, DBP, MAP), and environment (light), are represented (Fig. 6a). This includes several food categories - intake of energy, protein, carbohydrates, fat and sodium - where time more than inter-subject differences contributes to variability of intake, despite the unrestricted access to food under the conditions of this study (Fig. 6b bottom insert). By contrast, all readouts for communication depart from this pattern with variance reflecting inter-subject behavior more than time of day. Heart rate has equal time- and inter-subject variance, while, despite the dominant contribution of time to SBP and DBP, variance in pulse pressure mainly reflects inter-subject differences (Fig. 6b).
To parse the relative contributions of time and inter-subject differences to variability in the datasets, we conducted a principal component analysis (Figure S4). As expected, inter-subject differences explain most of the variability observed in the data clustering. Further attribution of variability was not feasible due to our ‘unsupervised’ approach. In an effort to explore which disease categories might be subject to time dependent oscillations, we performed a time-specific pathway analysis of the metabolome and the proteome. Interestingly, the statistically significant categories centered on cancer and inflammation (Figure S5), two conditions subject to clock dependent regulation in mice.
To seek redundancy amongst the parameters tracked by the remote sensors and wearables, we constructed variance correlation matrices where the goodness-of-fit p-values produced from the linear regression analysis informed statistical significance (Fig. 7). This approach visualizes the proportion of variance observed for each variable explained by the variance observed for each other variable. For example, the outputs from the Actigraph’s accelerometers, that is axes 1, 2, and 3 to measure acceleration in three directions, correlate highly with each other as expected (e.g. R2 = 0.96, Bonferroni corrected p = 1.8 * 10−277 between axis 1 and 2). Clusters of high correlation are evident both within-domain (e.g. between SBP and DBP [R2 = 72.5, Bonferroni corrected p = 3.2 * 10−112] or between heart rate and SBP [R2 = 23, Bonferroni corrected p = 2 * 10−21]) and between-domains, as evident between readouts of activity and cardiovascular function. Interestingly, considerable between-subject differences in the variance correlation matrices were noticeable. For example, the relationship between SBP and the oscillatory signal from activity ranged from R2 of 0.22 to 0.67 amongst the 6 volunteers.

Variance Correlation Matrix. The heatmap displays the degree of variance explained across outputs collected from n = 6 healthy volunteers during the two 48-hour sessions. The percentage of variance explained (R2) is depicted by the color scale ranging from white, i.e. regression provides a poor fit for the indicated pair of variables, to dark blue, where the regression produces a good fit between the two variables.
Discussion
Forced desynchrony protocols have provided valuable information on the role of the molecular clock in humans, permitting segregation of rhythmic activities driven by endogenous and environmental factors14,31,32,33,34. For example, disruption of endogenous rhythms results in disturbance of cardiovascular homeostasis, including a rise in blood pressure14. An open question is whether it is also possible to interrogate the contribution of discordant clock driven rhythmicity to time dependent expression of disease phenotypes in unrestricted settings, where the “noise” consequent to divergent behavior, therapies and concordant disease might obscure the detection of oscillatory signals of potential mechanistic relevance. A first step towards addressing this question is to perform a pilot study to determine whether oscillatory signals can even be detected in apparently healthy humans, selected for demographic homogeneity, but allowed to free range without environmental restriction. In the present study, we provide the first evidence that many such signals are detectable despite variance, even in a small number of individuals sampled infrequently, illustrating the feasibility of characterizing the chronobiome – the collective of rhythmic phenomena – of humans living “in the wild”.
Here we report the integration of multidimensional data collected via remote sensing, cardiovascular assessments and “omics” analyses. As anticipated, we see a diversity of behavioral patterns in this apparently homogenous population, purposefully standardized for age, gender and health status to increase the likelihood of detecting time dependent variations. Despite this, the small sample size and protocol violations, we see that several clock-determined diurnal readouts, i.e. blood pressure and cortisol, were internally consistent with time-dependent patterns in the volunteers’ physical activity, mobility, communication and environmental cues (ambient light exposure). While the majority of remote sensor readouts showed time-specific variability (62%), we find that inter-subject differences mainly drove variability in communication. This latter observation overlaps with findings from e-mail communications in large university-based cohorts sampled in Europe and the US35. This study described two broad e-mail phenotypes, one restricting use to work hours, the other persistently active during wake hours. As residents in Western societies move increasingly outside the environmental light-dark cycle, our approach might afford new avenues to investigate the health implications of this cultural change. For example, one might parse for synchrony versus asynchrony between outcome variables using circadian phase.
In our cohort, as expected, we observed high correlations between circadian phases of activity, communication, mobility and light, thus suggesting high synchronicity. Notably, time-specific phase shifts can be induced by food intake, for example, carbohydrates in the morning (compared to evening) phase-advance heart rate by three-quarters of an hour36.
Circadian amplitude offers yet another perspective on circadian organization. Healthy volunteers under conditions of forced desychrony variably respond with a reduction in amplitude across clock-determined oscillatory endpoints37; however, the relationship to adverse health effects is less clear. In our cohort, as we would expect, circadian amplitudes of different outputs correlated highly. For example, that between activity and mobility (R2 of 16.4%, Bonferroni corrected-p = 4.2 * 10−14), was similar to the correlation between activity and communication (R2 of 16.4%, Bonferroni corrected-p = 3.1 * 10−14). If and how these relationships change under acute and chronic exposure to stress remains to be seen.
Temporal patterns are discernable in the “omics” data, most pronounced in the metabolome (5.4% in plasma and 5.6% in saliva), and evident in several genera of the oral microbiome. In the case of the plasma proteome and whole blood transcriptome, more frequent analyses in larger cohorts will be necessary comprehensively to discern signal from noise. Our exploratory pathway analysis revealed that metabolomic as well as proteomic pathways associated with cancer and inflammation were enriched in a temporal fashion. Prominent interplay with circadian clocks has been described in mice for both diseases4,38.
These data provide a reference set for the design of larger studies comprehensively to interrogate the chronobiome. For example, we wish to determine how age and gender, two factors that interact with clock-derived outputs in model systems21,39, and seasonal variation40 modulate the human chronobiome. More detailed phenotyping will include additional analytical platforms, for example the breath metabolome41, and characterization of the response to time dependent metabolic42, inflammatory43 and cardiovascular44 perturbations of the chronobiome. Such deep phenotypic characterization will provide a comparator for investigation of chronobiomic divergence of potential mechanistic and therapeutic value in syndromes of time dependent disease expression, such as non-dipping hypertension, nocturnal asthma and depression.
References
Curtis, A. M. & Fitzgerald, G. A. Central and peripheral clocks in cardiovascular and metabolic function. Ann Med 38, 552–559 (2006).
Chang, D. C. & Reppert, S. M. The circadian clocks of mice and men. Neuron 29, 555–558 (2001).
King, D. P. & Takahashi, J. S. Molecular genetics of circadian rhythms in mammals. Annu Rev Neurosci 23, 713–742, https://doi.org/10.1146/annurev.neuro.23.1.713 (2000).
Yang, G. et al. Knitting up the raveled sleave of care. Sci Transl Med 5, 212rv213, https://doi.org/10.1126/scitranslmed.3007225 (2013).
Morris, C. J., Aeschbach, D. & Scheer, F. A. Circadian system, sleep and endocrinology. Mol Cell Endocrinol 349, 91–104, https://doi.org/10.1016/j.mce.2011.09.003 (2012).
Kondratov, R. V., Kondratova, A. A., Gorbacheva, V. Y., Vykhovanets, O. V. & Antoch, M. P. Early aging and age-related pathologies in mice deficient in BMAL1, the core componentof the circadian clock. Genes Dev 20, 1868–1873, https://doi.org/10.1101/gad.1432206 (2006).
Wijsman, C. A. et al. Ambulant 24-h glucose rhythms mark calendar and biological age in apparently healthy individuals. Aging Cell 12, 207–213, https://doi.org/10.1111/acel.12042 (2013).
Yang, G. et al. Timing of expression of the core clock gene Bmal1 influences its effects on aging and survival. Sci Transl Med 8, 324ra316, https://doi.org/10.1126/scitranslmed.aad3305 (2016).
Solanas, G. et al. Aged Stem Cells Reprogram Their Daily Rhythmic Functions to Adapt to Stress. Cell 170, 678–692 e620, https://doi.org/10.1016/j.cell.2017.07.035 (2017).
Sato, S. et al. Circadian Reprogramming in the Liver Identifies Metabolic Pathways of Aging. Cell 170, 664–677 e611, https://doi.org/10.1016/j.cell.2017.07.042 (2017).
Zhang, R., Lahens, N. F., Ballance, H. I., Hughes, M. E. & Hogenesch, J. B. A circadian gene expression atlas in mammals: Implications for biology and medicine. PNAS. https://doi.org/10.1073/pnas.1408886111 (2014).
Paschos, G. K., Baggs, J. E., Hogenesch, J. B. & FitzGerald, G. A. The role of clock genes in pharmacology. Annu Rev Pharmacol Toxicol 50, 187–214, https://doi.org/10.1146/annurev.pharmtox.010909.105621 (2010).
FitzGerald, G. A., Yang, G., Paschos, G. K., Liang, X. & Skarke, C. Molecular clocks and the human condition: approaching their characterization in human physiology and disease. Diabetes Obes Metab 17(Suppl 1), 139–142, https://doi.org/10.1111/dom.12526 (2015).
Shea, S. A., Hilton, M. F., Hu, K. & Scheer, F. A. Existence of an endogenous circadian blood pressure rhythm in humans that peaks in the evening. Circ Res 108, 980–984, https://doi.org/10.1161/CIRCRESAHA.110.233668 (2011).
Lowrey, P. L. & Takahashi, J. S. Mammalian circadian biology: elucidating genome-wide levels of temporal organization. Annu Rev Genomics Hum Genet 5, 407–441, https://doi.org/10.1146/annurev.genom.5.061903.175925 (2004).
Feng, D. & Lazar, M. A. Clocks, metabolism, and the epigenome. Mol Cell 47, 158–167, https://doi.org/10.1016/j.molcel.2012.06.026 (2012).
Castro, C., Briggs, W., Paschos, G. K., FitzGerald, G. A. & Griffin, J. L. A metabolomic study of adipose tissue in mice with a disruption of the circadian system. Mol Biosyst 11, 1897–1906, https://doi.org/10.1039/c5mb00032g (2015).
Mauvoisin, D. et al. Circadian clock-dependent and -independent rhythmic proteomes implement distinct diurnal functions in mouse liver. PNAS 111, 167–172, https://doi.org/10.1073/pnas.1314066111 (2014).
Liang, X., Bushman, F. D. & FitzGerald, G. A. Time in motion: the molecular clock meets the microbiome. Cell 159, 469–470, https://doi.org/10.1016/j.cell.2014.10.020 (2014).
Thaiss, C. A. et al. Transkingdom control of microbiota diurnal oscillations promotes metabolic homeostasis. Cell 159, 514–529, https://doi.org/10.1016/j.cell.2014.09.048 (2014).
Liang, X., Bushman, F. D. & FitzGerald, G. A. Rhythmicity of the intestinal microbiota is regulated by gender and the host circadian clock. Proc Natl Acad Sci USA 112, 10479–10484, https://doi.org/10.1073/pnas.1501305112 (2015).
Mohawk, J. A., Green, C. B. & Takahashi, J. S. Central and peripheral circadian clocks in mammals. Annu Rev Neurosci 35, 445–462, https://doi.org/10.1146/annurev-neuro-060909-153128 (2012).
DeBruyne, J. P., Weaver, D. R. & Reppert, S. M. CLOCK and NPAS2 have overlapping roles in the suprachiasmatic circadian clock. Nat Neurosci 10, 543–545, https://doi.org/10.1038/nn1884 (2007).
Curtis, A. M. et al. Circadian variation of blood pressure and the vascular response to asynchronous stress. Proc Natl Acad Sci USA 104, 3450–3455, doi:0611680104 (2007).
Yuan, M., Breitkopf, S. B., Yang, X. & Asara, J. M. A positive/negative ion-switching, targeted mass spectrometry-based metabolomics platform for bodily fluids, cells, and fresh and fixed tissue. Nat Protoc 7, 872–881 (2012).
Gold, L. et al. Aptamer-based multiplexed proteomic technology for biomarker discovery. PLoS One 5, e15004 (2010).
McKenna, P. et al. The Macaque Gut Microbiome in Health, Lentiviral Infection, and Chronic Enterocolitis. PLoS Pathogens 4, e20 (2008).
Wu, G. D. et al. Sampling and pyrosequencing methods for characterizing bacterial communities in the human gut using 16S sequence tags. BMC Microbiology 10, 206 (2010).
Martin, C. K. et al. Validity of the Remote Food Photography Method (RFPM) for estimating energy and nutrient intake in near real-time. Obesity (Silver Spring) 20, 891–899, https://doi.org/10.1038/oby.2011.344 (2012).
Martin, C. K. et al. A novel method to remotely measure food intake of free-living individuals in real time: the remote food photography method. Br J Nutr 101, 446–456, https://doi.org/10.1017/S0007114508027438 (2009).
Scheer, F. A. et al. Impact of the human circadian system, exercise, and their interaction on cardiovascular function. Proc Natl Acad Sci USA 107, 20541–20546, https://doi.org/10.1073/pnas.1006749107 (2010).
Scheer, F. A., Hilton, M. F., Mantzoros, C. S. & Shea, S. A. Adverse metabolic and cardiovascular consequences of circadian misalignment. PNAS 106, 4453–4458, https://doi.org/10.1073/pnas.0808180106 (2009).
Morris, C. J., Purvis, T. E., Hu, K. & Scheer, F. A. Circadian misalignment increases cardiovascular disease risk factors in humans. Proc Natl Acad Sci USA 113, E1402–1411, https://doi.org/10.1073/pnas.1516953113 (2016).
Kasukawa, T. et al. Human blood metabolite timetable indicates internal body time. Proc Natl Acad Sci USA 109, 15036–15041, https://doi.org/10.1073/pnas.1207768109 (2012).
Malmgren, R. D., Hofman, J. M., Amaral, L. A. N. & Watts, D. J. Characterizing Individual Communication Patterns. arXiv:0905.0106 [physics.soc-ph] (2009).
Krauchi, K., Cajochen, C., Werth, E. & Wirz-Justice, A. Alteration of internal circadian phase relationships after morning versus evening carbohydrate-rich meals in humans. J Biol Rhythms 17, 364–376, https://doi.org/10.1177/074873040201700409 (2002).
Dijk, D. J. et al. Amplitude reduction and phase shifts of melatonin, cortisol and other circadian rhythms after a gradual advance of sleep and light exposure in humans. PLoS One 7, e30037, https://doi.org/10.1371/journal.pone.0030037 (2012).
Sahar, S. & Sassone-Corsi, P. Metabolism and cancer: the circadian clock connection. Nat Rev Cancer 9, 886–896 (2009).
Musiek, E. S. et al. Circadian clock proteins regulate neuronal redox homeostasis and neurodegeneration. J Clin Invest 123, 5389–5400, https://doi.org/10.1172/JCI70317 (2013).
Coomans, C. P., Ramkisoensing, A. & Meijer, J. H. The suprachiasmatic nuclei as a seasonal clock. Front Neuroendocrinol 37, 29–42, https://doi.org/10.1016/j.yfrne.2014.11.002 (2015).
Martinez-Lozano Sinues, P. et al. Circadian variation of the human metabolome captured by real-time breath analysis. PLoS One 9, e114422, https://doi.org/10.1371/journal.pone.0114422 (2014).
Manoogian, E. N. & Panda, S. Circadian clock, nutrient quality, and eating pattern tune diurnal rhythms in the mitochondrial proteome. Proc Natl Acad Sci USA. https://doi.org/10.1073/pnas.1601786113 (2016).
Curtis, A. M. et al. Circadian control of innate immunity in macrophages by miR-155 targeting Bmal1. Proc Natl Acad Sci USA 112, 7231–7236, https://doi.org/10.1073/pnas.1501327112 (2015).
Hossmann, V., Fitzgerald, G. A. & Dollery, C. T. Circadian rhythm of baroreflex reactivity and adrenergic vascular response. Cardiovasc Res 14, 125–129 (1980).
Acknowledgements
We are indebted to our volunteers who consented to participate in this pilot study as well as to the staff of the Center for Human Phenomic Science (CHPS) including LaVenia Banas, RCN, for excellent clinical support, to Sarah Teegarden, PhD, and Alice Laughlin for excellent technical support, and to Lisa Basel-Brown as bionutritionist. We thank Julia Bernstein, Leanne Kaye, PhD, RD, and Karan Singh, MBA, at Ginger.io, San Francisco, CA for providing access to the Ginger.io mobile and dashboard application. We thank the SmartIntake investigators and staff at the Pennington Biomedical Research Center, Baton Rouge, LA, in particular Corby K. Martin, PhD, FTOS, Rebecca Schulin, and Mandy Cowley. Parts of this study were presented at i) the Chronobiology Symposium “Translation of Circadian Biology: Implications for the Clinic”, Penn Chronobiology Program and ITMAT, University of Pennsylvania Perelman School of Medicine Nov 11, 2015; ii) the Society for Research on Biological Rhythms (SRBR) meeting, Palm Harbor, FL, May 21–25, 2016; and iii) the Gordon Research Conference on Chronobiology, Stow, Vermont, July 16–21, 2017. This publication was made possible by the Clinical Research Program Award, Grant 12CRP11920045, Great Rivers Affiliate, American Heart Association (C.S.); Feodor-Lynen Research Award, Alexander von Humboldt-Foundation, Bonn, Germany (C.S.); CEET Pilot Project funding (C.S.) from parent grant NIH/NIEHS 1P30 ES013508-05; NIH Grant LM009012 (J.H.M.); and NIH/NCRR Grant UL1RR024134 which is now NCATS Grant UL1TR000003 (G.A.F.). Dr. FitzGerald is the McNeil Professor in Translational Medicine and Therapeutics; Dr. Skarke is the McNeil Fellow in Translational Medicine and Therapeutics.
Author information
Authors and Affiliations
Contributions
Carsten Skarke, (ITMAT), Literature search, study design, regulatory science, study conduct, data collection, data analysis, data integration, data interpretation, writing, visualizations, figures & tables. Seth Rhoades, (ITMAT), Metabolomics analysis, data interpretation Nicholas Lahens, (ITMAT), Visualizations, statistical analysis, data interpretation. Amy Campbell, (ITMAT), Visualizations, statistical analysis, data interpretation. Kyle Bittinger, (Department of Microbiology), Microbiome, statistical analysis, data interpretation. Aubrey Bailey, (Department of Microbiology), Microbiome analysis. Christian Hoffmann, (Department of Microbiology), Microbiome analysis. Randal S. Olson, (Institute for Biomedical Informatics), Visualizations & statistical analysis. Lihong Chen, (ITMAT), Transcriptomics, data interpretation. Guangrui Yang, (ITMAT), Transcriptomics, data interpretation. Thomas S. Price, (ITMAT), Visualizations & statistical analysis. Jason H. Moore, (Institute for Biomedical Informatics), Visualizations, statistical analysis, data interpretation. Frederik D. Bushman, (Department of Microbiology), Microbiome, statistical analysis, data interpretation. Casey S. Greene, (ITMAT), Visualizations, statistical analysis, data interpretation. Greg R. Grant, (ITMAT), Visualizations, statistical analysis, data interpretation. Aalim M. Weljie, (ITMAT), Metabolomics analysis, data interpretation. Garret A. FitzGerald, (ITMAT), Literature search, study design, regulatory science, data collection, data analysis, data interpretation, writing, figures & tables.
Corresponding authors
Ethics declarations
Competing Interests
The authors declare that they have no competing interests.
Additional information
Publisher's note: Springer Nature remains neutral with regard to jurisdictional claims in published maps and institutional affiliations.
Electronic supplementary material
Rights and permissions
Open Access This article is licensed under a Creative Commons Attribution 4.0 International License, which permits use, sharing, adaptation, distribution and reproduction in any medium or format, as long as you give appropriate credit to the original author(s) and the source, provide a link to the Creative Commons license, and indicate if changes were made. The images or other third party material in this article are included in the article’s Creative Commons license, unless indicated otherwise in a credit line to the material. If material is not included in the article’s Creative Commons license and your intended use is not permitted by statutory regulation or exceeds the permitted use, you will need to obtain permission directly from the copyright holder. To view a copy of this license, visit http://creativecommons.org/licenses/by/4.0/.
About this article

Cite this article
Skarke, C., Lahens, N., Rhoades, S. et al. A Pilot Characterization of the Human Chronobiome. Sci Rep 7, 17141 (2017). https://doi.org/10.1038/s41598-017-17362-6
Received:
Accepted:
Published:
DOI: https://doi.org/10.1038/s41598-017-17362-6
This article is cited by
-
Prognostic utility of rhythmic components in 24-h ambulatory blood pressure monitoring for the risk stratification of chronic kidney disease patients with cardiovascular co-morbidity
Journal of Human Hypertension (2024)
-
Diurnal rhythms of wrist temperature are associated with future disease risk in the UK Biobank
Nature Communications (2023)
-
Optimization of metabolomic data processing using NOREVA
Nature Protocols (2022)
-
Data-driven modelling approach to circadian temperature rhythm profiles in free-living conditions
Scientific Reports (2021)
-
Pathway-level analysis of genome-wide circadian dynamics in diverse tissues in rat and mouse
Journal of Pharmacokinetics and Pharmacodynamics (2021)
Comments
By submitting a comment you agree to abide by our Terms and Community Guidelines. If you find something abusive or that does not comply with our terms or guidelines please flag it as inappropriate.
