
Abstract
13C-labeled glucose combined with chromatography and mass spectrometry enables us to decipher the percentage of lactate generated from various metabolic pathways. We showed that lactate derived from glycolysis, pentose phosphate pathway, Krebs cycle, and other sources accounted for 82–90%, 6.0–11%, 0.67–1.8% and 1.5–7.9%, respectively, depending on different types of cells. When using glucose isotopomers ([1-13C]-, [3-13C]-, [4-13C]-, and [6-13C]glucose) or isotopologues ([1,2-13C2]- and [1,2,3-13C3]glucose) for tracing, the ratio of lactate derived from glucose carbon 1, 2, 3 over 4, 5, 6 via glycolysis varied significantly, ranging from 1.6 (traced with [1,2-13C2]glucose) to 0.85 (traced with [6-13C]glucose), but the theoretical ratio should be 1. The odd results might be caused by intramolecular 13C, which may significantly affect lactate fragmentation under tandem mass spectrometry condition, leading to erroneous quantification. Indeed, the fragmentation efficiency of [U-13C]lactate, [2,3-13C]lactate, and [3-13C]lactate were 1.4, 1.5 and 1.2 folds higher than lactate, respectively, but [1-13C]lactate was similar to lactate, suggesting that carbon-13 at different positions could differentially influence lactate fragmentation. This observed phenomenon was inconsistent with the data based on theoretical calculation, according to which activation energies for all lactate isotopomers and isotopologues are nearly identical. The inconsistency suggested a need for further investigation. Our study suggests that calibration is required for quantifying metabolite isotopolugues and isotopomers.
Introduction
Cancer cells convert most incoming glucose to lactate, a metabolic hallmark called Warburg effect1, 2. Lactate and proton are important for cancer cells to survive through harsh conditions. We recently demonstrated that lactate and proton together switched cancer cells from Warburg effect to an economical metabolic mode with negligible or no net generation of lactate3 and with 90% ATP from oxidative phosphorylation4. Moreover, lactate and proton together prevented cancer cells from glucose deprivation-induced death5. The findings suggested that targeting intratumoral lactic acidosis might be considered as a therapeutic target. Indeed, our clinical study demonstrated a remarkable effect of bicarbonate on local control of hepatocellular carcinoma6.
Many other investigators have independently reported the significance of intratumoral lactic acidosis in tumor biology. Clinical studies showed that high level of lactate was a strong prognostic indicator of increased metastasis and poor overall survival7,8,9,10,11,12,13. Gillies and Gatenby group demonstrated that systematic and tumor pHe alkalization could inhibit carcinogenesis, tumor invasion and metastasis, and they also provided integrated models that can predict the safety and efficacy of buffer therapy to raise tumor pHe14,15,16 and related theoretical work17, 18. Furthermore, lactic acidosis exhibited multifaceted roles in skewing macrophages19, inhibiting the function of cytotoxic T cells20, altering cancer cell metabolism21, 22, inducing chromosomal instability23, and promoting tumor angiogenesis7, 24.
Hence, lactate generation is an interesting topic in cancer metabolic research. Glucose25 is the main sources of lactate generation in cancer cell metabolism. However, the percentage of lactate generated from glucose through various metabolic pathways (e.g., glucose carbons metabolism through glycolysis, pentose phosphate pathway, and Krebs cycle) is not known. The purpose of this study is to investigate this issue.
Materials and Methods
Cell culture and sample preparation
4T1 and Hela cells are maintained in RPIM-1640 (Life Technologies) supplemented with 10% fetal bovine serum (FBS). 2 × 10⁴ 4T1 (or Hela) cells are seeded into 96-well plate to allow attachment overnight in a humidified CO2 incubator. The culture medium was then replaced with serum free RPMI 1640 with 6 mM [1,2-13C2]glucose ([1-13C]-, [3-13C]-, [4-13C]-, [6-13C]-, [1,2,3-13C3]- or [U-13C]glucose) and incubated for another 12 hours. Cell culture supernatant was collected by centrifugation and stored at −20 °C. 4 × 10⁶ K562 cells were seeded in serum free RPIM 1640 with 6 mM [1,2-13C2]glucose ([1-13C]-, [3-13C]-, [4-13C]-, [6-13C]-, [1,2,3-13C3]- or [U-13C]glucose) into 96-well cell culture plate. After 12 hours incubation in a humidified CO2 incubator, cell culture supernatant was collected by centrifugation and stored at −20 °C.
Thymocytes were prepared from thymus of 4-week old female ICR mice purchased from SLRC laboratory animal (Shang Hai, China). Thymus glands were squeezed by syringe inner plunger and the suspension was filtered through 100 μm cell strainer. Thymocytes were incubated at a density of 2 × 10⁷ cells/ml in serum free RPIM 1640 with 6 mM [1,2-13C2]glucose ([1-13C]-, [3-13C]-, [4-13C]-, [6-13C]-, [1,2,3-13C3]- or [U-13C]glucose) for 12 hours in a humidified CO2 incubator, and supernatant was collected by centrifugation and stored at −20 °C.
Prior to analysis by LC-MS/MS, 10 μl sample was diluted by 190 μl acetonitrile, and cleaned by centrifugation at 10000 g for 30 min at 4 °C, supernatant was collected and stored at −20 °C.
Enzymatic determination of lactate
The concentration of lactate is measured according to previously reported method with modification26. Briefly, 10 μl cell culture supernatant was added into 590 μl assay solution containing 2 mM nicotinamide adenine dinucleotide (NAD), 10 U lactate dehydrogenase (LDH), in reaction buffer (200 mM glycine and 170 mM hydrazine, pH 9.2), mixed well, incubated at 37 °C for 30 min, and read at 340 nm against a water blank with a ultraviolet spectrophotometer reader.
Analysis of Lactate by LC-MS/MS
Lactate isotopomers and isotopologues of the cell culture supernatant were measured by liquid chromatography-tandem mass spectrometry (LC-MS/MS). LC was performed on a Waters ACQUITY UPLC system employing a ACQUITY BEH Amide column, 2.1 × 100 mm, 1.7 μm. Eluent A was 95% acetonitrile and 5% aqueous solution of 20 mM ammonium acetate (pH 9.0), whereas eluent B was 50% acetonitrile and 50% aqueous solution of 20 mM ammonium acetate (pH 9.0). The flow rate was set at 0.6 ml/min, injection volume is 5.0 μl, and the column was kept at 50 oC. The optimized gradient conditions were adopted from Waters ACQUITY UPLC BEH Amide column application notebook with a minor modification as follows: 0-0.4 min hold for 99.9% eluent A, 0.4–0.5 min from 99.9% −60% eluent A, 0.5–2 min from 60% −30% eluent A, 2–2.1 min from 30% −99.9% eluent A, and hold for 10 min. The retention time of lactate and lactate isotopomers and isotopologues was 1.29 min.
The MS detection was performed on a 4000 QTRAP mass spectrometer (AB SCIEX, Foster City, CA, USA) equipped with an ESI ion source (Turbospray) operated in negative ion mode. Instrument control, data acquisition, and processing were performed using the Analyst 1.5.2 software. Firstly, collision-induced dissociation (CID) experiment of lactic acid standard was performed in product ion scan mode and the spectrum was illustrated in Supplementary Fig. S1A. The dissociation mechanism was proposed as illustrated in Supplementary Fig. S1B. Then MS/MS data were acquired in the multiple reaction monitoring (MRM) mode. The transition between precursor ion and the most abundant product ion (m/z 89.0 > 43.0) was monitored for quantitative determination. The ion transition m/z 89.0 > 71.0 was monitored for qualitative analysis to confirm the identity of lactic acid in samples. To determine the percentage of 13C-labeled lactate derived from 13C-labeled glucose through glycolysis and pentose phosphate pathway, the following ion transitions were monitored to determine the distribution of 13C-labeled lactate: m/z 90.0 > 43.0, [1-13C]lactate; m/z 90.0 > 44.0, [2-13C]- and [3-13C]lactate; m/z 91.0 > 44.0, [1,2-13C2]- and [1,3-13C2]lactate; m/z 91.0 > 45.0, [2,3-13C2]lactate; and m/z 92.0 > 45.0, [U-13C]lactate.
To increase sensitivity, the ion source temperature (TEM) was set at 500 °C, and the ion spray voltage (IS) was set at −4.5 kV. Ion source gas 1 (GS1) and ion source gas 2 (GS2) used as the nebulizing and drying gases were set at 50 and 40 psi, respectively. Curtain gas (CUR) was set at 40 psi. The optimized MS conditions used for the analysis of the target analytes were shown in Supplementary Table S1.
Eliminate peak area of natural 13C-labled lactate
Chemical structure of lactate and the numbering of its carbon, hydrogen and oxygen atom are shown in Supplementary Fig. S2, according to isotopic abundances of carbon, hydrogen, oxygen elements (Supplementary Table S2) and proposed fragmentation mechanism of lactate (Supplementary Fig. S1B), the relative percentage of each natural 13C-labled lactate (m/z 90 > 44, 90 > 43, 91 > 45, 91 > 44 and 92 > 45) could be calculated (Supplementary Tables S3–S4). We used formula (1) to exclude the peak area of lactate isotopomers and isotopologues that from nature. Let Χ be the peak area of 13C-labled lactate produced by cells, PL be the measured peak area of 13C-labled lactate which includes 13C-labled lactate existed in nature and that produced by cells, PU be the peak area of unlabeled lactate, R be the corresponding relative percentage of each natural 13C-labled lactate.
Theoretical calculations of the activation energy for fragmentation of lactate isotopomers and isotopologues
All theoretical calculations were performed by using the density functional theory (DFT) method at the B3LYP/6-31 G(d) level of theory in the Gaussian 03 program27. The optimized structures for the precursor ions, intermediates and products were identified as a true minimum in energy by the absence of imaginary frequencies. Transition states, on the other hand, were identified by the presence of one single imaginary vibration frequency with the normal vibrational mode, and further confirmed by the intrinsic reaction coordinates (IRC) analysis. The energies discussed here are the sum of electronic and thermal enthalpies. The DFT optimized structures were shown by Gauss View (version 3.07) software to give higher quality images of these structures.
Statistical analysis
All the statistical analyses were performed using SPSS statistics 19.0 software (IBM, Armonk, NY, USA). T-test was applied to evaluate the differences of peak areas ratio of different 13C-lableing lactate.
Results and Discussion
The rationale for quantification of lactate isotopomers and isotopologues
In this study, we used 7 glucose isotopomers ([1-13C]-, [3-13C]-, [4-13C]-, and [6-13C]glucose) or isotopologues ([1,2-13C2]-, [1,2,3-13C3]- and [U-13C]glucose) to trace lactate. Accordingly, 7 lactate isotopomers or isotopologues ([1-13C]-, [2-13C]-, [3-13C]-, [1,2-13C2]-, [1,3-13C2]-, [2,3-13C2]-, and [U-13C]lactate) would be generated.
The percentage of each lactate isotopomers or isotopologues was quantified by tandem mass spectrometry. Under MRM mode of mass spectrometer with triple quadrupole linear ion trap (QTRAP) analyzer, the precursor ion m/z 89.0 was isolated in the first quadrupole (Q1), subsequently, the ion dissociated under collisional activation using collision gas such as nitrogen in Q2, and the fragment ions were isolated in Q3, finally, the ions were detected by the detector, as described in Supplementary Fig. S3.
As illustrated in Supplementary Fig. S1A, two fragment ions at m/z 71.0 and 43.0 were produced in the dissociation of unlabeled lactate at m/z 89.0. The transition between precursor ion and the most abundant product ion (m/z 89.0 > 43.0) was monitored for quantitative determination. And the ion transition m/z 89.0 > 71.0 was monitored for qualitative analysis to confirm the identity of lactate in samples. For 13C-labeled lactate derived from 13C-labeled glucose through glycolysis and pentose phosphate pathway, the following ion transitions were monitored to determine the distribution of 13C-labeled lactate: m/z 90.0 > 43.0, [1-13C]lactate; m/z 90.0 > 44.0, [2-13C]- and [3-13C]lactate; m/z 91.0 > 44.0, [1,2-13C2]- and [1,3-13C2]lactate; m/z 91.0 > 45.0, [2,3-13C2]lactate; and m/z 92.0 > 45.0, [U-13C]lactate.
Representative chromatograms of lactate standard and major lactate species generated in cells were shown in Supplementary Fig. 4; the sum of their percentages was more than 98% of total lactate. And the retention time of lactate and each 13C-labeled lactate generated in cells is identical to that of lactate standard. The relative standard deviation (RSD) in the peak area is ≤10% (n = 6) for lactate and each 13C-labeled lactate mentioned in Supplementary Fig. 4. It can be clearly seen that lactate and each 13C-labeled lactate generated in cells can be detected with good peak shapes, and the signal to noise ratios is above ten. And lactate isotopomers and isotopologues can be separated from each other based on m/z value.
According to the established principle, 13C, which only adding a neutron into nucleus, should not affect chemical bonding, hence should not affect molecule fragmentation both quality and quantity under tandem mass spectrometry condition, i.e., the fragmentation of lactate with or without 13C should be exactly the same.
A time course to determine the steady-state generation of lactate isotopologues or isotopomers
In order to exclude the interference of exogenous lactate, we used serum free RPMI-1640 to culture cells, as serum contains appreciable amount of lactate, which may interfere with the quantification of lactate isotopologues. Nevertheless, the condition of serum-free medium could be considered as a stress for cancer cells, which might interfere with the cell metabolism. We compared the percentage of lactate isotopologues generated by cells in the presence or absence of serum. The results were summarized in Supplementary Table S6, showing no significant difference between cultures with or without serum. Thus, we used serum free RPMI-1640 to culture cells in this study with the culture time within 12 hours.
We performed a time-course experiment and observed that a steady-state generation of lactate isotopologues was attained 4 hours after incubation and maintained thereafter (Fig. 1; Supplementary Table S5). Based on the time-course experiment, all the experiments performed below were carried out using serum free RPMI-1640, with an incubation time of 12 hours.

A time course of generation of [2,3-13C2]lactate (from glucose carbon 1, 2, 3) and lactate (from glucose carbon 4, 5, 6) (n = 12) from 4T1, Hela, K562 and thymocyte. Cells were incubated in serum free RPMI-1640 containing 6 mM [1,2-13C2]glucose and supernatant was collected for LC-MS analysis as described in Materials and Methods. Data were mean ± SD, n = 12, from 2 independent experiments.
Determination of lactate from glucose and other sources
We used [U-13C]glucose to trace lactate. Glucose-derived lactate constituted about 97% of total lactate (Table 1), other source-derived lactate constituted about 2%, and lactate derived from mixed carbon sources (glucose and other sources) was less than 1%, which was most probably derived from Krebs cycle (Fig. 2). The percentage of lactate isotopologues generated from 4T1, Hela, and K562 cancer cells were comparable with each other. In mouse thymocytes, lactate generated from glucose, mixed carbon sources, and other sources constituted about 90%, 2%, and 8%, respectively.

The metabolic pathways that generate various lactate isotopomers and isotopologues in 4T1 cells, traced by [U-13C] glucose. Besides [U-13C]lactate, there are trace amount of other lactate isotopologues, which could be generated from [U-13C]pyruvate through tricarboxylic cycle to produce [1,2-13C2]malate and [3,4-13C2]malate, which, via catalysis of malic enzyme, generate [1,2-13C2]pyruvate and [3-13C]pyruvate, which can convert to corresponding lactate. [1,2-13C2]pyruvate and [3-13C]pyruvate can enter Krebs cycle, leading to generation of other lactate isotopomers.
Determination of lactate from glycolysis and pentose phosphate pathway
[1,2-13C2]glucose and [3-13C]glucose could be used for tracing lactate from glycolysis and from pentose phosphate pathway then back to glycolysis.
When [1,2-13C2]glucose was used to trace lactate in 4T1 cells, various lactate isotopomers and isotopologues were identified (the upper part of Table 2). Then we calculated the percentage of lactate from glycolysis, through pentose phosphate pathway then back to glycolysis according to the following estimation:
-
1.
In theory, glycolysis would generate 2 species, [2,3-13C2]lactate (m/z 91 > 45) and lactate (m/z 89 > 43), which were derived from glucose carbons 1, 2, 3 and glucose carbon 4, 5, 6, respectively (Fig. 3);
Figure 3 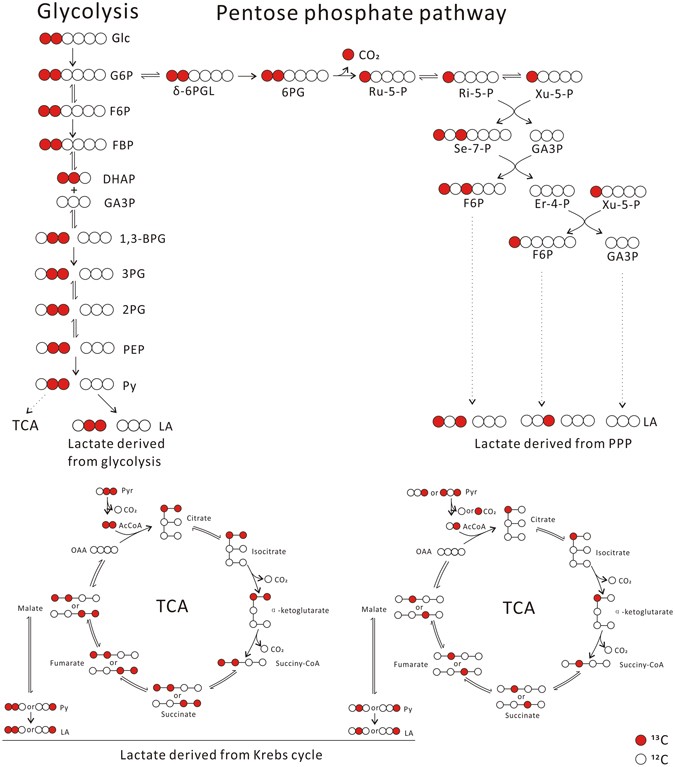
Metabolic pathways that generate various lactate isotopomers and isotopologues in cells, traced with [1,2-13C2]glucose. 4T1 cells were incubated in serum-free RPMI 1640 medium containing 6 mM [1,2-13C2]glucose for 12 hours in a humidified CO2 incubator and culture supernatant was collected for LC-MS analysis as described in Materials and Methods. The figure explain the generation of various lactate isotopologues from [1,2-13C2]glucose.
-
2.
Glucose metabolism through pentose phosphate pathway then back to glycolysis would generated 3 major species (Fig. 3), lactate (m/z 89 > 43), [1,3-13C2]lactate (m/z 91 > 44), and [3-13C]lactate (m/z 90 > 44), the ratio of ([1,3-13C2]lactate + [3-13C]lactate)/lactate should be 2/3 (Fig. 3). Thus, glucose entering into pentose phosphate pathway then back to glycolysis would also generate a fraction of lactate (m/z 89 > 43).
-
3.
According to Table 1, the other sources generated about 2% of lactate (m/z 89 > 43).

Thus, the percentage of lactate from glycolysis, pentose phosphate pathway, and other sources were about 90%, 6.6%, and 2.2%, respectively (the down part of Table 2), accounting for about 99% of total lactate. Using Hela and K562, we obtained nearly identical results (Table 2). For thymocytes, the percentage of lactate from glycolysis, pentose phosphate pathway, and other sources were about 85%, 6.0%, and 7.9%, respectively, accounting for about 99% of total lactate (Table 2).
Then we used [3-13C]glucose to trace lactate generation from glycolysis and pentose phosphate pathway by 4T1 cells and calculated the percentage of lactate (Table 3). The calculation is similar as described above. In theory (Fig. 4), glycolysis would generate 2 species, [1-13C]lactate (m/z 90 > 44) derived from glucose carbons 1, 2, 3, and, lactate (m/z 89 > 43) derived from glucose carbons 4, 5, 6; glucose metabolism through pentose phosphate pathway then back to glycolysis would generate 3 major species (Fig. 4), lactate (m/z 89 > 43), [1,2-13C2]lactate (m/z 91 > 44), and [2-13C]lactate (m/z 90 > 44), the ratio of ([1,2-13C2]lactate + [2-13C]lactate)/lactate should be 2/3. Thus, the percentage of lactate from glycolysis, pentose phosphate pathway, and other sources were about 89%, 9.2%, and 2.2%, respectively (Table 3).

Metabolic pathways that generate various lactate isotopomers and isotopologues in cells, traced with [3-13C]glucose. In theory, when cells incubated with [3-13C]glucose, most glucose is converted to lactate directly through glycolysis, which results in equal amount of [1-13C]lactate that derived from glucose carbon 1, 2, 3 to lactate derived from glucose carbon 4, 5, 6. A fraction of glucose enters oxidative branch pentose phosphate pathway, cycles back to glycolysis through nonoxidative branch of pentose phosphate pathway, subsequently converts to lactate. Three major species, [1,2-13C2]lactate, [2-13C]lactate, and lactate, were generated from nonoxidative pentose phosphate pathway.
Using Hela and K562, we obtained similar results (Table 3). For thymocytes, the percentage of lactate from glycolysis, pentose phosphate pathway, and other sources were about 84%, 8.1%, and 7.9%, respectively (Table 3).
The quantification problem of lactate generated from glycolysis
When [1,2-13C2]glucose was used for tracing, [2,3-13C2]lactate (m/z 91 > 45, derived from glucose carbons 1, 2, 3) and lactate (m/z 89 > 43, derived from glucose carbons 4, 5, 6) from glycolysis constituted 56% ± 0.43% and 34% ± 0.41% of total lactate, respectively, resulting in a ratio of 1.6 (Table 2). This is a surprise, as this ratio should be 1.
When using [3-13C]glucose for tracing, [1-13C]lactate (m/z 90 > 43, derived from glucose carbons 1, 2, 3) and lactate (m/z 89 > 43, derived from glucose carbons 4, 5, 6) from glycolysis were 45% ± 0.30% and 44% ± 0.49% of total lactate, respectively, resulting in a ratio of 1.02, very close to 1 (Table 3).
Using 4T1, Hela, k562, and mouse thymocytes, we obtained nearly identical results (Tables 2–3), indicating that the results were highly reproducible and reliable.
Tracing lactate isotopomers and isotopologues using glucose labeled with carbon-13 at different positions
We then used [1-13C]glucose, [6-13C]glucose, [1,2,3-13C3]glucose, and [4-13C]glucose to trace lactate. The percentages of each lactate isotopologues in 4T1 were given in the upper part of Table 4. Then we estimated the percentage of lactate generated from glycolysis, pentose phosphate pathway, and other sources (the down part of Table 4).
Again, notably, the ratio of lactate derived from glucose carbon 1, 2, and 3 over that from glucose carbon 4, 5, and 6 via glycolysis varied significantly in 4T1 cells, ranging from 1.6 ([1,2,3-13C3]glucose) to 0.85 ([6-13C]glucose) (the down part of Table 4). These results were reproducible using Hela, K562, and mouse thymocytes (Supplementary Tables S7–S10).
13C-labelling of lactate at different positions differentially influences its fragmentation efficiency under tandem mass spectrometry condition
In theory, glucose labeling with 13C should not alter the percentage ratio between lactate derived from glucose carbon 1, 2, 3 and lactate derived from glucose carbon 4, 5, 6, because there is no theoretical and experimental basis that enzymes responsible for glucose metabolism can distinguish 13C from 12C.
According to the methodology of mass spectrometry, isotopomers or isotopologues which differ only at 13C or 12C should not affect the ionization and fragmentation, so that the percentage of each isotopomer or isotopologue of a metabolite could be quantified. In fact, this is the principle used to measure isotopomers or isotopologues of metabolites in metabolomic studies28,29,30,31.
However, after generating so many confusing data as described above, we suspected that carbon-13 may significantly interfere with molecule fragmentation under tandem mass spectrometry condition and interfere the quantification of each lactate isotopomer and isotopologue.
Standards [2,3-13C2]lactate was mixed with lactate, and the [2,3-13C2]lactate/lactate concentration ratios were: 9 (9:1); 4 (8:2); 2.3 (7:3); 1.5 (6:4); 1.0 (5:5); 0.67 (4:6); 0.43 (3:7); 0.25 (2:8) and 0.11 (1:9). The mixtures were analyzed by LC-MS/MS under MRM mode in losing CO, and results shown that [2,3-13C2]lactate/lactate peak area ratio were 13 ± 0.45; 6.0 ± 0.29; 3.6 ± 0.077; 2.2 ± 0.042; 1.5 ± 0.070; 1.0 ± 0.018; 0.63 ± 0.011; 0.37 ± 0.0037 and 0.17 ± 0.0029, respectively (Supplementary Table S11). Overall, [2,3-13C2]lactate/lactate peak area ratio was 1.5 folds higher than [2,3-13C2]lactate/lactate concentration ratio (the right panel of Fig. 5A), indicating that 13C enhanced the fragmentation rate of [2,3-13C2]lactate under MRM mode in losing CO.

13C-labeling of lactate at different positions differentially influences its fragmentation efficiency under tandem mass spectrometry condition. (A) Left panel: standard mixture ([2,3-13C2]lactate: lactate); red line: peak area ratios; blue line: concentration ratios. The mixtures were analyzed by LC-MS/MS under MRM mode in losing CO. [2,3-13C2]lactate/lactate peak area ratio was 1.5 folds higher than [2,3-13C2]lactate/lactate concentration ratio (right panel). Original data refers to Supplementary Table 11. (B) Left panel: standard mixture ([1-13C]lactate: lactate); red line: peak area ratios; blue line: concentration ratios. The mixtures were analyzed by LC-MS/MS under MRM mode in losing CO. [1-13C]lactate/lactate peak area ratio was comparable with [1-13C]lactate/lactate concentration ratio (right panel). Original data refers to Supplementary Table 12. (C) Left panel: standard mixture ([3-13C]lactate: lactate); red line: peak area ratios; blue line: concentration ratios. The mixtures were analyzed by LC-MS/MS under MRM mode in losing CO, [3-13C]lactate/lactate peak area ratio was 1.2 folds higher than [3-13C]lactate/lactate concentration ratio (right panel). Original data refers to Supplementary Table 13. (D) Left panel: standard mixture ([U-13C]lactate: lactate); red line: peak area ratios; blue line: concentration ratios. The mixtures were analyzed by LC-MS/MS under MRM mode in losing CO, [U-13C]lactate/lactate peak area ratio was 1.4 folds higher than [U-13C]lactate/lactate concentration ratio (right panel). Original data refers to Supplementary Table 14. The data represent mean ± SD, n = 6, and are confirmed by 2 independent experiments.
Then we mixed [1-13C]-, [3-13C]-, or [U-13C]lactate with lactate respectively, and their concentration ratios, analysis and calculation methods were similar as described above. While [1-13C]lactate/lactate peak area ratio was comparable with their concentration ratio (the right panel of Fig. 5B), [3-13C]lactate/lactate and [U-13C]lactate/lactate peak area ratio was 1.2 (the right panel of Fig. 5C) and 1.4 (the right panel of Fig. 5D) folds higher than their concentration ratio, respectively, indicating that 13C-labelling of lactate at different positions differentially influences its fragmentation efficiency under tandem mass spectrometry condition.
The lactate and [2,3-13C2]lactate (or [1-13C]-, [3-13C]-, [U-13C]lactate) mixed standard solutions mentioned above were analyzed by LC-MS under Q1 multiple ions mode, in order to investigate whether 13C affects ionization process of 13C-labeled lactate. Data in Supplementary Tables S11–S14 point out that 13C slightly affect ionization of 13C-labeled lactate under MS condition.
In order to investigate 13C effect on lactate fragmentation under different MRM mode, the lactate and [2,3-13C2]lactate (or [1-13C]-, [3-13C]-, [U-13C]lactate) mixed standard solutions mentioned above were analyzed by MRM mode in losing H2O. The results pointed out that 13C enhanced fragmentation of [2,3-13C2]-, [3-13C]-, or [U-13C]lactate as well, but the influence was less than that under MRM mode in losing CO; and the fragmentation of [1-13C]lactate was not affected by 13C under MRM mode in losing H2O (Supplementary Tables S11–S14).
The results raised a theoretical issue: 13C and 12C differs in only one number of neutron, the chemical bond was formed by sharing the outer electrons and the strength of the bond was hardly influenced by the neutron. In tandem mass spectrometry, collision gas such as nitrogen was used and the fragmentation occurs when the collision energy was high enough to break the chemical bond. Under the same collision energy, the intensity of the fragment ion from the 12C- and 13C-labeled lactate was thought to be identical. Even if there is some difference due to the mass variability, it will be very little. However, in the present study, significant difference was observed.
Data calibration
We used the number 1.5 ([2,3-13C2]lactate versus lactate) derived from Fig. 5 to calibrate the data acquired from 4T1 incubated with [1,2-13C2]glucose (Table 2). After calibration, the ratio of lactate derived from glucose carbon 1, 2, 3 over that from glucose carbon 4, 5, 6 was nearly equal (Table 5).
We used the number 1.2 ([3-13C]lactate versus lactate) derived from Fig. 5 to calibrate the data of 4T1 incubated with [1-13C]- or [6-13C]glucose (Table 4), the ratio of lactate derived from glucose carbon 1, 2, 3 over that from glucose carbon 4, 5, 6, was close to 1 (Table 5).
We used the number 1.4 ([U-13C]lactate versus lactate) derived from Fig. 5 to calibrate the data of 4T1 incubated with [1,2,3-13C3]glucose (Table 4). After calibration, the ratio of lactate derived from glucose carbon 1, 2, 3 over that from glucose carbon 4, 5, 6 was comparable with each other (Table 5).
Calibrations were performed on the data of Hela, K562, and thymocytes, the calibrated data indicated that the percentages of lactate derived from glucose carbon 1, 2, 3 and 4, 5, 6 were nearly equal as well (Supplementary Tables S15–S18).
Theoretical calculation of the activation energy of lactate fragmentation
To obtain insights into the mechanism of lactate fragmentation, we carried out theoretical calculations at the B3LYP/6-31 G(d) level of theory to quantitatively describe the energy requirements of these reactions32,33,34 and a schematic potential energy surface is illustrated in Fig. 6. The energy of transition state 2 (TS2) for losing CO is higher than that of transition state 1 (TS1) for losing H2O, suggesting that the loss of CO process is the rate determining step for the formation of ion at m/z 43., the relative energies of lactate isotopomers and isotopologues in the fragmentation reaction routes were shown in Table 6. The energies of TS2 of all these compounds were nearly identical, suggesting that lactate isotopomers and isotopologues should have identical fragmentation behaviors in tandem mass spectrometry. The calculation was inconsistent with the experimental data and this inconsistency is worthy of further investigation.

Potential energy diagram for the fragmentation reactions of lactate, using DFT calculations at the B3LYP/6-31 G(d) level.
Concluding remarks
To the best of our knowledge, there is no report regarding the significant impact of carbon-13 labeling on fragmentation of molecules under tandem MS condition. In this study, we revealed that carbon-13 labeling could significantly interfere with lactate fragmentation. This observation is inconsistent with our theoretical calculation that the activation energy of fragmentation of lactate with or without carbon-13 labeling is nearly identical. Our study also points out that potential problems may exist in the previous studies involving quantification of isotopomers and isotopologues by tandem mass spectrometry technology. In the future, the proper calibrations for quantification of isotopomers and isotopologues would be required.
References
Warburg, O. Warburg On the origin of cancer. Science. 123, 309–314 (1956).
Hanahan, D. & Weinberg, R. A. Hallmarks of cancer: the next generation. Cell. 144, 646–74 (2011).
Xie, J. et al. Beyond Warburg effect–dual metabolic nature of cancer cells. Sci. Rep. 4, 4927 (2014).
Wu, H., Ying, M. F. & Hu, X. Lactic acidosis switches cancer cells from aerobic glycolysis back to dominant oxidative phosphorylation. Oncotarget. 7, 40621–9 (2016).
Wu, H. et al. Central role of lactic acidosis in cancer cell resistance to glucose deprivation-induced cell death. The Journal of pathology. 227, 189–99 (2012).
Chao, M. et al. A nonrandomized cohort and a randomized study of local control of large hepatocarcinoma by targeting intratumoral lactic acidosis. E-life. 5, e15691 (2016).
Gatenby, R. A. & Gillies, R. J. Why do cancers have high aerobic glycolysis? Nat. Rev. Cancer. 4, 891–899 (2004).
Brizel, D. M. et al. Elevated tumor lactate concentrations predict for an increased risk of metastases in head-and-neck cancer. Int. J. Radiat. Oncol., Biol., Phys. 51, 349–353 (2001).
Walenta, S. et al. High lactate levels predict likelihood of metastases, tumor recurrence, and restricted patient survival in human cervical cancers. Cancer Res. 60, 916–921 (2000).
Schwickert, G., Walenta, S., Sundfør, K., Rofstad, E. K. & Mueller-Klieser, W. Correlation of high lactate levels in human cervical cancer with incidence of metastasis. Cancer Res. 55, 4757–4759 (1995).
Walenta, S. et al. Correlation of high lactate levels in head and neck tumors with incidence of metastasis. The American Journal of Pathology. 150, 409–415 (1997).
Yokota, H. et al. Lactate, choline, and creatine levels measured by vitro 1H-MRS as prognostic parameters in patients with non-small-cell lung cancer. Journal of Magnetic Resonance Imaging. 25, 992–999 (2007).
Paschen, W., Djuricic, B., Mies, G., Schmidt-Kastner, R. & Linn, F. Lactate and pH in the brain: association and dissociation in different pathophysiological states. J. Neurochem. 48, 154–159 (1987).
Silva, A. S., Yunes, J. A., Gillies, R. J. & Gatenby, R. A. The potential role of systemic buffers in reducing intratumoral extracellular pH and acid-mediated invasion. Cancer Res. 69, 2677–2684 (2009).
Robey, I. F. et al. Bicarbonate increases tumor pH and inhibits spontaneous metastases. Cancer Res. 69, 2260–2268 (2009).
Ibrahim-Hashim, A. et al. Systemic buffers inhibit carcinogenesis in TRAMP mice. The Journal of Urology. 188, 624–631 (2012).
Martin, N. K. et al. Predicting the safety and efficacy of buffer therapy to raise tumour pHe: an integrative modelling study. Br. J. Cancer. 106, 1280–1287 (2012).
Martin, N. K. et al. A mathematical model of tumour and blood pHe regulation: The HCO3-/CO2 buffering system. Math. Biosci. 230, 1–11 (2011).
Colegio, O. R. et al. Functional polarization of tumour-associated macrophages by tumour-derived lactic acid. Nature. 513, 559–563 (2014).
Haas, R. et al. Lactate Regulates Metabolic and Pro-inflammatory Circuits in Control of T Cell Migration and Effector Functions. PLoS Biol. 13, e1002202 (2015).
Chen, J. L. et al. The genomic analysis of lactic acidosis and acidosis response in human cancers. PLoS Genet. 4, e1000293 (2008).
Sonveaux, P. et al. Targeting lactate-fueled respiration selectively kills hypoxic tumor cells in mice. J. Clin. Invest. 118, 3930–3942 (2008).
Dai, C., Sun, F., Zhu, C. & Hu, X. Tumor environmental factors glucose deprivation and lactic acidosis induce mitotic chromosomal instability–an implication in aneuploid human tumors. PLoS One. 8, e63054 (2013).
Végran, F., Boidot, R., Michiels, C., Sonveaux, P. & Feron, O. Lactate influx through the endothelial cell monocarboxylate transporter MCT1 supports an NF-kB/IL-8 pathway that drives tumor angiogenesis. Cancer Res. 71, 2550–2560 (2011).
DeBerardinis, R. J. & Cheng, T. Q’s next: the diverse functions of glutamine in metabolism, cell biology and cancer. Oncogene 29, 313–24 (2010).
Edward, P. M. & WeiI, M. H. Rapid enzymatic measurement of blood lactate and pyruvate. Clinical Chemistry. 13, 314–325 (1967).
Frisch MJ et al. Gaussian 03; Gaussian, Inc.: Pittsburgh, PA (2003).
Piskounova, E. et al. Oxidative stress inhibits distant metastasis by human melanoma cells. Nature. 527, 186–91 (2015).
Fan, J. et al. Quantitative flux analysis reveals folate-dependent NADPH production. Nature. 510, 298–302 (2014).
van Heerden, J. H. et al. Lost in transition: start-up of glycolysis yields subpopulations of nongrowing cells. Science. 343, 1245114 (2014).
Mohit, J. et al. Metabolite Profiling Identifies a Key Role for Glycine in Rapid Cancer Cell Proliferation. Science. 336, 1040 (2012).
Guo, C., Yue, L., Guo, M., Jiang, K. & Pan, Y. Elimination of benzene from protonated N-benzylindoline: benzyl cation/proton transfer or direct proton transfer? J Am Soc Mass Spectrom. 24(3), 381–7 (2013).
Wang, S. et al. Gas-Phase Fragmentation of Protonated N,2-Diphenyl-N′-(p-Toluenesulfonyl)Ethanimidamides: Tosyl Cation Transfer Versus Proton Transfer. J. Am. Soc. Mass Spectrom. 26, 1428–1431 (2015).
Wang, S., Dong, C., Yu, L., Guo, C. & Jiang, K. Dissociation of protonated N-(3-phenyl-2H-chromen-2-ylidene)-benzenesulfonamide in the gas phase: cyclization via sulfonyl cation transfer. Rapid Commun. Mass Spectrom. 30, 95–100 (2016).
Acknowledgements
This work has been supported in part by the China National 973 project (2013CB911303), China Natural Sciences Foundation projects (81470126) and the Fundamental Research Funds for the Central Universities, National Ministry of Education, China, all to XH.
Author information
Authors and Affiliations
Contributions
X.H. conceived the project, designed the study, wrote the paper; W.Z. performed experiments and data processing and calibration, wrote the paper; C.G. did the LC-MS analysis, theoretical calculation, wrote the paper; K.J. did the theoretical calculation; M.Y. did the data calibration.
Corresponding author
Ethics declarations
Competing Interests
The authors declare that they have no competing interests.
Additional information
Publisher's note: Springer Nature remains neutral with regard to jurisdictional claims in published maps and institutional affiliations.
Electronic supplementary material
Rights and permissions
Open Access This article is licensed under a Creative Commons Attribution 4.0 International License, which permits use, sharing, adaptation, distribution and reproduction in any medium or format, as long as you give appropriate credit to the original author(s) and the source, provide a link to the Creative Commons license, and indicate if changes were made. The images or other third party material in this article are included in the article’s Creative Commons license, unless indicated otherwise in a credit line to the material. If material is not included in the article’s Creative Commons license and your intended use is not permitted by statutory regulation or exceeds the permitted use, you will need to obtain permission directly from the copyright holder. To view a copy of this license, visit http://creativecommons.org/licenses/by/4.0/.
About this article

Cite this article
Zhang, W., Guo, C., Jiang, K. et al. Quantification of lactate from various metabolic pathways and quantification issues of lactate isotopologues and isotopmers. Sci Rep 7, 8489 (2017). https://doi.org/10.1038/s41598-017-08277-3
Received:
Accepted:
Published:
DOI: https://doi.org/10.1038/s41598-017-08277-3
This article is cited by
-
Class IIa HDACs inhibit cell death pathways and protect muscle integrity in response to lipotoxicity
Cell Death & Disease (2023)
-
Lactate detection sensors for food, clinical and biological applications: a review
Environmental Chemistry Letters (2021)
-
Human lung fibroblast-to-myofibroblast transformation is not driven by an LDH5-dependent metabolic shift towards aerobic glycolysis
Respiratory Research (2019)
-
Transketolase (TKT) activity and nuclear localization promote hepatocellular carcinoma in a metabolic and a non-metabolic manner
Journal of Experimental & Clinical Cancer Research (2019)
Comments
By submitting a comment you agree to abide by our Terms and Community Guidelines. If you find something abusive or that does not comply with our terms or guidelines please flag it as inappropriate.
