
Abstract
Material utilisation has been playing a fundamental role in economic development, but meanwhile, it may have environmental and social consequences. Given China’s rapid economic growth, understanding China’s material utilisation patterns would inform decisions for researchers and policymakers. However, fragmented data from multiple statistical sources hinder us from comprehensively portraying China’s material utilisation dynamics. This study harmonised China-specific official statistics and constructed a China economy-wide material flow accounts database. This database covers hundreds of materials and more than 30 years (1990–2020) from thousands of data sources, which is comprehensive, long-term, up-to-date, and publicly accessed. This database would provide insights into the historical metabolic dynamics of China’s economy with elaboration on the production, consumption, and end-of-life disposal of materials. This database also allows for international analyses since it is developed based on an internationally standardised analytical framework. Furthermore, this study would benefit studies on policy impact evaluation, environmental pressure assessment, and sustainable development strategies.
Measurement(s) | domestic extraction • emission • international trade • imports • exports |
Technology Type(s) | economy-wide material flow analysis |
Factor Type(s) | economy • environment • material flow |
Sample Characteristic - Location | China |
Background & Summary
Materials significantly contribute to sustainable development in a direct and indirect way1. That is, the utilisation of materials has been playing a fundamental role in economic growth and well-being, but at the same time, it may have environmental and social consequences. China has been rapidly developing with a massive number of materials utilised. Understanding China’s historical material utilisation patterns are essential for formulating appropriate policies for achieving global Sustainable Development Goals (SDGs)2, which necessitates a detailed quantitative picture of material production, consumption, and end-of-life disposal.
There have been several attempts to explore national material utilisation. Some studies focused on developing and improving the statistical accounting framework for quantifying material utilisation in terms of flows. The economy-wide material flow analysis (EW-MFA) is the origin and most widely used3, which depicts how the national economy system receives external materials and energy (i.e., input) from and releases wastes (i.e., output) to the environment. This framework was initially established in 2000 by the European Commission Statistical System (Eurostat) and was improved and adopted as an internationally standardised environmental-economic system accounting method by the Statistical Commission of the United Nations (UN) in 2012. The latest version of this framework was released in 20184. Based on this analytical framework, several EW-MFA indicators were derived to depict the metabolic processes5, which aid in developing effective strategies6. For example, the SDG targets for resource productivity (SDG 8.4) and sustainable use of natural resources (SDG 12.2) can be evaluated with EW-MFA results of the domestic material consumption. Previous EW-MFA studies on China’s economy revealed amounts, components, efficiencies, etc. of material utilisation for particular purposes, such as, monitoring the progress of the circular economy between 1995 and 20157, analysing policy effects between 1990 and 2002 for sustainable development5 and between 2000 and 2010 for circular economy8, formulating the 13th Five-Year plan strategies (2016–2020) based on historical patterns from 1992 to 20149. However, a long time-series profile of China’s rapid growth since the 1990s has yet to be identified.
Other studies have focused on harmonising data compilation procedures for EW-MFA application, which are essential for comparative analyses across multiple nations and periods. Typically, estimates of national material utilisation are based on a variety of data sources, which were gathered using various statistical criteria. For instance, agricultural statistics from the UN Food and Agriculture Organization (FAO)10, Eurostat foreign trade statistics, the United States geological survey (USGS), etc., were used in the EW-MFA of the EU. Before being applied to estimates, these original statistics need to be adjusted and aggregated. However, due to an incomplete understanding of data gathering and pre-processing procedures, uncertainties and biases may exist in further data interpretation3. For example, the USGS uses the weight unit of metal content to record the quantity of mineral production, whereas the China statistical department uses the gross ore unit, resulting in considerable differences in values. So far, existing data compilation tools are country/area-specific (e.g., for the EU4,11, the Asia-Pacific region12) or year/period-specific (e.g., 199913, 200014, and 20 century15), which are inapplicable to the China’s statistics. In addition to the differences between multinational datasets, uncertainties may arise, for example, from inevitable artificial errors during data preparation. However, it is time-consuming and labour-intensive to assess reliability related to data collection procedures since original statistics are fragmented over multiple databases and have to be processed before applications.
In this study, we first identify system boundaries, material types, materials, and processes related to China’s economy based on the internationally-standardised analytical framework (Economy-Wide Material Flow Analysis, EW-MFA), examine the reporting standards, material coverages, and time periods of official China-specific statistics, apply them to characterise China’s material utilisation patterns between 1990 and 2020, and analyse uncertainties from data collection and estimation procedures. This dataset covers hundreds of materials that have been extracted, emitted, imported, exported, and stored in China for more than thirty years. This dataset can be applied to the studies, including but not limited to:
-
Quantifying the in-use material stocks to evaluate the progress of the circular economy.
-
Analysing the sustainability of material use for any substances or materials in China to evaluate the progress toward the SDGs.
-
Compilating the Physical Input-Output Tables (PIOT) to aid in the analysis of the effects of policy on specific economic activities.
Methods
China economy-wide material flow identification: system boundary, processes, and materials
The first step is to define an economy, i.e., the economic (rather than geographical) territory of a country in which the activities and transactions of producer and consumer units are resident. Additionally, the period is a total of thirty-one years, from 1990 to 2020, for the following reasons: (1) statistics before 1990 are of poor quality and are insufficient to allow us to conduct analyses; and (2) so far, statistics have just recently been updated to cover the year of 2020. Furthermore, the analytical framework (hereinafter referred to as China EW-MFA) is developed to explore material utilisation and its environmental consequences within China’s economy.
The general structure of China EW-MFA is depicted in Fig. 1, which comprises seven processes. (1) Input of extracted resources: domestic natural resources are extracted from the environment to the economy through human-controlled means. (2) Output of domestic processed materials: after being processed by manufacturers, materials are released from the economy into the environment in the form of by-products and residues, which can be classified by their destinations (i.e., air, land, and water) and pathways (dissipative use and losses). (3) Input and (4) output by cross-border trade: by imports and exports, materials are transported between China’s economy and the economies of the rest of the world. (5) Input and (6) output of balancing items (BI): sometimes, materials identified in the output processes are not considered by inputs, which needs to be balanced. For example, the utilisation of fossil energy materials by combustion causes the emission of carbon dioxide (CO2) into the air, which is identified as system output, but requirements of oxygen (O2) as system input are not counted. (7) Additions to the system: within the economy, materials would have been added to the economy in the form of buildings, infrastructures, durable goods, and household appliances, which are referred to as the net additions to stock (NAS).

The general structure of China EW-MFA. To note, white data cells can be obtained directly from official statistics, whereas grey cells are estimated.
The last step is to specify the materials concerned in each process. Four types (in blue boxes in Fig. 1) of natural materials are extracted and input into the economy in China, i.e., harvested biomass (33 items), mined metal ores (28 items), quarried non-metallic minerals (155 items), and mined fossil energy materials (6 items in 3 classes). Materials (green boxes) released into the air are greenhouse gases (e.g., CO2, methane (CH4), dinitrogen oxide (N2O)), air pollutants (e.g., particulate matter 10 (PM10), black carbon (BC)), and toxic contaminants of mercury (Hg) in divalent, gaseous elemental, and particulate forms. Those released into the water are inorganic matters (of nitrogen (N), phosphorus (P), Arsenic (As), and four heavy metals of lead (Pb), mercury (Hg), cadmium (Cd), and chromium (Cr)) and organic matters of cyanide, petroleum, and volatile phenol. Materials released into the land are waste disposal in uncontrolled landfills, which are illegal in China. Some materials are dissipated by application, for example, fertilisers, compost, sewage sludge being applied to agricultural land, and pesticides being used to cultivate crops. Some would be unintentionally dissipated from abrasion, corrosion, erosion, and leakages. Materials (in red boxes) are BI, which includes the input of O2 and output of water vapour in the fossil energy material combustion process, the input of O2 and output of water vapour and CO2 in the respiration process of human and cultivated livestock, input and output of water in imported and exported beverages, and the output of water from domestically extracting crops.
There are some messages needed to be mentioned: (1) Material of water is not included since its flow volume is more substantial than others, which needs to be independently analysed; (2) Activities of foreign tourists, cross-border transfer of emissions through natural media, etc. are excluded. (3) To be clear, we refer to a data cell as a specific flow process of a specific substance in a specific year, e.g., the number of cereals domestically extracted in 2020.
Data acquisition: sources and collection
Based on our China EW-MFA, we first analyse accessibility, reliability, completeness, rules of redistribution, etc., for each data source (yellow boxes in Fig. 1), including China national database, China rural statistical yearbooks, USGS mineral yearbooks, etc. The complete list of data sources and descriptions are presented in Table 1. Then, we store the originally retrieved data source files in a semi- or unstructured format (e.g., CSV, PDF). Next, we manually collect these statistics and reorganise them according to China EW-MFA material types and processes. However, only a tiny part of retrieved statistics can be applied directly, as specified in black colour in Fig. 1.
Data compilation: parameter localisation and data estimation
A few inconsistencies in statistics were noticed, which would result in data incompleteness. For example, the domestic extraction of vegetables has been accounted for and published since 1995, before which statistics are unavailable. The domestically harvested timber has been measured in the volume unit of cubic metres, which needs to be converted into the mass unit via density conversion factor. Therefore, acquired statistics have to be estimated, which are specified in grey colour in Fig. 1. The following section elaborates on each data cell’s estimation methods, localised parameters, references, etc. In our uploaded data files, the original statistics, data sources, and compilation methods (using formulas) are all implemented, as explained in the Data Records Section.
-
The input of natural resources by domestic extraction
-
Vegetables in crops: Statistics of vegetable production (WVegetables)16 during 1990–1994 are unavailable, which is estimated based on the relationship between the production yield (PYield) and areas (AVegetables), as shown in Eq. 1. Here, PYield is assumed to remain constant at 27.04 thousand tonnes per thousand hectares from 1990 to 1995, derived by dividing vegetable production (257,267 thousand tonnes) by areas (9,515 thousand hectares) in 1995.
$${W}_{Vegetables}={P}_{Yield}\times {A}_{Vegetables}$$(1) -
Nuts in crops: One of them is chestnuts. The chestnut production in 2020 is unavailable, which is assumed to be the same as in 2019.
-
Crop residues in biomass residues: They are referred to as that harvested production of crops that do not reach the market to be sold but are instead employed as raw materials for commercial purposes such as energy generation and livestock husbandry. This number (Wcrop residues) can be calculated by first determining the number of crop residues available from primary crop production (Wcrop) and the harvest factor (Pharvest factor), and then using the recovery rate (Precovery rate) to determine the number of crop residues used by the economy, as shown in Eq. 2. These parameters have been localized by previous studies17,18, which are adopted in this study, i.e., wheat (1.1 for Pharvest factor and 0.463 for Precovery rate), maize (1.2, 0.463), rice (0.9, 0.463), sugar cane (0.5, 0.9), beetroots (0.7, 0.9), tuber (0.5, 0.463), pulse (1.2, 0.7), cotton (3.4, 0.463), fibre crops (1.8, 0.463), silkworm cocoons (1.8, 0.463), and oil-bearing crops (1.8, 0.463).
$${W}_{cropresidues}={W}_{crop}\times {P}_{harvestfactor}\times {P}_{recoveryrate}$$(2) -
Roughage of grazed biomass and fodder crops in biomass residues: In China, the grazed biomass for roughage includes annual forage and perennial forage, whereas fodder crops comprise straw feed, processed straw feed, and all other fodder crops. However, information19 on grazed biomass production is only accessible from 2006 to 2018, whereas fodder crop statistics are only available from 2015 to 2017. Equation 3 and Eq. 4 can be used to estimate unavailable statistics. To note, we assume that China’s domestic roughage supply structure has remained unaltered, which has two meanings. The proportion of total domestic roughage production (WDomestic production) in requirement (WRoughage requirement) has remained constant, while the proportion (PSupply fraction) of grazed biomass and fodder crop in domestic roughage production has been unchanged. The requirement (WRoughage requirement) is determined by the quantity of livestock (QLivestock) and their annual feeding amount (PAnnual intake). PAnnual intake (in tonnes per head per year) has been localised for each type of livestock4, with 4.5 for live cattle and buffaloes, 0.5 for sheep and goats, 3.7 for horses, and 2.2 for mules and asses.
$${W}_{Roughagerequirement}={Q}_{Livestock}\times {P}_{Annualintake}$$(3)$${W}_{Domesticproduction}={W}_{Roughagerequirement}\times {P}_{Supplyfraction}$$(4) -
Timber in wood: As illustrated in Eq. 5, wood production16 is reported in volume units of cubic metres (VTimber), which need to be converted into mass units (WTimber) via density (PDensity). The parameter PDensity is assumed to be 0.58 tonnes per cubic metre, calculated by averaging 0.52 for coniferous types and 0.64 for non-coniferous ones4.
$${W}_{Timber}={V}_{Timber}\times {P}_{Density}$$(5) -
Non-ferrous metals in metal ores: Non-ferrous metal statistics are derived from two sources. China statistics20 are measured in gross ore (WMetal ores in gross ore) but are only available from 1999 to 2017, whereas the USGS statistics21 cover the period of 1990 to 2020 but they are measured in metal or concentrate content (WMetal ores in other units). Therefore, USGS statistics need to be converted with an empirical unit conversion factor (PUnit conversion factor) before being applied to estimate unavailable statistics reported by China, as shown in Eq. 6. Conversion factors are localised for each non-ferrous metal in each year from 2000 to 2017 by using USGS statistics divided by China statistics and then averaged after removing the highest value and the lowest value (i.e., trimmed mean). This factor could capture the general relationship between statistics from two separate sources, which can be used in other long time-series studies on resource management on a particular element in China.
$${W}_{Metaloresingrossore}={W}_{Metaloresinotherunits}/{P}_{Unitconversionfactor}$$(6) -
Non-metallic minerals: The official China-specific information on non-metallic mineral domestic production is available between 1999 and 201720, the rest of which could be estimated from USGS statistics (1990–2020)21. Also, two differences in reporting standards are observed resulting from the material coverages and reporting units. China statistics contain eighty-eight materials in mineral ores, whereas the USGS only includes twenty in the concentrate unit. Therefore, a conversion factor is developed in this estimation, as shown in Eq. 7. This conversion factor is applied to the total amount of non-metallic mineral production, which is assumed to have been constant from 1990 to 1999 at 11.38% (1999) and 12.56% (2017) from 2017 to 2020.
$${W}_{Mineralsingrossore}={W}_{Mineralsinotherunits}/{P}_{Conversionfactor}$$(7) -
Coal in fossil energy materials: Coal, mined in China, includes raw coal, peat, stone coal, and oil shale. Except for raw coal, statistics for the rest are only available from 1999 to 201720. The unavailable data (WOther coals) is estimated using Eq. 8 under the assumption that the structure of the coal supply in China barely changes. That is, the proportion (PSupply fraction) of peat, stone coal, and oil shale in raw coal production (WRaw coal) remains constant, so the 1999 proportion is applied to all years before that (earlier years of 1990–1998), while the 2017 proportion is used to the recent years between 2018 and 2020. For example, PSupply fraction for oil shale production was assumed to be 0.014% during 1990–1999, calculated by dividing raw coal production (1,250,000) by oil shale production (179) in 1999. PSupply fraction in the earlier and the recent years are 0.007% and 0.001% for peat, 0.203% and 0.031% for stone coal, and 0.014% and 0.067% for oil shale.
$${W}_{Othercoals}={W}_{Rawcoal}/{P}_{Supplyfraction}$$(8) -
-
The output of processed materials by release
-
Materials released into the air: In China, thirteen materials are released into the air, as shown in Fig. 1. The emission of sulphur dioxide (SO2) is reported in China environmental statistical yearbooks22,23, while the rest is specified in the EDGAR24. However, in EDGAR, statistics for recent years have not yet been updated, which are estimated with the value in the most recent year in our database. For example, nitrous oxide (NOx) records are only available for the years prior to 2016, with 26,365 thousand tonnes in 2015 and 26,837 in 2014. As a result of the observed decreasing trend in NOx emissions, NOx emission data for 2016–2020 is estimated to be 26,000 thousand tonnes. This estimate may be subjective due to constraints, but it would be aligned with European statistics, allowing for international comparisons. Data can be updated after the EDGAR statistics have been updated.
-
Materials released into the water: Ten principal materials have been found in China wastewater (both industrial and municipal) that are nitrogen (N), phosphorus (P), organic pollutants of petroleum, volatile phenol and cyanide, heavy metals of mercury (Hg), lead (Pb), cadmium (C·d), and the hexavalent chromium (Cr6+), and arsenic (As). Many statistics22,23 have been of poor quality (e.g., inconsistent material coverages between years). Given that the statistics of pollutants in industrial wastewater cover more periods and contain fewer abnormal observations, the total material emissions can be approximated from those of industrial wastewater. Equations 9 and 10 show the estimation processes. The materials in industrial wastewater (WIndustrial materials) are first identified using material mass concentration (PConcentration) and the weight of industrial wastewater (WIndustrial wastewater), and then the materials in total wastewater (WTotal materials) are identified using the proportion (PContribution) of materials in industrial wastewaters (WIndustrial materials) to the total. The assumption is that PConcentration and PContribution change gradually between years, which enables to use linear interpolation method to estimate unavailable parameters. Consider cyanide: its PConcentration was 23.61 (1‰ ppm) in 2005 and 37.31 in 2002, which was assumed to be 28.18 in 2004 and 32.74 in 2003. PConcentration was assumed to be 100% throughout the years for cyanide because all cyanide emissions in China are driven by industrial wastewater discharges. Later, the total material emissions can be derived by dividing the industrial wastewater mass by PConcentration.
$${W}_{Industrialmaterials}={W}_{Industrialwastewater}\times {P}_{Concentration}$$(9)$${W}_{Totalmaterials}={W}_{Industrialmaterials}\,/\,{P}_{Contribution}$$(10) -
Materials released to the land: This is zero because uncontrolled landfills are illegal in China.
-
Materials dissipated by organic fertiliser use: In China, manure is the primary organic fertiliser, which is excreted by pigs, dairy cows, calves, sheep, horses, asses, mules, camels, chickens, and other animals. As shown in Eq. 11, the manure production (WManure) is estimated through the amounts of raised livestock (QLivestock, heads), the weight of daily manure production (PManure production, kilograms per head per day), the number of days they are raised (PFeeding period, in days per year), and the moisture content of their manure (PDry matter, %) for each type of animal. These parameters are region-specific, which have been localised by Chinese scholars25,26,27 and listed in Table 2.
$${W}_{Manure}={Q}_{Livestock}\times {P}_{Manureproduction}\times {P}_{Feedingperiod}\times {P}_{Drymatter}$$(11)Table 2 Localised parameters for animal manure production. -
Materials dissipated by mineral fertiliser use: The mineral fertilisers used in China are four types, i.e., nitrogen (N), phosphorus (P), potash (K), and compound. Their usage (WFertiliser usage) is measured in nutrient mass (WNutrient materials), which needs to be converted into the gross mass by dividing their nutrient content (PNutrient content). Equation 12 shows the estimation. This parameter of PNutrient content is localised by the Ministry of Agriculture and Rural Affairs of China28 as 29%, 22%, 35%, and 44% for N- bearing, P- bearing, K-bearing, and compound fertilisers, respectively.
$${W}_{Fertiliserusage}={W}_{Nutrientmaterials}/{P}_{Nutrientcontent}$$(12) -
Materials dissipated by sewage sludge: Sewage sludge is the residue generated by municipal wastewater treatment. As demonstrated in Eq. 13, its dissipative use (Wss, dissipation) is the untreated amount of production (Wss, production), represented by the parameter of Pss, dissipation rate. Sewage sludge production (Wss, production) statistics are only available for the years 2006–202029, and data for the remaining years can be estimated using Eq. 14 and Eq. 15. In Eq. 14, Pss, production rate represents the relationship between sewage sludge production (Wss, production, 2006–2020) and wastewater treatment (Www, treatment, 2002–2020), and in Eq. 15, Pww, treatment efficiency represents the relationship between the quantity of treated wastewater (Www, treatment, 2002–2020) and the treatment capacity (Www, treatment capacity, 1990–2020). In this estimation, three assumptions are made. The first is to estimate Www, treatment, Pww, treatment efficiency is assumed to be unchanged at 63% during 1990–2001, given it has been increasing from 63% in 2002 to ~80% in recent years. The second is that, in order to estimate Wss, production, Pss, production rate is assumed to be unchanged at 3.5 between 1990 and 2005, suggesting 3.5 tonnes of sewage sludge are generated by processing 10,000 cubic metres of wastewater. This assumption is determined by that Pss, production rate is approximately 3.5 during 2006–2010 while declines sharply and stabilises at around two during 2011–2020. The last is, to estimate the Wss,dissipation, Pss,dissipation rate is assumed to be 5% between 1990 and 2005, given it has been around 5% during 2006–2020.
$${W}_{ss,dissipation}={W}_{ss,production}\times {P}_{ss,dissipationrate}$$(13)$${W}_{ss,production}={W}_{ww,treatment}\times {P}_{ss,productionrate}$$(14)$${W}_{ww,treatment}={W}_{ww,treatmentcapacity}\times {P}_{ww,treatmentefficiency}$$(15) -
Materials dissipated by composting: Composting is a natural process that uses microbes to turn organic materials into other products, which are then used for fertilising and entering the environment. In China, composting has been used to treat two materials: feces and municipal waste, whose quantities (WComposting) were only available from 2003 to 201029. The unavailable data can be estimated using Eq. 16. The dry weight of materials treated by composting (WComposting) is proportionally related to the fresh weight of all treated materials (WTotal), the proportion treated by composting (PComposting rate), and the dry content (PDry matter). Considering that China’s composting capacity has been declining since 2001 due to the implementation of waste incineration power generation technologies30, Pcomposting rate is assumed to be the same as it was in 2003 (9.5%) between 1990 and 2002, and 1.5% in 2010 between 2011 and 2020. The parameter of PDry matter is 50%4.
$${W}_{Composting}={W}_{Total}\times {P}_{Compostingrate}\times {P}_{Drymatter}$$(16) -
The input and output by cross-border trade. Statistics of imports and exports have been gathered since 1962 and stored in the UN Comtrade database31. However, the data quality issue of outliers, and missing values, especially in weight, is reportedly identified. In our previous work, we addressed these issues, and an improved database32 is provided. Details about our estimation methods can be found in publications33,34,35. As UN Comtrade lists 5,039 different commodity types (in 6-digit HS0 commodity code), yet only 18 material types are specified in the China EW-MFA, UN Comtrade statistics need to be aligned to the China EW-MFA framework. Therefore, we compared each commodity and each material type between them and established a correspondence table to map UN Comtrade commodity types onto our EW-MFA material types. For example, non-ferrous metal materials of China EW-MFA include commodities, such as copper ores and concentrates (260300 HS0 code), silver powder (710610), manganese, articles thereof, and waste or scrap (811100), etc., whereas biomass residues include cereal straw and husks (121300), lucerne meal and pellets (121410), and other fodder and forage products (121410). This correspondence table between HS0 and EW-MFA classification for imports and exports is provided in Supplementary File 1.
-
-
The input of balancing items
-
O2 required for combustion: In BI, requirements for materials can be abstracted as equalling exogenous demands minus intrinsic supplies (Eq. 17). Three parts (two demands and one supply) are considered for O2 requirements by the combustion process: (1) demanding exogenous oxygen to oxidise elements (e.g., carbon, sulphur, nitrogen, etc., except for hydrogen) released into the air, (2) demanding exogenous oxygen to oxidise the hydrogen embedded in fossil energy materials, and (3) providing intrinsic oxygen embedded in fossil energy materials. The first part can be estimated via Eq. 18 by multiplying air emissions (WEmissions) of CO2, N2O, NOx, CO, and SO2 by their oxygen content (POxygen content). For the second (Eq. 19), the oxygen demand is estimated based on the principle of mass balance by converting the hydrogen amount of domestically utilised fossil energy materials (WFossil fuel materials × PHydrogen content) via molar mass conversion factor (PMass conversion factor). PMass conversion factor equals 7.92, derived by the molar mass of one oxygen (16 g/mol) divided by that of two hydrogen atoms (2 × 1.01 g/mol). The last is the intrinsic supplies from fossil fuel materials, which is identified via Eq. 20 by multiplying the domestically utilised amount of fossil fuel materials (WFossil fuel materials) by their oxygen content (POxygen content). The parameters in this estimation are presented in Table 3. As a footnote here, the domestically utilised amount is referred to as the domestic material consumption (DMC), which equals domestic extraction (DE) plus imports (IM) and minus exports (EX).
$${W}_{Requirements}={W}_{Demands}-{W}_{Supplies}$$(17)$${W}_{Demands}={W}_{Emissions}\times {P}_{Oxygencontent}$$(18)$${W}_{Demands}={W}_{Fossilfuelmaterials}\times {P}_{Hydrogencontent}\times {P}_{Massconversionfactor}$$(19)$${W}_{Supplies}={W}_{Fossilfuelmaterials}\times {P}_{Oxygencontent}$$(20)Table 3 Parameters related to combustion processes4. -
O2 required for respiration: O2 is required by the metabolic activities of living organisms, the majority of which are humans and livestock. Bacteria are another sort of organism, which are not included in this estimation because their O2 requirements are too small to be quantified. The respiration-required O2 is related to the total quantity (QOrganisms) and their respiration activity by organism types, as shown in Eq. 21. The respiration activity is represented by the respiration requirement coefficient (PRespiration requirement coefficient), which is the average quantity of O2 that each organism utilises to maintain the metabolic activity, as listed in Table 4.
$${W}_{Demands}={Q}_{Organisms}\times {P}_{Respirationrequirementcoefficient}$$(21)Table 4 Parameters related to respiration processes4. -
Water required for the domestic production of exported beverages: The exported beverages are produced domestically using domestically extracted materials, especially a large amount of water. The weight of water is considered in the output by cross-border trade but is not included in the domestic extraction input. The resulted imbalance can be identified by specifying the water weight in beverages, i.e., multiplying the traded beverage weight (WMaterials) by a parameter of the water content (PWater content), as given in Eq. 22. Fruit and vegetable juices (2009 in HS0 code) and beverages (code 22) are covered in the improved UN Comtrade database32, with PWater content of 85% for the first and 90% for the latter4.
$${W}_{Water}={W}_{Materials}\times {P}_{Watercontent}$$(22) -
-
The output of balancing items.
-
Water vapour from combustion: Water vapour emissions by domestically combusting fossil fuel materials are contributed by two paths. The direct evaporation of embedded water is the first path (Eq. 23), which can be derived by multiplying the DMC of fossil fuel materials by their moisture content (PMoisture content). The PMoisture content for each type of fossil fuel material is listed in Table 3. The other is the generation of water vapour during hydrogen oxidation, which can be calculated by converting the oxidised weight of hydrogen to the water weight using the molar mass conversion factor (PMass conversion factor), as given in Eq. 24. PMass conversion factor equals 8.92 by dividing the molar mass of water (18.02 g/mol) by that of two hydrogen atoms (2 × 1.01 g/mol).
$${W}_{Water}={W}_{Fossilfuelmaterials}\times {P}_{Moisturecontent}$$(23)$${W}_{Water}={W}_{Fossilfuelmaterials}\times {P}_{Hydrogencontent}\times {P}_{Massconversionfactor}$$(24) -
Water vapour and CO2 from respiration: Respiration activities of organisms will produce water vapour and CO2, whose estimation is similar to that of O2 requirements. As shown in Eq. 25, the respiration-caused gas emissions are related to the number of organisms (QOrganisms) and the respiration activity by organism types. The latter is represented by the parameter of respiration emission coefficient (PRespiration emission coefficient), which is specified in Table 4 for water vapour and CO2 for each type of organism.
$${W}_{Emissions}={Q}_{Organisms}\times {P}_{Respirationemissioncoefficient}$$(25) -
Water from imported beverages: The estimation approach is the same as water by the domestic production of exported beverages, as described in Eq. 16.
-
Water in biomass products: Usually, the input of biomass products by domestic extraction16 has been measured in fresh weight, but their corresponding output29 by sewage sludge, composting, etc., are in dry weight, leading to an imbalance in water weight. The water weight in biomass products is calculated by multiplying their domestic extraction amount in fresh weight (WBiomass) by a parameter of moisture content at harvest (PMoisture content), as shown in Eq. 26. The values of PMoisture content by biomass products are presented in Table 5.
Table 5 The moisture content at harvest for each biomass product4.
-
Material flow quantification
The above attempts have quantified material inputs and outputs by flows and presented a detailed profile of material utilisation for each material in China’s economy. In order to depict the economy in a more general way, EW-MFA indicators are assessed by aggregating flows by materials or periods as below.
-
Domestic extraction (DE): is referred to as natural materials that are extracted from the domestic environment and are used in the domestic economy, i.e., the total input of natural materials by extraction.
-
Domestic processed output (DPO): is referred to as materials that are released to the domestic environment after being processed in the domestic economy, i.e., the total output of processed materials by release.
-
Import (IM): is referred to as all goods (in the form of raw materials, semi-finished materials, and final products) that originated from other economies and are further used in the domestic economy. It is calculated as the sum of all imported goods.
-
Export (EX): is referred to as all goods that originated from the domestic economy and are transported to other economies to be used. It is calculated as the sum of all exported goods.
-
Domestic material input (DMI): is referred to as materials that originated from the domestic environment by extraction and other economies and are available (to be used or to be stored) for the domestic economy. It is calculated as the sum of DE plus IM, as shown in Eq. 27.
$$DMI=DE+IM$$(27) -
Domestic material consumption (DMC): is referred to as materials that are directly used in the domestic economy after parts of them are exported to other economies. It is calculated as the difference between DMI and EX.
-
Physical trade balance (PTB): is referred to as a surplus or deficit of materials for the domestic economy. It is calculated as the difference between IM and EX.
-
Net additions to stock (NAS): is referred to as materials that remain in the domestic economy. It is calculated by taking BI items into account, as shown in Eq. 28.
Data Records
A total of seven data files are accessed publicly at figshare repository36 and at our online website(https://www.macycle.org/china-ewmfa/). Five Excel files in .xlsx format provide detailed information on data compilation, including original statistics, data sources, and estimation methods (using formulas). Being interoperable and reusable, the ready-to-use China EW-MFA data are prepared in two files (EWMFA_Flows.csv and EWMFA_Flows.json). Data records in each file are introduced in brief as follows.
-
Domestic Extraction.xlsx: This file contains original statistics as well as data sources and estimated data related to the quantification of DE. from 1990 to 2020. In addition, the compilation tools for DE estimation as described above are implemented in the file using formulas only. As shown in Fig. 2, China extracted 4,178 million tonnes of natural materials in 1990, but this figure is three times larger (12,462) in 2020. The total DE increased rapidly from 1990 to 2010 and then remained flat from 2011 to 2014, with a slight decrease after 2015. In addition, the percentage of each material changed slightly. The extraction of non-metallic minerals has accounted for the majority, followed by fossil energy materials. However, the gap between them has shrunk, which was almost the same during 2012–2014. This percentage of biomass has been falling, with 20% in 2000 but 15% in 2020. With regard to metal ores, their DE percentage increased slightly from 2000 (7%) to 2015 (16%) but then fell to 10% in 2020.
Fig. 2 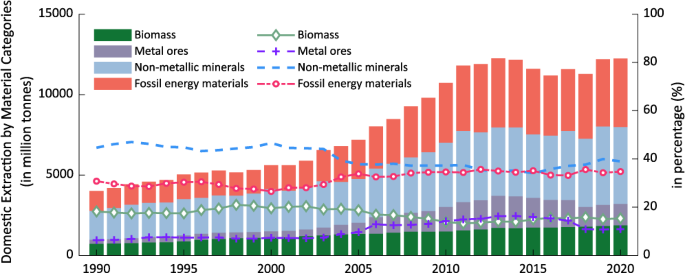
Domestic extraction of natural materials by China’s economy during 1990–2020.
More specifically, Fig. 3 presents the domestic extraction of each resource from 1990 to 2020. Among biomass materials extracted, crops accounted for the majority with an average of 1,300 million tonnes, followed by residues (165), wild products (45), and wood (3.5). Details of, for example, cereals in crops, grazed biomass in residues, and timber in wood, can be found in Supplementary File 2. The extraction of iron ores grew dramatically from 1990 (168 million tonnes) to 2013 (1522) but decreased recently to 866 in 2020, with a ten-year low of 763 in 2018. Furthermore, the extraction of non-ferrous metal ores has been no more than 600 million tonnes, with copper (Cu), gold (Au), and molybdenum (Mo) accounting for the majority. In fossil energy materials, over 95% are occupied by coal, with crude oil and natural gas following. There is a rising trend in the extraction of natural gas. The annual coal extraction increased from 1,082 million tonnes in 1990 to 3,905 in 2020, with a peak at 3,978 in 2013 and a slight drop to 3,412 in 2016. Differently, crude oil extraction has been stabilising in the range of 130–200 million tonnes per year.
Fig. 3 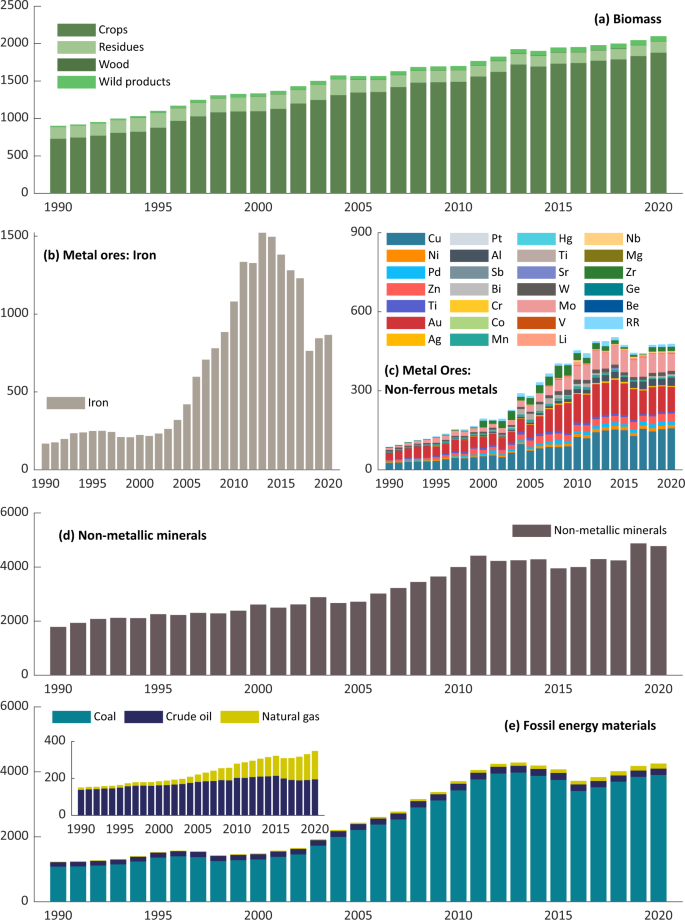
Domestic extraction of each material by China’s economy during 1990–2020, by biomass (a), metal ores of iron (b) and non-ferrous metals (c), non-metallic minerals (d), and fossil energy materials (e). Values are measured in a million tonnes.
-
Domestic Processed Output.xlsx: This file contains original statistics as well as data sources and estimated data related to the quantification of DPO from 1990 to 2020. In addition, the compilation tools for data estimation as described above are implemented in the file using formulas only. As indicated in Fig. 4(a), the number of materials released from China’s economy to the environment has been increasing from 2,869 in 1990 to 12,710 million tonnes in 2020, which is six-fold growth at a rate of 330 million tonnes per year. Between 2000 and 2013, there was a significant increase in material output. The figure has risen from 4,070 in 2000 to 11,510 in 2013, with an annual growth rate of 572 million tonnes. It is worth emphasising that the CO2 emissions to the air contribute to the majority (greater than 90%) of the DPO, with 92.4% in 1990 and 98% in 2020, as shown in Fig. 4(b). Other emissions to air (Fig. 4(c)) also show an increasing trend, primarily contributed by CO and CH4. As shown in Fig. 4(d), the DPO to water is found to be decreasing from 9.5 in 1991 to 1.2 million tonnes in 2019, suggesting an improved water quality in China. N is the primary material in DPO to water, which is sourced from fertiliser applications and discharges from livestock, domestic and industrial sources37. Sharp decreases in N emissions are observed from 4.61 million tonnes in 2015 to 1.24 in 2016, which can be ascribed to China’s 13th Five Year Plan’s efforts to upgrade urban sewage systems, increase wastewater treatment rates, and reduce fertiliser usage38. However, a rise is observed in 2020, which may be attributed to rising municipal wastewater volumes during the pandemic period and the corresponding increasing emission of N39. The rest materials released into the water are mostly released by industrial wastewater, whose emission has been declining from 0.105 in 1990 to 0.004 (3%) million tonnes in 2020. The emissions by dissipative use (Fig. 4(e)) are primarily caused by the utilisation of organic (average at 215 million tonnes) and mineral fertilisers (150), followed by compos (2.2), pesticides (1.4), and sewage sludge (0.2). The DPO to land and through dissipative loss are zero in China.
Fig. 4 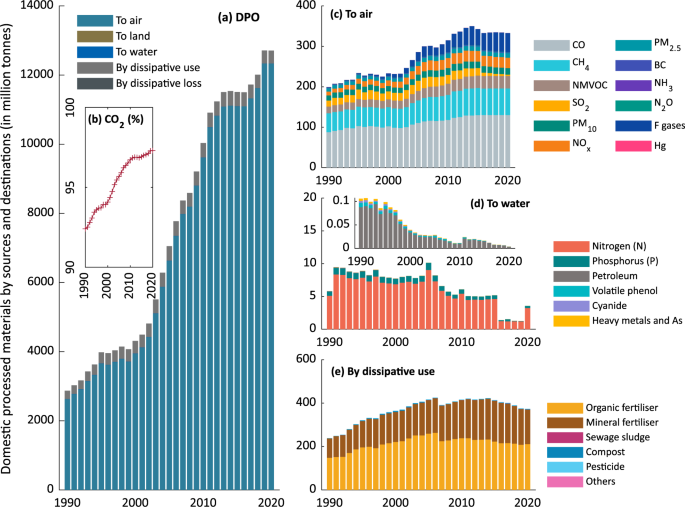
Output of domestic processed material by sources and destinations during 1990–2020. Values are measured in a million tonnes. (a) is the total amount; (b) is the percentage that output of CO2 accounts for the total DPO; the number of each material to air (c), to water (d) and by dissipative use (e).
-
Balancing Items.xlsx: This file contains original statistics as well as data sources and estimated data related to the quantification of BI from 1990 to 2020. In addition, the compilation tools for data estimation as described above are implemented in the file using formulas only. The BI for both input and output is dominantly contributed by the combustion process, followed by the respiration process, as shown in Fig. 5. To note, Fig. 5(a) shows abrupt increases in the amount of water needed to domestically produce exported beverages, which are ascribed to significant exports to China’s special administrative region of Hong Kong in 2000 (43.2 million tonnes), 2001 (43.4), 2003 (36.7), 2011 (14.4) and 2012 (68.7). In Fig. 5(b). the significant increase in the imported beverages’ water was the result of large imports from Japan in 2012 while the United States and France during 2016–2018.
Fig. 5 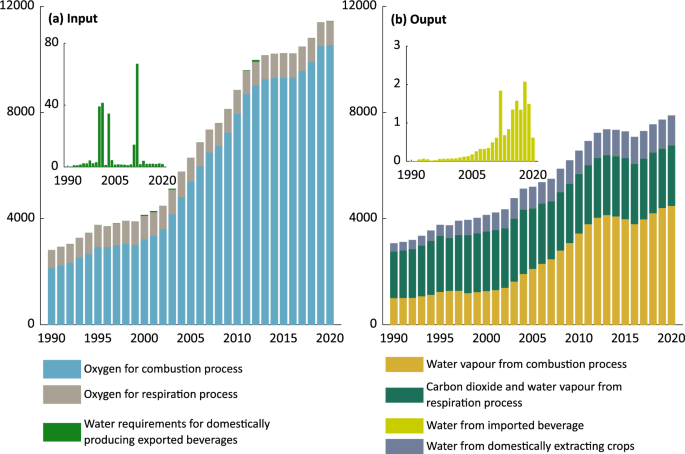
BI by input (a) and output (b). Values are measured in a million tonnes.
-
Imports and Exports.xlsx: This file contains data records of all imported and exported goods, by EW-MFA classifications of materials and by flows of IM and EX. As shown in Fig. 6(a), from 1990 to 2019, China’s economy imported a rising number of materials, which had a drop in 2020. The figure for 2020 is 1,619 thousand tonnes, which is roughly half of the total for 2019 (2,779). The imported materials are mostly metal ores and fossil energy materials, followed by biomass and non-metallic minerals. Regarding exported materials in Fig. 6(b), the total amount has continuously increased from 10 in 1990 to 864 thousand tonnes in 2020 (more than eighty times).
Fig. 6 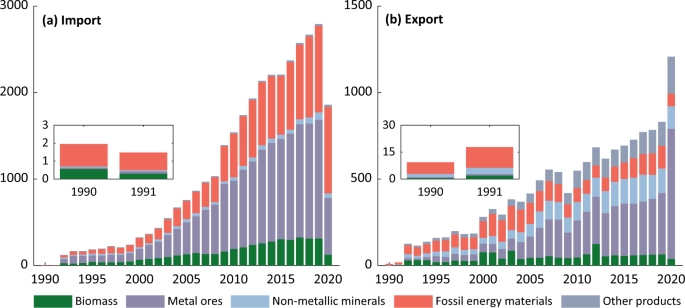
The IM (a) and EX (b) by materials. Values are measured in a thousand tonnes.
-
China EW-MFA Accounts (1990–2020).xlsx: It contains flows and derived indicators from 1990 to 2020 for China’s economy and for each material category, which is the result calculated from the above statistics. Indicators are DE, IM, EX, DMI, DMC, NAS, and PTB, for China’s economy, biomass, metal ores, non-metallic minerals, and fossil energy materials respectively, while BI, and DPO for China’s economy. Figure 7(a) shows the number of materials that China’s economy inputs, uses, and stores each year, and the percentage of IM in DMI, which represents the import dependency. Both DMI and DMC have experienced remarkable growth, with no significant difference between them. This indicates that most input materials are utilised by China’s economy, and China has been rapidly developing. Moreover, this development has been intensively utilising domestic resources, given that ~90% of DMI is contributed by DE. However, the percentage of IM in DMI has been continuously increasing from 2.5% in 1992 to 18.3% in 2019, indicating that China’s economy is becoming more reliant on imported resources. This greater dependence is also observed with a gradual increase of PTB in Fig. 7(b), suggesting an increasing difference between imports and exports.
Fig. 7 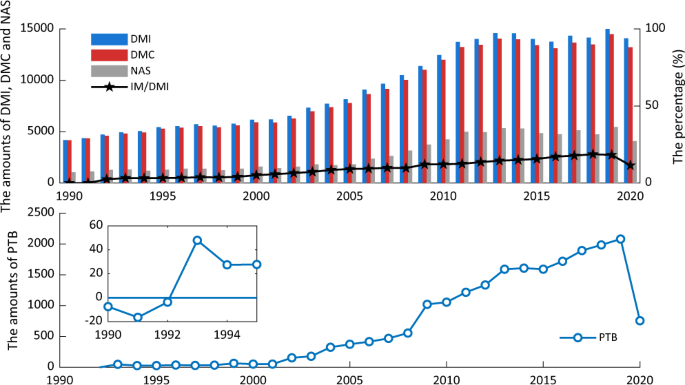
The EW-MFA indicators for China’s economy, with DMI, DMC, NAS, and IM/DMI in (a) and PTB in (b). Values are measured in a million tonnes.
-
EWMFA_Flows.csv and EWMFA_Flows.json: These two files contain the whole dataset (4,620 data cells) in an interoperable format, which can be directly applied in studies.


Technical Validation
Data validation
Regarding our study, this database is designed to provide officially verified data that are related to the material flows in China by collecting and compilating China-specific statistics. Therefore, the data quality of this database is ensured by the official statistics’ data quality. Our data validation should be established to verify that any data values are consistent with those officially published statistics. This is verified by manually reviewing any data values repeatedly using a developed data quick-check tool. This tool connects every data cell to its source (in any format), making it easy and convenient for a manual double-check of data consistency to improve the reliability of this study. This tool was developed with the Office Visual Basic for Applications (VBA) and is built into the data collection files. The instructions and source codes for this tool can be found in Supplementary File 3 and Supplementary File 4. To note, this tool can be applied to any data collection procedure. Additionally, by reviewing any graphical presentations of the data (Figs. 2–7), extreme values, outliers, and missing values are detected and verified, and the results show there is a good continuity and consistency in time and categories. That is to say that our dataset may be applicable for supplementing the existing data, and thus could provide the most long-term and up-to-date metabolic information about China’s economy.
Uncertainties, limitations, and future work
In this study, uncertainties stem from artificial errors during statistic collection and subjective parameter selection during data compilation.
-
The major uncertainty of this constructed database is caused by artificial mistakes (e.g., vision errors) during statistic collection procedures. Trying to reduce this, we repeatedly review the data values of this dataset and compare them with the officially-published statistics. So far, this statistic collection procedure still must be done manually, because original statistical publications are unavailable for direct use. The reasons are (1) most original statistical publications are stored in only human-understandable data format, and (2) these formats and also statistical criteria (e.g., units, material coverages) have been continuously changing. As a result, before statistics are applied, these publications must be compared and converted, both of which must be done manually. So far, this study has integrated compilation methods with a pre-defined data format, allowing the material flows to be determined correspondingly by re-organizing the collected statistics into each data cell. It works like a calculator, with statistics in and material flow results out, which to a large extent has reduced uncertainties in the flow quantification. For future studies, the focus could be put on converting original statistical publications into a data format that a machine can directly understand and process, using technologies, such as pattern recognition and natural language processing. These efforts could reduce human-related uncertainties to a larger extent.
-
In data estimation, parameter uncertainties always exist since parameters are rarely perfectly accurate. In this study, trying to mirror the reality as closely as possible, we used most of the parameters that had been localised as China-specific by previous studies. For example, PNutrient content for China-used mineral fertilisers has been identified by the China statistical department. However, some parameters have not been localised, for example, the moisture content of fossil fuel materials in China. These parameters were adopted as indicated by the Eurostat4, which could allow international comparisons but may lead to differences between the estimated results and the facts. In addition, uncertainties may inevitably stem from our subjective parameter assumptions, that parameters are assumed to be static or changing linearly during a period. These assumptions may cause under-or overestimation of flows and related indicators. For example, the yield of vegetable production (PYield) is assumed to be unchanged from 1990 to 1994, which may result in small biases in estimations of DE, BI (Output of water in biomass products), and other indicators. However, minor uncertainties are likely to arise because only a small percentage of flows are estimated based on assumptions.
Code availability
All the results were generated using the basic formulas in Excel (version 2204). Along with results, all formulas are built into our Data Record files (Domestic Extraction.xlsx, Domestic Processed Output.xlsx, Imports and Exports.xlsx, Balancing Items.xlsx, and China EW-MFA Accounts (1990–2020).xlsx) at figshare repository36. The tool for checking data consistency is developed with the Office Visual Basic for Application (VBA), which can be built into any Excel file. The instructions and source codes are provided in Supplementary File 3 and Supplementary File 4. These codes are publicly available.
References
Lucia, M. et al. Mapping the role of raw materials in sustainable development goals: a preliminary analysis of links, monitoring indicators and related policy initiatives. https://data.europa.eu/doi/10.2760/026725 (2019).
Schandl, H. & West, J. Material Flows and Material Productivity in China, Australia, and Japan. J. Ind. Ecol. 16, 352–364 (2012).
Fischer-Kowalski, M. et al. Methodology and Indicators of Economy-wide Material Flow Accounting. J. Ind. Ecol. 15, 855–876 (2011).
European Commission & Eurostat. Economy-wide material flow accounts handbook: 2018 edition. https://data.europa.eu/doi/10.2785/158567 (2018).
Xu, M. & Zhang, T. Material Flows and Economic Growth in Developing China. J. Ind. Ecol. 11, 121–140 (2008).
United Nations Environment Programme. Global Resources Outlook 2019: Natural Resources for the Future We Want https://wedocs.unep.org/20.500.11822/27517 (2019).
Wang, H. et al. Measuring progress of China’s circular economy. Resour. Conserv. Recy. 163, 105070 (2020).
Li, N., Zhang, T. & Liang, S. Reutilisation-extended material flows and circular economy in China. Waste. Manage. 33, 1552–1560 (2013).
Dai, T. & Wang, W. The Characteristics and Trends of Socioeconomic Metabolism in China. J. Ind. Ecol. 22, 1228–1240 (2018).
United Nations Food and Agriculture Organization. Food and Agriculture data https://www.fao.org/faostat/en/#data (2022).
European Commission. Economy-wide material flow accounts and derived indicators: a methodological guide. https://ec.europa.eu/eurostat/web/products-manuals-and-guidelines/-/ks-34-00-536 (2001).
Javorsek, M., Statistician, A. & Division, E. S. Asymmetries in International Merchandise Trade Statistics: A case study of selected countries in Asia-Pacific. https://www.unescap.org/sites/default/files/SD_Working_Paper_April2016_Asymmetries_in_International_Trade_Statistics.pdf (2016).
Schandl, H. & Eisenmenger, N. Regional Patterns in Global Resource Extraction. J. Ind. Ecol. 10, 133–147 (2006).
Krausmann, F. et al. Global patterns of socioeconomic biomass flows in the year 2000: A comprehensive assessment of supply, consumption and constraints. Ecol. Eco. 65, 471–487 (2008).
Krausmann, F. et al. Growth in global materials use, GDP and population during the 20th century. Ecol. Eco. 68, 2696–2705 (2009).
National Bureau of Statistics of China. National Data https://data.stats.gov.cn/english/ (1990–2020).
Gao, H. et al. Analysis on the Current Status of Utilization of Crop Straw in China (in Chinese). J. of Huazhong Agric. Univ. 3, 242–247 (2002).
Bi, Y. Straw Resources Evaluation and Utilization in China (in Chinese). (Chinese Academy of Agricultural Sciences, 2010).
Forestry Knowledge Service System of Chinese Academy of Forestry. https://forest.ckcest.cn/sd/si/mczz.html?categoryOne=%E5%85%B6%E4%B8%AD%E4%B8%80%E5%B9%B4%E7%94%9F%E7%89%A7%E8%8D%89%E4%BA%A7%E9%87%8F&categoryTwo=&areaOne=%E5%85%A8%E5%9B%BD (2006–2017).
Ministry of Land and Resources of China. China Land and Resources Statistical Yearbooks (Geology Press, 2000–2018).
U.S. Geological Survey. Commodity Statistics and Information Database. https://www.usgs.gov/centers/national-minerals-information-center/commodity-statistics-and-information (1990–2020).
Ministry of Ecology and Environment of China. China Ecological and Environmental Bulletins. https://www.mee.gov.cn/hjzl/sthjzk/zghjzkgb/ (1989).
Ministry of Ecology and Environment of China. China Ecological and Environmental Statistical Yearbooks. https://www.mee.gov.cn/hjzl/sthjzk/sthjtjnb/ (2000–2020).
European Commission. The Emissions Database for Global Atmospheric Research (EDGAR). https://edgar.jrc.ec.europa.eu/ (1990–2020).
Wang, F. et al. The estimation of the production amount of animal manure and its environmental effect in China (in Chinese). China Environ. Sci. 26, 614–617 (2006).
Bao, W. et al. Value-taking of livestock and poultry excreta factor in China. J. of China Agric. Univ. 23, 1–14 (2018).
Li, X. et al. Solid Waste Engineering (in Chinese) (China Environmental Science Press, 2003).
Ministry of Agriculture and Rural Affairs of China. Nutrient content coefficients of mineral fertilisers used in China. https://www.moa.gov.cn/nybgb/2018/201812/201901/t20190106_6166194.htm (2018).
Ministry of Housing and Urban-Rural Development of China. China Urban Construction Statistical Yearbooks (China Statistics Press, 2006–2020).
Nelles, M. et al. Exploration on recovery and utilisation of biomass components in China’s municipal waste. (The Federal Ministry for the Environment, Nature Conservation, Nuclear Safety and Consumer Protection, 2017).
United Nations. International Trade Statistics Database. https://comtrade.un.org/ (2020).
MAC (Material Cycle and Manufacturing Capital). Improved UN Comtrade Data. Material Cycle Database https://www.macycle.org/improved-un-comtrade-data/ (2022).
Chen, C. et al. Advancing UN Comtrade for Physical Trade Flow Analysis: Review of Data Quality Issues and Solutions. Resour. Conserv. Recy. 186, 106526 (2022).
Jiang, Z. et al. Advancing UN Comtrade for Physical Trade Flow Analysis: Addressing the Issue of Outliers. Resour. Conserv. Recy. 186, 106524 (2022).
Zhang, Z. et al. Advancing UN Comtrade for physical trade flow analysis: Addressing the issue of missing values. Resour. Conserv. Recy. 186, 106525 (2022).
Chen. C. et al. China economy-wide material flow account database from 1990 to 2020. figshare https://doi.org/10.6084/m9.figshare.c.5994589.v1 (2022)
Yu, C. et al. Managing nitrogen to restore water quality in China. Nature 567, 516–520 (2019).
Ministry of Environmental Protection of China & Ministry of Finance of China. The 13th Five-Year Plan for National Integrated Rural Environment Management. https://english.mee.gov.cn/Resources/Plans/Special_Fiveyear_Plan/201902/t20190222_693384.shtml (2016).
Yousefi, M. et al. Municipal solid waste management during COVID-19 pandemic: effects and repercussions. Environ. Sci. Pollut. Res. Int. 28, 32200–32209 (2021).
National Bureau of Statistics of China. China Rural Statistical Yearbooks (China Statistics Press, 1994–2020).
National Forestry and Grassland Administration. China Forestry Statistical Yearbooks (China Forestry Press, 1992–2000).
National Bureau of Statistics of China. China Animal Industry Yearbooks. (China Agriculture Press, 1999–2021).
Acknowledgements
This work is financially supported by the National Natural Science Foundation of China (52170184, 41871204 and 52070034), and the Management Science Project of Jiangxi Province (20212BAA10019).
Author information
Authors and Affiliations
Contributions
C.C. collected and estimated the data, analyzed and visualized data, and prepared the manuscript. J.Q. analyzed data, and drafted and revised the manuscript. N.L. and H.W. conceptualized, advised and managed this study. Y.H. developed the estimation methods and developed the check tool. J.G. revised the manuscript. T.J., X.L., R.H. and J.W. collected the data and checked the consistency. W.-Q.C. advised the project and revised the manuscript.
Corresponding authors
Ethics declarations
Competing interests
The authors declare no competing interests.
Additional information
Publisher’s note Springer Nature remains neutral with regard to jurisdictional claims in published maps and institutional affiliations.
Supplementary information
Rights and permissions
Open Access This article is licensed under a Creative Commons Attribution 4.0 International License, which permits use, sharing, adaptation, distribution and reproduction in any medium or format, as long as you give appropriate credit to the original author(s) and the source, provide a link to the Creative Commons license, and indicate if changes were made. The images or other third party material in this article are included in the article’s Creative Commons license, unless indicated otherwise in a credit line to the material. If material is not included in the article’s Creative Commons license and your intended use is not permitted by statutory regulation or exceeds the permitted use, you will need to obtain permission directly from the copyright holder. To view a copy of this license, visit http://creativecommons.org/licenses/by/4.0/.
About this article

Cite this article
Chen, C., Qi, J., Li, N. et al. China economy-wide material flow account database from 1990 to 2020. Sci Data 9, 502 (2022). https://doi.org/10.1038/s41597-022-01611-z
Received:
Accepted:
Published:
DOI: https://doi.org/10.1038/s41597-022-01611-z
