
Abstract
Urban archives provide rich information on historical data. To a large extent, these data are not available in machine-readable format and therefore not linkable with other datasets. The “Häuser-Kataster der Bundeshauptstadt Wien” is a building schematic for the city of Vienna for the end of the 1920s. While this schematic was used as a knowledge base for real estate and finance business about 100 years ago, it has been used in the 2000s to manually map the historic building periods by property. We use the analog version and produced a machine-readable version to assign the historic addresses, building periods and number of floors to a building stock model down the road. The dataset has been complemented with codes of cadastral communities from the late 2010s to enable geotagging of the historic building data. To avoid unnecessary duplication of efforts by others and to share the dataset with urban historians and the public, we provide the dataset under creative common license.
Measurement(s) | building • Historical Data Type |
Technology Type(s) | digital curation • optical character recognition • regular expression |
Factor Type(s) | district |
Sample Characteristic - Environment | city |
Sample Characteristic - Location | Vienna |
Machine-accessible metadata file describing the reported data: https://doi.org/10.6084/m9.figshare.13378703
Background & Summary
Urban development goes along with the development of schematics to describe and record phenomena in society and the environment. With respect to the built environment in the city of Vienna, about 135 so-called “Häuserschematismen” (in German: building schematics) were published between the 18th and 20th century1. The oldest one was drawn up by the postman Johann Jordan in 17012. The schematic is a detailed description of alleys, squares, buildings and churches in the city of Vienna. Later on, the building schematics show a variety of additional data, as for instance, building numbers, property owners, and the relation to a parish. The latest schematic of its kind, titled “Häuser-Kataster der Bundeshauptstadt Wien”, was published a decade after the end of the Austrian-Hungarian monarchy3. At this time Vienna provided about 50,000 buildings for 1,900,000 inhabitants [c.f4.] as shown in Fig. 1.

Number of buildings and inhabitants in the city of Vienna. The “Häuserschematismen” were published from the 18th to 20th century. The latest one, which is the subject of this data descriptor, was published in the late 1920s. Data sources: Population and building data [c.f. 4], background information on “Häuserschematismen” [c.f. 1].
The special feature of building schematics is that the data are available for each building and property, respectively. This level of detail allows building-specific information to be retrieved through a search by means of the address or property number. Urban historians in the 2000s took advantage of the historical records and mapped the age of buildings by property across the entire city in the year 19205. Unfortunately, neither the building schematic nor the mapping results are available in a machine-readable format – as we were told by Mr. Weigl from the Municipial and Provincial Archives of Vienna (https://www.wien.gv.at/kultur/archiv/). This prevents the reuse of data by urban historians and the public of today.
This data descriptor aims to generate a machine-readable dataset of the latest building schematic, the “Häuser-Kataster der Bundeshauptstadt Wien”. The building schematic was published in a series of ten volumes between 1927 and 1930. The volumes can be retrieved online from the website of Wien Bibliothek im Rathaus3 in portable document format (pdf), with a total file size of 486.77 Megabyte and 1760 pages (Online-only Table 1). We extracted the data entries by volume, political district and cadastral community (Online-only Table 2). The mapping of the cadastral communities shows the geographical coverage of the dataset in view of the city boundaries at that time (Fig. 2). The plausibilization of building counts by urban district, detailed in the technical validation section, shows that building schematic covers the entire city and its author Wolfgang J. Salzberg likely strived to record all buildings at this time.

Viennese city map with the spatial coverage of data entries.
The methodology section documents the generation of the digital building schematic. Initially, we used optical character recognition to convert the pdf into an xlsx file format, replaced or realigned misinterpreted characters, and added data fields to enable crosschecks with the analog building schematic and improve data usability. The data record section presents the machine-readable dataset with 42,861 data entries (rows) and 12 data fields (columns). Eight data fields originate from the analog building schematic (urban district number, street name, building number, building position, property area, number of floors, year of construction, year of purchase). Three data fields originate from additional data sources to improve data processing and usability (cadastral community in 2010s, street name in 2010s, pdf page number of the analog building schematic). One data field includes a unique number (identification number) for each data entry.
The technical validation section is divided into an internal and an external validation part. The internal validation relies on the analysis of the dataset itself and proofs data consistency. The external validation uses external information to verify data completeness, plausibility and interpretation.
The dataset is useful for a variety of needs in the field of urban history research. The dataset is accessible to queries and allows the generation of data subsets for user investigation. For instance, filtering buildings by construction period and urban district. Another example is setting a filter to receive the period between the year of construction and year of purchase for a specific building, delivering insights into economic phenomena. The dataset is also an initial point for grouping and mapping data records by cadastral communities. The dataset has a creative commons license and can be reused by others.
Methods
This section gives an overview of the workflow and includes subsections for data input, processing and output.
Overview
The methodology consists of four major parts, as visualized in Fig. 3 and corresponding with the subheading of the methods section. First, the collection and description of input data sources as well as details regarding their accessibility. Second, the processing of input data, including the definition of quality criteria and the semi-automated correction of data as well as the addition of supplementary data fields to improve usability. Third, the presentation of the key data output (digital building schematic). Fourth, the internal validation of generated data to assess technical plausibility and the external validation to test whether a historically accurate representation in the late 1920s is given.

Workflow diagram including the four main parts data input, processing, output and validation.
Data input
The workflow uses 15 distinctive data sources (Table 1), of which one is the analog building schematic3 and the 14 others are needed to improve and validate the data of the digital building schematic. All 15 input data sources are publicly accessible, of which 11 can be retrieved online3,6,7,8,9,10,11,12,13,14,–15, 3 require a personal order by phone or e-mail16,17,18 and 1 a personal inspection in the archive of the building authority19.
Data processing
The data processing includes three key steps: Converting data from PDF to XLSX format, improving data quality, and adding supplementary data.
1st step: Converting PDF to XLSX files
To convert the 10 volumes from PDF to XLSX file format, we selected all relevant pages from each volume (c.f. Online-only Table 2) and applied the optical character recognition (OCR) features of the ABBYY FineReader software (https://www.abbyy.com/en-eu/finereader/). The software tool allows grids to be defined in order to extract the data records row- and column-wise. The generated dataset [20, Input dataset v1.zip], which is exemplified in Fig. 4, includes a data structure, data formats and misinterpreted data records that require revisions to obtain a validated and machine-readable version of the building schematic.

2nd step: Improving data quality
As an initial step, we manually edited the 21 XLSX files [20, Input dataset v1.zip] to make them machine-readable. We identified inconsistencies regarding the column structure within and between the files and consolidated the structure. We then reviewed the column STR.1920s, removed characters that indicate “see above” and corrected apparently wrong names (see Fig. 4). Finally, the 21 XLSX files have been merged and converted into a single XLSX file [20, Input dataset v2.xlsx]. This file includes 42,907 entries (rows) and 7 data fields (columns) as showcased in Fig. 4. The file is the starting point for the systematic quality improvement.
The systematic quality improvement has been implemented with Python (https://www.python.org/) and R (https://www.r-project.org/). It performs three key tasks, as shown in Fig. 3 and described in the following text section.
-
1.
Defining initial quality criteria. We defined quality criteria for each data field and categorized the criteria into “patterns” and “conditions” (Table 2). The criteria validate the data records based on their plausibility of correctness. We assume that data records not meeting the criteria are incorrectly transferred and need revision. The criteria are a systematic way of identifying irregularities in the character recognition.
Table 2 Initial quality criteria to assess data classes by data field. -
2.
Determining if data records fulfill quality criteria. We applied three tasks. First, we unified the format of data records by, for instance, removing space and special characters. Second, we retrieved the unique entries per data field (data classes) through text pattern screening and flagged those which do not meet the quality criteria from Table 2. Third, we created a subset of data entries that include only the flagged and therefore flawed data records.
-
3.
Correcting data records. The flawed data records have been used as a starting point to correct misplaced characters. The procedure for “STR.1920s” differs from the data fields BN.1920s, POS.1920s, AREA.1920s, FLOORS.1920s, YoC.1920s and YoP.1920s as follows.
3.1. Data field “STR.1920s”
The OCR misinterpreted the spelling of STR.1920s names to a wide extent. The criteria that guided and terminated the quality improvement are defined by the correct spelling of the names in STR.1920s (Table 2).
In a nutshell, we applied a semi-automated procedure for detecting and correcting misspelled names and verified the correct spelling either with today’s street names9, historical names that have been changed or removed from the official street registry between the 1920s and 2010s10, or by manual cross-checking with the names in the analog building schematic3. Due to the broad range of error detecting text patterns, the entire procedure has been iterative, including multiple runs of detecting, correcting and matching names. It is noted that instead of reporting the effects of each individual correction step, we provide quantitative measures of change at two other points in the manuscript. First, the internal validation section presents counts on the unique names before and after quality improvements (Fig. 5). The waterfall chart shows that each data entry has been modified. Second, the external validation section includes a data plausibility subsection that presents the number of data records by data source for verifying the spelling.

Counts of unique data records by data field before and after the data quality improvements. Sub-parts a-f refer to the data fields “STR.1920s”, “BN.1920s”, “POS.1920s”, “FLOORS.1920s”, “YoC.1920s” and “YoP.1920s”.
In detail, we carried out the following tasks.
-
1.
The analog building schematic includes characters that signify a reference to the last above-mentioned street name (Fig. 4a). The OCR converted these characters into various distinctive strings. However, these strings have a maximum of six positions, while today’s street names9 have more than six positions. This error has been corrected by removing all strings with less than six positions.
-
2.
The next text pattern addresses the end of the names, which stands for the typology of the traffic area. The typology includes either the word “straße” (street), “gasse” (alley) or “platz” (square). To identify various forms of potential errors, a search for frequently appearing text patterns was used. The text patterns are used for a text screening of data records in STR.1920s. Entries that match a given text pattern are returned as an output. This output was manually reviewed to ensure a correct identification of errors. If a text pattern is sufficiently specific and therefore matches only legitimately classified errors but no other unrelated entries, it is used for a systematic corrective procedure. This procedure again identifies all matching entries for an error pattern in STR.1920s and automatically corrects the entry.
Another phenomenon in the translated strings is the abbreviated form of typology names. Examples include “str.” for “straße”, “g.” for “gasse” or “pl.” for “platz”. While not being an actual error, these abbreviations were systematically converted into their complete word form. This step was necessary to ensure comparability with the validation sources, which list the full street names.
-
3.
To make the comparison between STR.1920s and validation sources9,10 more effective, all street names across these sources were converted into a unified format. First, the names were converted to lower case writing. Second, frequently appearing symbols that are not letters of the alphabet or language -dependent special characters were eliminated. Examples of non-phonetic street name characters are the hyphen character or the “whitespace” character.
-
4.
After tasks 1–3, we matched the names with today’s street names9. Names with a successful match are spelled correctly, therefore the quality improvement procedure was terminated. Names without a match remain without a verified spelling. These names either include characters that have been misplaced or misinterpreted by OCR, or the street name has been changed between the 1920s and the 2010s, or the name stands for a building or geographical area without specifying the exact location.
-
5.
The names without a match have been passed on to a two-stage algorithm. In both stages, characters in the street name are replaced with encoded text patterns. If one or two characters are wrong in the street name, the first stage of the algorithm can match the name to the list of today’s street names9 by replacing these characters with a text pattern that basically means “any character”. The second stage of the algorithm replaces the ending part of the unidentified street name with a pattern that signifies “any number of any characters”. In this way the beginning part of an unidentified street name may be matched to a current street name with the same beginning part. It is inherent to the methodology that both stages of the algorithm may yield more than one name match with today’s street names. If the first stage yields a result that has only a single match in today’s street names, the correct spelling is confirmed and the name is not passed on to the second stage. By analogy, a result with a single match in the second stage confirms the correct spelling. If the algorithm finds several possible options, but no result that matches exactly one entry in the list of today’s street names, the result with the minimum number of possible matches below ten matches is returned as the final result. These resulting names were the starting to point to manually correct the respective initial names.
-
6.
To verify the spelling of names that have been changed between the 1920s and the 2010s, the list of names without a match in today’s list of street names was compared to a list of historic street names extracted from “Wien Geschichte Wiki”10 via a web scraping procedure. The same two-stage algorithm as mentioned in the previous point was used for name matching.
3.2. Data fields “BN.1920s”, “POS.1920s”, “AREA.1920s”, “FLOORS.1920s”, “YoC.1920s” and “YoP.1920s”
The flagged data entries from key task 2 were the starting point to retrieve the correct spelling from the analog building schematic3. Correcting the data records in the digital building schematic was executed either manually or automated by using regular expressions (REGEX). It is noted that the corrections followed an iterative procedure. The first run identified and corrected parts of all errors, and subsequent runs completed the correction of remaining errors or any that had potentially been created during previous runs. It is also noted that the correction of data records established new data classes that potentially do not meet the quality criteria as defined in Table 2. This is inherent to the methodology because the criteria were defined at the beginning of the correction process and merely indicate the possibility of correctness. As the new data classes were introduced after evidence-based correction, we excluded them from the criteria guided assessment.
To measure the extent of change before and after quality improvement, we compared the counts of unique data records per data field (data classes) between the input data [20, Input dataset v2.xlsx] and the final digital building schematic [20, dataset.csv]. The results of the comparative analysis are presented in Fig. 5, including the net counts, removals and additions of data classes.
3rd step: Adding supplementary data
To improve data processing, usability and validation, we added the five data fields as follows.
-
Data field “ID”: In practice, a single property can have more than one building and therefore more than one building number. These cases are addressed in the analog building schematic in two ways: either by listing building numbers, separated by a comma (“,”) in a single row or by listing building numbers in multiple rows and making a bracket to the right. To improve the usability of the digital building schematic, we unfolded the respective entries and created an entry per building number. After the unfolding procedure, each entry was assigned a unique identification number “ID”. The IDs are numbered consecutively. The unfolded entries end with an underline and an additional index, as for instance “78_0” and “78_1”. The digital building schematic has 42,861 entries in total (100%), of which 39,837 (92.94%) have not been unfolded and 3,024 entries (7.06%) have been unfolded.
-
Data field “UD.1920s”: The outcome of step 1 are 21 XLSX files, one per urban district. We assigned the urban district number to the data entries in the digital building schematic.
-
Data field “CC.2010s”: Cadastral communities are geographical administrative units. The basis for today’s surveying was established in connection with the tax regulation on land and buildings in 1817. The borders of cadastral communities might not coincide with governmental units such as cities, but remain fixed, even if borders of governmental units change [c.f 21.]. The analog building schematic uses the cadastral communities to structure the data records, which can be seen in the table of contents in each of the ten volumes. Online-only Table 2 demonstrates the relation between volumes, urban districts and cadastral communities. To add “CC.2010s” to the digital building schematic, we followed three major steps.
-
1.
Since the 1920s, precisely in the year 1968, two names have changed: “Untermeidling” and “Obermeidling”22. Both are located in the 12th urban district and mapped in the “Catastral-Plan der Reichshaupt- und Residenzstadt”14. They have been merged and renamed to “Meidling” (cadastral community number: 01305). The CC.2010s data field considers these name changes.
-
2.
We added the cadastral community number from Online-only Table 2 to each entry in the digital building schematic. In detail, we used the urban district number (UD.1920s) and the page number (Page.pdf) from the digital building schematic and selected the cadastral community (cadastral.number.2010s) based on the urban district number (“UD.1920s”) and the page range (from “PDF.page.start” to “PDF.page.end”) from Online-only Table 2.
-
3.
We corrected CC.2010s records of the cadastral community “Leopoldstadt”, because the area of “Leopoldstadt” was divided into “Leopoldstadt” and “Kaisermühlen” in 195822. So, the analog building schematic has assigned STR.1920s names to “Leopoldstadt”, which today belong to “Kaisermühlen”. To correct the data, we spatially merged the address register9 and the administrative borders11 to pick today’s street names in the cadastral community “Kaisermühlen”. This set of names was merged with the STR.2010s names in the 2nd urban district of the digital building schematic. The merging resulted in 12 street name matches and 135 corresponding data entries, which obtained the cadastral community number of “Kaisermühlen”.
-
1.
-
Data field “STR.2010s”: The names result from the quality improvement procedure, as described in step 2: data quality improvements – “STR.1920s”. The data field “STR.2010s” includes 42,861 (100%) data entries, of which 40,489 (94.47%) have remained unchanged since the 1920s, 1,985 (4.63%) have been renamed, and 387 (0.90%) do not have a counterpart from the 1920s.
-
Data field “Page.pdf”: We manually assigned the pdf page number to each data entry.
Data outputs
The final output - the digital building schematic - includes 12 data fields (Table 3). Eight data fields from the analog building schematic, briefly called original data (OD), and four data fields that have been supplemented (SD). The suffixes “.1920s” and “.2010s” indicate data records in the late 1920s and late 2010s, respectively.
Data Records
The Zenodo platform includes a data repository in zip-format20 with the machine-readable, digital building schematic (filename = Dataset.csv) as well as the preceding versions with the results from automated text recognition of the analog building schematic (filename = Input dataset v1.zip) and the results for the manual editing (filename = Input dataset v2.xlsx). The digital building schematic has 42’861 entries (rows) and 12 fields (columns). The Zenodo repository also comes with a codebook. The codebook specifies the dataset format and fields. Each field is commented on in order to facilitate the usage of data.
Technical Validation
The validation section is divided into an internal and an external validation part. The internal validation focuses on the assessment of data classes and categories, respectively. The external validation uses information sources, independent from the building schematic, to proof the conformity of the data records with reality in the late 1920s.
Internal validation
The internal validation is based on grouping and summarizing the data records in the digital building schematic. The data records of 11 data fields are firstly grouped by “UD.1920s” and secondly grouped by one of the following characteristics (Figs. 6, 7b–d, 8).
-
They are grouped either by data field specific data classes (“POS.1920s”, “FLOORS.1920s”), or
-
by the volume of the respective volume of the analog building schematic (“UD.1920s”, CC.1920s”, “Page.pdf”), or
-
by a specific text pattern (“ID”, “BN.1920s”, “YoC.1920s”, “YoP.1920s”), or
-
by the dataset that was used to verify the names (“STR.1920s”, “STR.2010s”), or
-
by known and unknown data records (“AREA.1920s”).

Counts of data records by category for the data fields: “ID”, “STR.1920s”, “STR.2010s” and “UD.1920s”.

Counts of data records by category for the data fields: “CC.1920s”, “BN.1920s”, “AREA.1920s” and “POS.1920s”.

Counts of data records by category for the data fields: “FLOORS.1920s”, “YoC.1920s”, “YoP.1920s” and “Page.pdf”.
The data records 12th data field “CC.2010s” are merged with Online-only Table 2 and grouped by the volume of the analog building schematic (Fig. 7a).
The data grouping reveals two things. First, the sum of all counts per plot – except for “Page.pdf” - matches the total number of data entries (42,861). The “Page.pdf” plot follows another logic because it sums the unique page numbers by urban district. These counts match the counts calculated from “PDF.page.end” minus “PDF.page.start” plus 1 (Online-only Table 2). Second, the completeness of the counts validates that each data record has been assigned to a defined group. Conversely, this means that not a single data record is beyond the defined groups and therefore beyond quality-proven text patterns.
External Validation
The external validation tests datasets for consistency with other sources. We use the validation categories “data completeness”, “data plausibility” and “data interpretation”, defining 11 criteria in total for validation purposes (Table 4). Each criterion is based on an external source of information distinct from the analog building schematic. No external sources have been available to validate the categories “YoC.1920s” and “YoP.1920s”.
Data completeness
The guiding question for validating the completeness is whether the building schematic covers only a sample of buildings or all of the buildings in the city. We validated the building schematic’s coverage in a geographic dimension and by building counts as follows:
-
Geographic coverage: We have mapped all cadastral communities that refer to Vienna in 2020 and highlighted those which are listed in the building schematic (Fig. 2). Additionally, we mapped the city boundary before 1938, which was in essence legally effective at the end of the 1920s as well. At this time the city covered 71 cadastral communities, of which 66 are listed in the analog building schematic (Online-only Table 2). The remaining five might have been excluded from the analog building schematic because of their irrelevance for the readers at this time. In detail, the cadastral community “Schönbrunn” includes the palace of the same name only. The remaining four are largely devoid of buildings - less than 20 buildings in total - as we learned from viewing the historical cadastral maps17.
-
Number of buildings: The dataset includes 42,861 entries, but the number of buildings is defined by data entries with given building numbers. In this sense, the dataset covers 42,112 buildings (period 1927–1930) and the latest available census at this time (7 March, 1923) reports 43,910 buildings8. The comparative analysis of building counts is given in Fig. 9. On an urban district level, there is a negative relation between the two data sources in 8 out of 21 urban districts (minus 2’468 buildings in total) and a positive relation in 13 out of 21 districts (plus 670 buildings in total). It is noted that we found only indirect indications of the differences, but no explicit data on the number of constructed and demolished buildings between 1923 and 1927–30. The differences might be because of minor changes in the district boundaries23, data gaps due the destruction of land registers during the 1927 fire in the law court [3, volume I], or due to urban development between the two moments of data collection (7 March, 1923 versus 1927–30). Despite the unknowns with regard to the differences, we assume that the building schematic intended to capture all buildings at this time and recognize that some buildings might be missing – especially in urban districts 2, 3, 11, 12 and 21.

Data plausibility
-
Data field “UD.1920s”: The plausibility criteria compares the unique integer IDs of “UD.1920s” in the dataset and the number of districts as given in the Viennese statistical yearbook in 19298. The numbers range from 1 to 21, which represents the number of districts in the late 1920s.
-
Data field “CC.2010s”: The plausibility criteria matches the cadastral community number between the dataset and the cadastral community register, published by the Federal Office of Metrology and Surveying11. Each spelling of each number has been confirmed, which allows the data records to be mapped on the cadastral community level.
-
Data field “STR.2010s”: The data field includes 2,691 (100%) unique names for streets, alleys and squares. We plausibilized the names with today’s Viennese address register9. The comparative text analysis resulted in 2,689 (99.93%) matches. The remaining two (0.07%) names represent streets. To validate the remaining two names, we used the query function of the online city map12 and found a match for each of the names. In conclusion, all names exist and their spelling is correct.
-
Data field “STR.1920s”: To validate the 1920s names for streets, alleys and squares, we used all 42,861 (100%) data entries and selected “STR.1920s” and “STR.2010s”. The comparative text analysis shows 40,602 (94.73%) data entries match between “STR.1920s” and “STR.2010”. As “STR.2010s” name spelling was already confirmed (see previous point), there was no need to validate these data records further. Nevertheless, 2,259 data entries (5.27%) remain for validation. We validated the non-matches and defined four distinctive cases. The four cases depend on the presence of name in STR.2010s and on the external validation source for the remaining names in STR.1920s and STR.2010s (Online-only Table 3). With respect to the 2,259 non-matches, 1’633 (3.88%) STR.1920s names were verified with Vienna History Wiki10 or by manual cross-checking the analog building schematic3, and 596 (1.39%) STR.1920s names were verified with today’s address register9.
-
Data field “FLOORS.1920s”: We used a building-specific and a city-wide approach to assess plausibility.
-
The building-specific approach randomly selected 25 buildings from today’s building stock that were already present in the 1920s13 and compared the floor numbers between the digital building schematic and two external data sources. One source of information are the original construction plans19. Another source of information is google street view6. The construction plans are archived by the building authority and validate the number of floors at each point in time between the year of construction and today. Google street view offers street-side images of building fronts and, consequently, the visual counting of today’s floor numbers is possible. Retrieving floor data from these two information sources is time consuming, therefore we limited the sample to 25 buildings. The compilation of floor numbers from the digital building schematic, the construction plans and google street view is given in Online-only Table 4. It shows that all floor counts from the digital building schematic were verified by the construction plans. In conclusion, the floor counts represent the situation in the late 1920s. The comparison with google street view reveals that 23 buildings have the same floor number in the 1920s and 2010s. Two buildings have non-matching floor counts. These two non-matches can be explained by the addition of new storeys on top of the existing building.
-
The city-wide approach relies on building counts by floor number. With respect to the 1920s, the latest dataset that we discovered was published in the statistical yearbook of 19147. The comparative analysis of the yearbook and the building schematic data are presented in Fig. 10. The total number of buildings is 41,240 in the yearbook and 42,112 in the building schematic, which might be explained by a net addition of buildings between 1914 and 1927–30. Nevertheless, larger differences are observed in terms of building counts by floor number. It is noted that we cannot provide data-driven evidence for the differences because explicit data on the number of constructed and demolished buildings per floor count between 1914 and 1927–30 are, at least to our knowledge, not available. Hence, we provide qualitative reasons to explain the differences as follows.
-
For buildings with a ground floor only, the comparative analysis fails because the building schematic does not allow these types of buildings to be identified. The data field “FLOORS.1920s” has 9,066 blank records, which stand for unknown floor numbers. The unknowns include ground floor only buildings as well as multi-storey buildings. Details on the interpretation of unknown records are given in the “data interpretation” paragraph at the end of the manuscript.
-
For the floor numbers one to four, the differences are less than 8% in each category. The decrease of buildings with one and two floors might be driven by demolitions and replacements with three-floor structures. But, it is also very likely that the building counts are simply underestimated due to the fact that 9,066 (22%) of all buildings lack of a floor number in the building schematic.
-
For buildings with five or more floors, the comparative analysis fails because the building schematic systematically lacks assignments with five or more floors. As a matter of fact, the regulation in the late 1920s accepted such buildings in the inner city only [24, Tafel VII], which also explains the 94% rate of buildings with five or more floors in the inner districts 1 to 97. The inner city in the late 1920s was the hotspot for public administration, culture, businesses and religious communities. Associated buildings tend not to be available for the private property market, which might be the reason why the author of the analog building schematic found it useless to assign floor numbers. An indication of this phenomenon is given in the “data interpretation” paragraph at the end of the manuscript.
Fig. 10 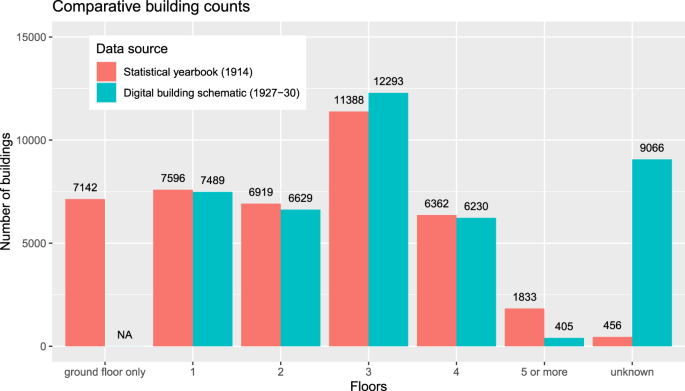
Number of buildings by floor counts. Notes: “NA” = not available, because the analog building schematic does not record “ground floor only” buildings; “unknown” = The yearbook uses the word “unknown” to summarize the buildings of unknown floor numbers. The digital building schematic uses blank records if the data are not provided and therefore labels this absence with a hyphen (“-“) in the analog building schematic. Data sources: Statistical yearbook (1914)7, Digital building schematic (1927–30)20.
-
-
-
Data field “BN.1920s” and “POS.1920s”. We used historical city maps of 1921 and 193316,18 to validate a limited set of building numbers and positions. In detail, we selected 25 buildings in the 18th urban district (Online-only Table 4) and manually retrieved the data from the map scans (TIF format). As this process is quite time consuming, we limited the sample size to 25 buildings only and note that the procedure does not allow general statements. With respect to the 25 buildings, the validation resulted in a match for each building per address and only one non-match for the building position. We conclude that the BN.1920s are correct and the POS.1920s records, as given in the analog building schematic, might be erroneous and do not fully represent the situation in the 1920s. It is noted that a more time-efficient validation that encompasses all data records would require a city-wide geospatial dataset on building footprints and addresses of the late 1920s. As such a dataset was not available at the time of our research, we were not able to cover all BN.1920s and POS.1920s records.

Data interpretation
The analog building schematic does not provide definitions for the data fields. As the fields “UD.1920s”, “STR.1920s”, “BN.1920s”, “POS.1920s”, “YoC.1920s”, “YoP.1920s” are self-explaining, the “AREA.1920s” and “FLOORS.1920” allow multiple interpretations. To get evidence for a sound interpretation, we randomly selected data records and used external datasets as follows.
-
Data field “AREA.1920s”. We randomly picked three buildings from the historic 17th urban district and retrieved the area data from the digital building schematic, on the one hand, and from the land register on 26 Aug, 202015, on the other. The area data from the building schematic exactly matches the property area data from the land register (Table 5). In conclusion, the data represent the property area in square meters and not the building footprint.
-
Data field “FLOORS.1920s”: The data field “FLOORS.1920s” includes either an integer between 1 and 6 or a blank record, which corresponds with a hyphen (“-“) in the analog building schematic. Taking only the 42,112 (100%) data entries with building numbers “BN.1920s” into account shows that 33,046 (78%) entries have an integer floor number and 9,066 (22%) have blank records. On the one hand, the analog building schematic neither defines the floor accounting system nor provides any notes on the interpretation of the records. On the other hand, buildings vary in the vertical arrangement of floors. For instance, buildings could have a floor on ground level, a mezzanine with or without a lower basement and upper floors. Hence, the practical meaning of the data records remains unclear. To eliminate ambiguous interpretations, we used the building age map13 and randomly selected 50 buildings from the 1st and 18th districts, which were constructed before 1918 (Online-only Table 4).
-
For the 25 buildings in the 1st urban district, we manually retrieved the information on the number of floors from the analog building schematic and google street view6. In 25 out of 25 cases, the floor numbers range between 1 and 6. In other words, the blank records do not indicate a specific floor number. Next, we learned from the analog building schematic (data field: “owner”) that 23 out of the 25 buildings were owned by the federal state, religious communities, the community of Vienna or collectives. These buildings tended not to be available for the private property market and potentially that’s why the number of floors was not recorded.
-
For the 25 buildings in the 18th urban district, we manually retrieved the information on the number of floors from the analog building schematic, original construction plans19 and google street view6. Each building from the building schematic has one floor less than documented in the construction plans. With respect to google street view, 23 out of 25 buildings have one floor less. The remaining 2 buildings have a difference of 2 and 3 floors, respectively, which is due to the addition of floors between the 1920s and today, as documented in the construction plans. Based on this analysis we conclude that the blank records stand for a single floor on the ground, and the integers 1 to 6 stand for the number of floors above the ground floor.
-
In conclusion, the meaning of blank records is ambiguous and the data records are considered to be unknown unless additional efforts are undertaken to replace them by evidence-based data from historical construction plans. The integer floor numbers represent the floors above a ground floor and mezzanine with a lower base floor, respectively. As a consequence, the number of buildings with just a ground floor (with or without a lower subbase) cannot be retrieved from the digital building schematic.
Usage Notes
The Codebook (https://github.com/ukral/building.schematic/blob/master/Codebook/Codebook.md) specifies the dataset format and comments on the data fields. It helps users to process and interpret the data records.
The data records can be mapped by cadastral community as followed. First, users have to import the digital building schematic20 and the geospatial dataset “Verwaltungsgrenzen (VGD) - Stichtagsdaten Wien”11 to geospatial data processing software (e.g. QGIS, ArcGIS). Second, users have to join the two datasets by data field “CC.2010s”20 and “KG_NR”11. Further instructions for joining dataset are provided by respective software distributers.
Code availability
With respect to the technical validation section, we provide the code to reproduce the Figs. 6–8. The code was created with R Studio (https://rstudio.com/) based on R Project for Statistical Computing (https://www.r-project.org/). The code file “Technical_validation.Rmd” as well as the corresponding input data are available on Zenodo20.
References
Wien Geschichte Wiki - Contributer. Häuserschematismen. City of Vienna https://www.geschichtewiki.wien.gv.at/index.php?title=H%C3%A4userschematismen&oldid=388588 (2020).
Jordan, J. Schatz, Schutz und Schantz deß Ertz-Hertzogtumbs Oesterreich: das ist ein sehr genaue und ordentliche Beschreibung aller Gassen, Plätz, Palläst, Häuser und Kirchen der berühmten Haubt- und Kayserl. Residenz-Statt Wienn. Johann von Ghelen https://permalink.obvsg.at/wbr/AC06581903 (1701).
Salzberg, J. W. Häuser-Kataster der Bundeshauptstadt Wien. Moritz Perles https://permalink.obvsg.at/wbr/AC07637508 (1927-30).
Wien Geschichte Wiki - Contributer. Bevölkerung. City of Vienna https://www.geschichtewiki.wien.gv.at/index.php?title=Bev%C3%B6lkerung&oldid=416102 (2020).
Wien Geschichte Wiki - Contributer. Baualter 1920. City of Vienna https://www.geschichtewiki.wien.gv.at/index.php?title=Baualter_1920&oldid=225576 (2017).
Street view - Contributer. Google maps and street view, location Vienna. Alphabet https://goo.gl/maps/FCdvs11z4BjjmAm86 (2020).
City of Vienna. Statistisches Jahrbuch der Stadt Wien. Bd. 1914. City of Vienna https://www.digital.wienbibliothek.at/wbrobv/periodical/titleinfo/2057276 (1914).
City of Vienna. Statistisches Jahrbuch der Stadt Wien. Bd. 1929 (1. Jahrgang). Wienbibliothek im Rathaus https://www.digital.wienbibliothek.at/wbrobv/periodical/titleinfo/2057276 (1929).
City of Vienna. Adressen Standorte Wien. Open Data Österreich https://www.data.gv.at (2019).
Wien Geschichte Wiki - Contributer. Wien Geschichte Wiki. City of Vienna www.geschichtewiki.wien.gv.at (2020).
Federal Office of Metrology and Surveying. Verwaltungsgrenzen (VGD) - Stichtagsdaten Wien. Open Data Österreich https://www.data.gv.at (2020).
City of Vienna. Online city map Vienna. City of Vienna https://www.wien.gv.at/Stadtplan/ (2020).
City of Vienna. Bauperioden und Bautypologien Wien. Open Data Österreich https://www.data.gv.at (2018).
Prohaska, E. Catastral-Plan der Reichshaupt- und Residenzstadt Wien. Kaiserlich und Königliches militärgeographisches Institut http://data.onb.ac.at/rep/100B815B (1893).
Republik Österreich. Land register. Wiener Zeitung Digitale Publikationen GmbH https://auszug.at/ (2020).
Planning office of the Viennese fire brigade. Historischer Feuerwehrplan. Federal Office of Metrology and Surveying https://www.bev.gv.at (1920-1939).
Cartographers (anonymous). Fortführungsmappen des historischen Katasters. Federal Office of Metrology and Surveying https://www.bev.gv.at (1910-30).
Cartographers (anonymous). Bezirkspläne (Akt 3.2.2.P10/2.119833). Municipal and Provincial Archives of Vienna https://www.wien.gv.at/kultur/archiv (1921).
Various planners. Bewilligte Baupläne im Archiv der Baubehörde. City of Vienna https://www.wien.gv.at/wohnen/baupolizei (1800–2020).
Kral, U., Reimer, F., Tuz, H., & Hengl, I. Building schematic of Vienna in the late 1920s (Dataset and Codebook). Zenodo https://doi.org/10.5281/zenodo.4106173 (2020).
Wien Geschichte Wiki - Contributer. Katastralgemeinde. City of Vienna https://www.geschichtewiki.wien.gv.at/index.php?title=Katastralgemeinde&oldid=428757 (2020).
Niegl, R. Personal communication on historical administrative boundaries in the city of Vienna. (Federal Office of Metrology and Surveying, 2020).
Wien Geschichte Wiki - Contributer. Bezirke. City of Vienna https://www.geschichtewiki.wien.gv.at/index.php?title=Bezirke&oldid=418324 (2020).
Kortz, P. Wien am Anfang des XX. Jahrhunderts: ein Führer in technischer und künstlerischer Richtung. 1 - Charakteristik und Entwicklung der Stadt. Ingenieurbauten. (Gerlach & Wiedling, 1905).
Acknowledgements
We cordially thank Andrew Clarke for proofreading, Robert Niegl for providing historical information on cadastral communities in Vienna, Emre Sönmez for supporting the development of the geospatial layer ‘city limits 1920s’, Christa Bay for scanning historical maps, the Federal Office of Metrology and Surveying for providing historical cadastral map sheets and fire brigade maps, the Viennese building authority for providing historical construction plans, the Austrian Science Fund (FWF): I 3148-G29 for financing the project Mining the Urban Building Stock (MUBS), and the Austrian Research Promotion Agency (FFG) for providing a scholarship (Grant Number 870384).
Author information
Authors and Affiliations
Contributions
Ferdinand Reimer and Ulrich Kral designed the research, improved the data quality, validated the data and have written the data descriptor. Inge Hengl and Havvanur Tuz used the FineReader software to convert the 10 volumes from PDF format into the first draft machine-readable dataset.
Corresponding author
Ethics declarations
Competing interests
The authors declare no competing interests.
Additional information
Publisher’s note Springer Nature remains neutral with regard to jurisdictional claims in published maps and institutional affiliations.
Online-only Tables
Rights and permissions
Open Access This article is licensed under a Creative Commons Attribution 4.0 International License, which permits use, sharing, adaptation, distribution and reproduction in any medium or format, as long as you give appropriate credit to the original author(s) and the source, provide a link to the Creative Commons license, and indicate if changes were made. The images or other third party material in this article are included in the article’s Creative Commons license, unless indicated otherwise in a credit line to the material. If material is not included in the article’s Creative Commons license and your intended use is not permitted by statutory regulation or exceeds the permitted use, you will need to obtain permission directly from the copyright holder. To view a copy of this license, visit http://creativecommons.org/licenses/by/4.0/.
The Creative Commons Public Domain Dedication waiver http://creativecommons.org/publicdomain/zero/1.0/ applies to the metadata files associated with this article.
About this article

Cite this article
Kral, U., Reimer, F., Tuz, H. et al. Building schematic of Vienna in the late 1920s. Sci Data 8, 44 (2021). https://doi.org/10.1038/s41597-021-00822-0
Received:
Accepted:
Published:
DOI: https://doi.org/10.1038/s41597-021-00822-0
