
Abstract
A synthesis of phenotypic and quantitative genomic traits is provided for bacteria and archaea, in the form of a scripted, reproducible workflow that standardizes and merges 26 sources. The resulting unified dataset covers 14 phenotypic traits, 5 quantitative genomic traits, and 4 environmental characteristics for approximately 170,000 strain-level and 15,000 species-aggregated records. It spans all habitats including soils, marine and fresh waters and sediments, host-associated and thermal. Trait data can find use in clarifying major dimensions of ecological strategy variation across species. They can also be used in conjunction with species and abundance sampling to characterize trait mixtures in communities and responses of traits along environmental gradients.
Measurement(s) | Trait • phenotypic trait • quantitative genomic trait |
Technology Type(s) | digital curation |
Factor Type(s) | habitat • species |
Sample Characteristic - Organism | Archaea • Bacteria |
Sample Characteristic - Location | global |
Machine-accessible metadata file describing the reported data: https://doi.org/10.6084/m9.figshare.12221732
Background & Summary
Several research groups have advocated for a trait-based approach to ecology of bacteria and archaea1,2,3,4,5,6,7,8,9, but so far this has remained at the level of conceptual discussion or interpretation of particular study systems. Here we describe a scripted workflow that generates a unified microbial trait dataset suitable for investigating which traits are correlated across species versus which vary independently. The dataset spans the full range of bacterial and archaeal habitats, including fresh and marine waters, soils and sediments, animal and plant hosts, and thermal environments. Data sources include well-established repositories, such as GenBank10, Bergey’s Manual of Systematics of Archaea and Bacteria11, and a number of compilations published in the literature (Online-only Table 1).
We believe this data product will prove useful to other research groups in several ways. Some may use the current version of the dataset for their own data analyses. They may adjust the scripted workflow to adopt different merger rules; for example, about how data sources are aggregated or prioritized when multiple records are available. Some may choose to update the dataset, since among the contributing data sources several are continuing to receive new data. Some may choose to add further data sources or merge their own data sources, which should be made easier by the scripted structure we provide. Once scripted into the workflow, new or updated data sources can be merged with the current data product in GitHub resulting in a new version of the data product.
Trait data can have a variety of research purposes. Correlations among traits can be investigated to elucidate the main dimensions of variation across species12. Species lists and their abundances in communities can be interpreted, for example whether communities have similar trait mixtures despite different taxonomy. Responses of traits along environmental or geographical gradients can be described13. If relevant traits are available to combine with species identifications and abundances, aspects of ecosystem function can be inferred.
Synthesizing trait data is a continuing process rather than a finite project. During the time taken to add any particular data source to the merger, new data sources continue to appear. The data merger in its current form and as reported here emphasizes quantitative genomic traits (such as genome size and number of rRNA gene copies) and phenotypic traits (such as potential rate of increase, cell radial diameter and growth temperature).
We have included information from culture on metabolic pathways and carbon substrates. However, we have not yet included metabolic pathways inferred from genomes, and consequently the question of reconciling genome-inferred pathways with culture-observed pathways does not arise. Also we have not yet included presence or absence of specific genes as qualitative traits, for a combination of reasons. First, there are potentially a very large number of such traits. Second, the number of complete genomes available continues to increase rapidly, and so such data will be out of date quickly. Third, there exist a number of databases (MIST14, MACADAM15, ANNOTREE16 for example, and more emerging all the time) that specialize in annotations from genomes. When users wish to ask questions involving these genome-derived traits it will be better for them to link those databases to ours, which can be done using NCBI Taxon IDs.
Methods
The scripted workflow was developed to reproducibly (a) prepare datasets to be merged; (b) combine datasets; (c) condense similar or the same traits into columns; and (d) condense rows into species based on either the NCBI taxonomy17 or the Genomic Taxonomy Database (GTDB) taxonomy18 (Fig. 1, Online-only Table 1). This workflow generated five data products17 for the 23 phenotypic, genomic and environmental traits shown in Online-only Table 2. The first two products are record level, which includes taxonomic levels below species (e.g., strain) and based on the NCBI taxonomy and GTDB taxonomy, respectively. A reference table was generated to track provenance of raw data through the workflow. The last two products are aggregated at species-level for the NCBI taxonomy and GTDB taxonomy, respectively. Trait coverage across the phylogenetic tree is shown in Fig. 2 and the trait distributions are shown in Fig. 3. Table 1 shows species-level trait data derived from original datasets.

A visual representation of the microbe trait data integration workflow for four hypothetical datasets (red, blue, green and orange). Grey bands represent consistent taxonomy and trait detail that applies across the datasets. Each of the four steps—(a) prepare, (b) combine, (c) condense traits and (d) condense to NCBI species—are summarised in the Methods and explained in detail along with scripted steps in R at the GitHub repository.

A graphical representation of data coverage and gaps for the 21 core traits mapped onto a phylogeny (black tree). The phylogeny was created by grafting star phylogenies (NCBI species to phylum) onto a recent molecular phylogeny20 (phylum and above) and was created here purely for illustrative purposes. To avoid clutter, only the six most speciose phyla are delineated at the outer rim (>100 species). Coloured bands represent the presence of traits in the dataset for 14,884 species. In order for the centre outwards, green are habitat traits (isolation source, optimum pH, optimum temperature, growth temperature), blue are organism trait (gram stain, metabolism, metabolic pathways, carbon substrate, sporulation, motility, doubling time, cell shape, any cell diameter), and red are genomic traits (genome size, GC content, coding genes, rRNA16S genes, tRNA genes).
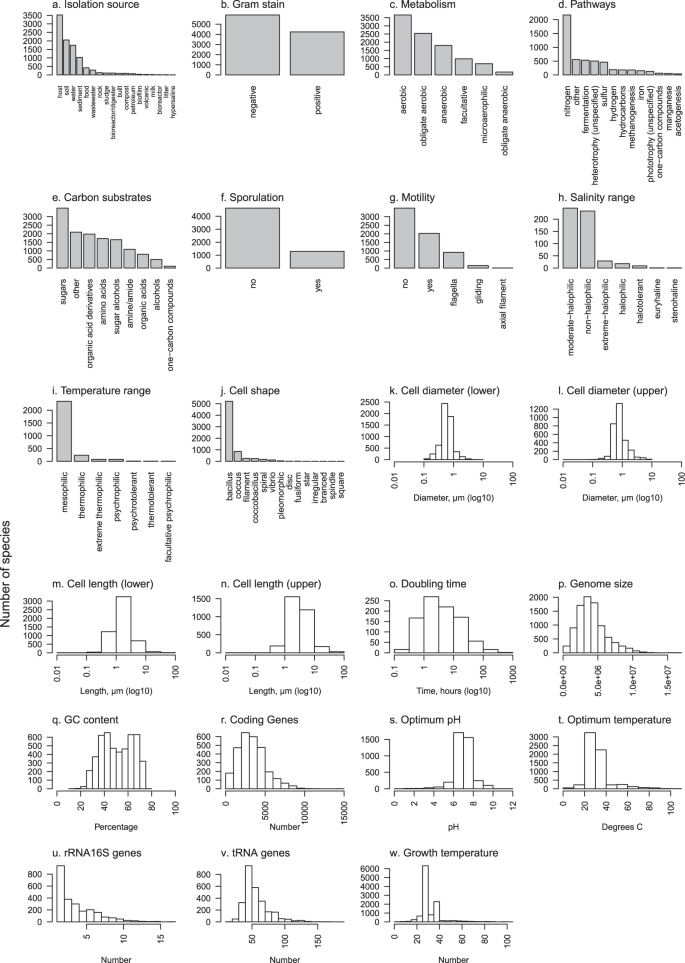
Graphical summaries of each of 23 traits in Online-only Table 2. Barplots are used for categorical traits and frequency histograms for continuous traits. Due to the high number of distinct metabolic pathways (>80) (d) and carbon substrates (>100) (e) included in this data, to simplify presentation each of these were grouped into major categories; pathways were grouped by the primary compound involved or distinct processes where no primary compound exists, and carbon substrates were grouped by chemical classification.
Prepare
The preparation steps removed unwanted columns from raw datasets, ensured standard trait (column) naming, and established that each record (row) had an NCBI taxon ID and reference. In cases where NCBI taxon IDs were not provided in the raw dataset, taxon mapping tables were created using the NCBI taxonomy API, which could retrieve IDs by fuzzy searches of name or accession number, depending on what was available10,17. In cases where the API did not resolve to a single taxon, the NCBI taxonomy browser was used to manually look-up parts of names in case of misspellings or name fragments (e.g., strain names that were truncated to species level). DOIs or full text citations were used for referencing where possible, but in some cases only NCBI BioProject or accession numbers were available and were used to track provenance instead. All changes in the preparation stage were scripted and commented in dataset-specific preparation scripts. Other dataset-specific steps included splitting number ranges into different components (e.g., 10-20 µm to 10 [min], 20 [max] and µm [unit]), and any general data translation issues (e.g., spreadsheet software issues that manipulated characters, dates, and other inconsistencies). Only the traits summarised in Online-only Table 2 were retained for the steps where data are combined (next).
Combine
All the raw datasets were placed into a single sparse matrix with zero overlap (Fig. 1b). A column was added with the name of the dataset (Online-only Table 1) to keep track of dataset provenance. All columns containing referencing information (reference and reference type) and NCBI taxon IDs were moved into dedicated columns. The basic taxonomic hierarchy was mapped onto each row using either of the NCBI or GTDB taxonomies, which added columns for species, genus, family, order, class, phylum and superkingdom.
Condense traits
Condensing trait data involved moving values for the same trait from different datasets into one column (Fig. 1c). The inherent assumption is that data for the same taxon from different datasets were observed independently (e.g., cell sizes for a given strain or species that occurred in multiple datasets were considered different observations, and so are included as multiple rows). This assumption had little influence on the data following the condense species step (next). During the condense traits step, columns with categorical values were mapped into a predefined nomenclature using manually defined lookup tables (e.g., sporulation values were mapped to either “yes” or “no”; Online-only Table 2).
Isolation source or habitat information for prokaryotes follows different schemes in different data sources, and often is unstructured, consisting of a string of words or sentences. With a view to making possible investigation of species and trait distributions across environments, we have developed for this data synthesis a scheme consisting of approximately 100 environment labels. The scheme is hierarchical using up to four levels of specificity, for example a one-term label is “host”, a two-term is “host_animal”, a three-term is “host_animal_endotherm”, and a four-term is “host_animal_endotherm_intestinal”). This allowed us to be relatively specific or relatively vague depending on the information available. To translate environment information into this new scheme, all columns in each data-source that contained environment information were concatenated into one comma-separated string, thus capturing as much information as was available in the data source. These concatenated strings were then manually translated into their most appropriate label in terms of our scheme and saved in a translation table. Given the large number of unique strings created in this way, only the most prevalent strings have at this stage been translated (>3,000), covering approximately 65% of the species in the species condensed dataset. These environmental labels were annotated with terms from the Environmental Ontology (ENVO) and stored in the “environments.csv” table in the GitHub project; however, ENVO annotations do not currently appear in the data products19 because most environmental terms required the union of multiple ENVO terms.
A step was also included to correct datum-specific errors. Some of these likely occurred during original data entry, such as wrong units or misspellings. Others were values that seemed surprising, and also stronger or newer evidence was available from other sources. These corrections were scripted as a translation table that contained the original dataset, taxon, trait and value where the error occurred, and then the new, corrected value as well as a comment and reference as to why the change was made (see Technical Validation). The condense trait step generated three files19: “condensed_traits_NCBI.csv”, “condensed_traits_GTDB.csv” and “references.csv”.
Condense species
At this stage, rows in the dataset represented both strains and species, and each strain and species could have multiple replicate rows for a given trait. Because every row could be mapped to species (but not vice versa), data were aggregated at either the NCBI10,17 or GTDB18 species level. That is, all records for a given species, and strains of that species, were condensed into one record. All rows not resolved to species using these taxonomies were excluded (e.g., those with “sp.” instead of a recognised species name).
For numerical traits, aggregation consisted of calculating the average, standard deviation and number of records for a given species/trait combination. These derived values were saved as columns labelled by the trait name and then the trait name with “.stdev” and “.count” appended, respectively. The script for species condensation can be altered to calculate other derived values, like median, minimum, maximum, and so on.
For categorical traits, the majority rule was used, where terms for a given trait were tallied and the term with greater than 50% of the tally was assigned as the species aggregate. For binary categorical variables (e.g., gram stain, sporulation), and also cell shape, only the dominant term (>50% of total) was assigned and, in the case of ties, no term was assigned (i.e., the value was left blank). For categorical variables with multiple terms and levels of specificity (e.g., metabolism and motility), the following logic was employed:
-
If no single term dominated, a simple logic was used to select the most appropriate term based on grouping of terms into main categories of resemblance (e.g., aerobic vs. anaerobic, motile vs. non-motile) and specificity level (e.g., “aerobic” was considered less specific than “obligate aerobic”; for motility, “yes” was considered less specific than “flagella”).
-
If all terms belong to the same category, the most specific term was selected (e.g., “obligate aerobic” selected instead of “aerobic”).
-
If all terms belong to the same category and all have the same level of specificity (e.g., “facultative aerobic” and “obligate aerobic”), the term is converted to its least specific form (i.e., “aerobic”).
-
If terms belong to different categories (e.g., “aerobic” vs. “anaerobic”), then no term was assigned (i.e., the value was left blank).
Due to the hierarchical nature of the naming schemes for isolation sources, selecting the most representative term was done on a per-level basis. Each isolation source term potentially contained up to 4 levels of detail (e.g., level 1: host, level 2: animal, level 3: endotherm and level 4: blood). For each level (starting at level 1 and proceeding through levels 1 to 4), the occurrence of each term amongst all observations for a given species was counted, and the dominant term chosen and combined with the dominant term in the next level. If no dominant term could be found at a given level (not resolved), the process was stopped at that level. As such, an isolation source may contain 1 to 4 levels of information with increasing specificity.
Bergey’s Manual of Systematics of Archaea and Bacteria11 contains a large amount of useful phenotypic trait detail, such cell size, sporulation, gram, metabolism and more, across the whole of Archaea and Bacteria, but is not stored as a dataset. Therefore, this data source was used at the final stage of the species condense step to fill in data gaps, especially for traits that were easily extractable using text matching (e.g., cell size and metabolism; see scripted workflow for details). The condense species step generated two files19: “condensed_species_NCBI.csv” and “condensed_species_GTDB.csv”.
Data Records
-
1.
“condensed_traits_NCBI.csv”: A trait condensed data record containing all focal trait data (Online-only Table 2) from original datasets using the NCBI taxonomy19. Rows represent strain- or species-level measurements, and there can be more than one row per taxon. On the whole, this is a strain-level, non-aggregated data record.
-
2.
“condensed_traits_GTDB.csv”: Same as “condensed_traits_NCBI.csv” but using the GTDB taxonomy19. This trait condensed data record is smaller, because the GTDB protocol does not accept all NCBI taxa.
-
3.
“references.csv”: A table containing reference information for the data19. Each row in the trait condensed data (“condensed_traits_NCBI.csv” and “condensed_traits_GTDB.csv”) has a unique ID that points to a reference in the reference table for that particular data record. Species condensed data (below) have multiple reference IDs.
-
4.
“condensed_species_NCBI.csv”: A species condensed data record contained all focal traits (Online-only Table 2) aggregated so that there is one row per NCBI-defined species19.
-
5.
“condensed_species_GTDB.csv”: Same as “condensed_species_NCBI.csv” but using the GTDB taxonomy19. However, this species condensed data record is smaller, because the GTDB protocol does not accept all NCBI taxa.
Technical validation
Approximately 80% of the time spent developing this bacteria and archaea trait data pipeline was consumed by searching for and fixing errors and inconsistencies in the raw datasets that were ultimately combined. When inconsistencies across datasets could not be resolved, the data were removed. These fixes necessarily involved human judgment, hence the large time expense. All fixes to datasets have been recorded into a data correction table (in “data/conversion_tables/data_corrections.csv”) that is implemented by the script so that the decision-making process is transparent. In addition to basic error checking (e.g., looking at unique lists of controlled terms, removing whitespace, etc.), we paid particular attention to outliers, which sometimes (though certainly not always) turned out to be problematic. We located outliers by inspecting distributions of the continuous traits, and also bivariate plots (e.g., by sorting residuals from model fits), or boxplots where one variable was categorical. Users who find and wish to correct further errors, or who wish to apply a different judgment about anomalous and outlier traits, can readily implement this through the same data correction and other data translation tables in the GitHub repository.
Usage Notes
The data records are available at figshare19. The script that generated the data records is available at GitHub (https://github.com/bacteria-archaea-traits/bacteria-archaea-traits/releases/tag/v1.0.0). Two large files were not included with the GitHub project: the NCBI taxonomy translation table and PATRIC dataset. These files are automatically downloaded to their correct directories the first time the workflow script is run. If download problems occur, instructions for where to place these large files manually can be found in the project readme file.
Please note that several of the raw datasets entering into the workflow were sourced from dynamic, growing databases (see Online-only Table 1). Therefore, users of the Data Records may consider obtaining fresh versions of the different sources from the links or data providers in Online-only Table 1, and then re-applying the scripted workflow to build an updated data synthesis. Additionally, the datasets we merge contain additional traits that we do not collect in our workflow, given our broader research goals. Adding these traits requires adjusting the project settings and editing dataset specific preparation files. Instructions for doing so are in the project readme file and dataset specific readme files (“data/raw”). Translation tables created to map trait variables, including isolation source, are in the “data/conversion_tables” directory. Additional quality control will be necessary following the addition of new or updated datasets and traits to the workflow.
We encourage other groups who update or add new data sources to this data product to do so using our procedure outlined in the Methods (above) and in more detail at the GitHub project readme. This project uses GitHub’s standard fork and pull request workflow, which is well documented at GitHub. Such changes would follow this general pattern:
-
Forking the GitHub project.
-
Updating the existing or adding the new dataset in its raw form to the “data” repository.
-
Writing a data preparation script (“R/preparation”), which includes appending NCBI taxon IDs if not already in the dataset.
-
Identifying the traits to be merged (“R/settings.R”), and writing a conversion table if the trait is not in the same units of categories as the present dataset version (“data/conversion_tables”).
-
Looking for outliers and other errors, which can be removed or altered using the corrections table (“data/conversion_tables/data_corrections.csv”)
-
Running and testing the merger (“workflow.R”).
-
Submitting a pull request via GitHub, at which point we will review and test the changes.
-
Once the pull request is accepted, the project version will be updated.
Code availability
The complete data workflow was scripted in the programming language R (https://www.R-project.org) and instructions for generating the merged data sets accompanying this data descriptor can be found at GitHub (https://github.com/bacteria-archaea-traits/bacteria-archaea-traits/releases/tag/v1.0.0).
References
Litchman, E. & Klausmeier, C. A. Trait-Based Community Ecology of Phytoplankton. Annu. Rev. Ecol. Evol. S. 39, 615–639 (2008).
Fierer, N., Barberán, A. & Laughlin, D. C. Seeing the forest for the genes: using metagenomics to infer the aggregated traits of microbial communities. Front. Microbiol 5, 614 (2014).
Krause, S. et al. Trait-based approaches for understanding microbial biodiversity and ecosystem functioning. Front. Microbiol 5, 251 (2014).
Litchman, E. et al. Global biogeochemical impacts of phytoplankton: a trait-based perspective. J. Ecol. 103, 1384–1396 (2015).
Martiny, J. B. H., Jones, S. E., Lennon, J. T. & Martiny, A. C. Microbiomes in light of traits: A phylogenetic perspective. Science 350, aac9323 (2015).
Fierer, N. Embracing the unknown: disentangling the complexities of the soil microbiome. Nat. Rev. Microbiol. 15, 579–590 (2017).
Guittar, J., Shade, A. & Litchman, E. Trait-based succession and community assembly of the infant gut microbiome. Nat. Commun. 10, 512 (2019).
Hall, E. K. et al. Understanding how microbiomes influence the systems they inhabit. Nat. Microbiol 3, 977–982 (2018).
Malik, A. A. et al. Defining trait-based microbial strategies with consequences for soil carbon cycling under climate change. ISME J. 14, 1–9 (2020).
Benson, D. A. et al. GenBank. Nucleic Acids Res 41, D36–D42 (2012).
Whitman, W. W. Bergey’s manual of systematics of archaea and bacteria. Wiley (2015).
Díaz, S. et al. The global spectrum of plant form and function. Nature 529, 167–171 (2016).
Kunstler, G. et al. Plant functional traits have globally consistent effects on competition. Nature 529, 204–207 (2016).
Ulrich, L. E. & Zhulin, I. B. The MiST2 database: a comprehensive genomics resource on microbial signal transduction. Nucleic Acids Res 38, D401–D407 (2010).
Le Boulch, M., Déhais, P., Combes, S. & Pascal, G. The MACADAM database: a MetAboliC pAthways DAtabase for Microbial taxonomic groups for mining potential metabolic capacities of archaeal and bacterial taxonomic groups. Database 2019, baz049 (2019).
Mendler, K., Chen, H., Parks, D. H., Hug, L. A. & Doxey, A. C. AnnoTree: visualization and exploration of a functionally annotated microbial tree of life. Nucleic Acids Res 47, 4442–4448 (2019).
Sayers, E. W. et al. Database resources of the National Center for Biotechnology Information. Nucleic Acids Res. 37, D5–D15 (2009).
Parks, D. H. et al. A standardized bacterial taxonomy based on genome phylogeny substantially revises the tree of life. Nat. Biotechnol. 36, 996–1004 (2018).
Madin, J. S. et al. A synthesis of bacterial and archaeal phenotypic trait data. figshare, https://doi.org/10.6084/m9.figshare.c.4843290 (2020).
Hug, L. A. et al. A new view of the tree of life. Nat. Microbiol 1, 16048 (2016).
Amend, J. P. & Shock, E. L. Energetics of overall metabolic reactions of thermophilic and hyperthermophilic Archaea and Bacteria. FEMS Microbiol. Rev. 25, 175–243 (2001).
Reimer, L. C. et al. BacDive in 2019: bacterial phenotypic data for High-throughput biodiversity analysis. Nucleic Acids Res 47, D631–D636 (2019).
Campedelli, I. et al. Genus-Wide Assessment of Antibiotic Resistance in Lactobacillus spp. Appl. Environ. Microb 85, e01738–18 (2018).
Corkrey, R. et al. The Biokinetic Spectrum for Temperature. PLoS ONE 11, e0153343 (2016).
Edwards, K. F., Klausmeier, C. A. & Litchman, E. Nutrient utilization traits of phytoplankton: Ecological Archives E096–202. Ecology 96, 2311–2311 (2015).
Engqvist, M. K. M. Correlating enzyme annotations with a large set of microbial growth temperatures reveals metabolic adaptations to growth at diverse temperatures. BMC Microbiol. 18, 177 (2018).
Louca, S., Parfrey, L. W. & Doebeli, M. Decoupling function and taxonomy in the global ocean microbiome. Science 353, 1272–1277 (2016).
Barberán, A., Caceres Velazquez, H., Jones, S. & Fierer, N. Hiding in Plain Sight: Mining Bacterial Species Records for Phenotypic Trait Information. mSphere 2, e00237–17 (2017).
Mukherjee, S. et al. Genomes OnLine database (GOLD) v.7: updates and new features. Nucleic Acids Res 47, D649–D659 (2019).
Kanehisa, M., Sato, Y., Furumichi, M., Morishima, K. & Tanabe, M. New approach for understanding genome variations in KEGG. Nucleic Acids Res 47, D590–D595 (2019).
Kremer, C. T., Thomas, M. K. & Litchman, E. Temperature- and size-scaling of phytoplankton population growth rates: Reconciling the Eppley curve and the metabolic theory of ecology: Temperature-scaling of phytoplankton growth. Limnol. Oceanogr. 62, 1658–1670 (2017).
Mason, M. M. A Comparison of the Maximal Growth Rates of Various Bacteria under Optimal Conditions. J. Bacteriol 29, 103–110 (1935).
Richards, M. A. et al. MediaDB: A Database of Microbial Growth Conditions in Defined Media. PLoS ONE 9, e103548 (2014).
Łukaszewicz, M., Jabłoński, S. & Rodowicz, P. Methanogenic archaea database containing physiological and biochemical characteristics. Int. J. Syst. Evol. Micr 65, 1360–1368 (2015).
Michał, B. et al. PhyMet 2: a database and toolkit for phylogenetic and metabolic analyses of methanogens. Env. Microbiol. Rep 10, 378–382 (2018).
Shaaban, H. et al. The Microbe Directory: An annotated, searchable inventory of microbes’ characteristics. Gates Open Research 2, 3 (2018).
Nielsen, S. L. Size-dependent growth rates in eukaryotic and prokaryotic algae exemplified by green algae and cyanobacteria: comparisons between unicells and colonial growth forms. J. Plankton Res 28, 489–498 (2006).
Wattam, A. R. et al. Improvements to PATRIC, the all-bacterial Bioinformatics Database and Analysis Resource Center. Nucleic Acids Res 45, D535–D542 (2017).
Brbić, M. et al. The landscape of microbial phenotypic traits and associated genes. Nucleic Acids Res 44, 10074–10090 (2016).
Roden, E. E. & Jin, Q. Thermodynamics of Microbial Growth Coupled to Metabolism of Glucose, Ethanol, Short-Chain Organic Acids, and Hydrogen. Appl. Environ. Microb 77, 1907–1909 (2011).
Stoddard, S. F., Smith, B. J., Hein, R., Roller, B. R. K. & Schmidt, T. M. rrnDB: improved tools for interpreting rRNA gene abundance in bacteria and archaea and a new foundation for future development. Nucleic Acids Res 43, D593–D598 (2015).
Vieira-Silva, S. & Rocha, E. P. C. The Systemic Imprint of Growth and Its Uses in Ecological (Meta)Genomics. Plos Genet. 6, e1000808 (2010).
Acknowledgements
Financial support for the Microbe Trait Working Group has come from Macquarie University’s Species Spectrum Research Centre and from ARC Laureate Fellowships to ITP (FL140100021) and to MW (FL100100080). SGT is supported by Australian Research Council Discovery Early Career Research Fellowship DE150100009.
Author information
Authors and Affiliations
Contributions
M.W. conceived the idea and managed the initiative. J.S.M. and D.A.N. created the pipeline to merge datasets. S.G.T., J.L.G., L.M., M.G. and I.T.P. contributed to identifying relevant datasets for inclusion, data quality checking, and formulating rules for data condensation. All authors collected data and contributed to manuscript writing.
Corresponding author
Ethics declarations
Competing interests
The authors declare no competing interests.
Additional information
Publisher’s note Springer Nature remains neutral with regard to jurisdictional claims in published maps and institutional affiliations.
Online-only Tables
Rights and permissions
Open Access This article is licensed under a Creative Commons Attribution 4.0 International License, which permits use, sharing, adaptation, distribution and reproduction in any medium or format, as long as you give appropriate credit to the original author(s) and the source, provide a link to the Creative Commons license, and indicate if changes were made. The images or other third party material in this article are included in the article’s Creative Commons license, unless indicated otherwise in a credit line to the material. If material is not included in the article’s Creative Commons license and your intended use is not permitted by statutory regulation or exceeds the permitted use, you will need to obtain permission directly from the copyright holder. To view a copy of this license, visit http://creativecommons.org/licenses/by/4.0/.
The Creative Commons Public Domain Dedication waiver http://creativecommons.org/publicdomain/zero/1.0/ applies to the metadata files associated with this article.
About this article

Cite this article
Madin, J.S., Nielsen, D.A., Brbic, M. et al. A synthesis of bacterial and archaeal phenotypic trait data. Sci Data 7, 170 (2020). https://doi.org/10.1038/s41597-020-0497-4
Received:
Accepted:
Published:
DOI: https://doi.org/10.1038/s41597-020-0497-4
This article is cited by
-
Predictions of rhizosphere microbiome dynamics with a genome-informed and trait-based energy budget model
Nature Microbiology (2024)
-
A slow-fast trait continuum at the whole community level in relation to land-use intensification
Nature Communications (2024)
-
Life history strategies of soil bacterial communities across global terrestrial biomes
Nature Microbiology (2023)
-
Taxonomic and environmental distribution of bacterial amino acid auxotrophies
Nature Communications (2023)
-
Genome-scale metabolic reconstruction of 7,302 human microorganisms for personalized medicine
Nature Biotechnology (2023)
