
Abstract
Motion capture is necessary to quantify gait deviations in individuals with lower-limb amputations. However, access to the patient population and the necessary equipment is limited. Here we present the first open biomechanics dataset for 18 individuals with unilateral above-knee amputations walking at different speeds. Based on their ability to comfortably walk at 0.8 m/s, subjects were divided into two groups, namely K2 and K3. The K2 group walked at [0.4, 0.5, 0.6, 0.7, 0.8] m/s; the K3 group walked at [0.6, 0.8, 1.0, 1.2, 1.4] m/s. Full-body biomechanics was collected using a 10-camera motion capture system and a fully instrumented treadmill. The presented open dataset will enable (i) clinicians to understand the biomechanical demand required to walk with a knee and ankle prosthesis at various speeds, (ii) researchers in biomechanics to gain new insights into the gait deviations of individuals with above-knee amputations, and (iii) engineers to improve prosthesis design and function.
Measurement(s) | Biomechanics • Kinetics • kinematics • walking • Above-Knee Amputation • transfemoral amputation |
Technology Type(s) | motion capture system • treadmill |
Factor Type(s) | Medicare Functional Classification Level • walking speed |
Sample Characteristic - Organism | Homo sapiens |
Machine-accessible metadata file describing the reported data: https://doi.org/10.6084/m9.figshare.12221543
Background & Summary
Motion capture has become an essential part of gait analysis. This experimental technique enables researchers to quantify how humans move and interact with the environment. Motion capture is fundamental for clinical gait analysis—the study of pathological gait1,2. The quantitative information gained from motion capture can assist in understanding the etiology of gait abnormalities, treatment decision making, and designing new therapeutic interventions such as walking aids and assistive devices2,3,4,5,6. Unfortunately, motion capture requires dedicated space, expensive equipment, specialized technicians, and significant amounts of time for both data collection and data processing. Furthermore, access to the patient population may be limited for most researchers interested in the interpretation of the biomechanics data. Thus, making gait datasets open is crucial to minimizing the cost and maximizing the impact of gait analysis.
Gait analysis is critical to assess the mobility level of individuals with gait impairment. The potential for community mobility in individuals with lower-limb amputations is internationally rated using a mobility grade scale7,8,9. The mobility grade assigned to an individual affects treatment decision making. For example, in the US, the Medicare Functional Classification Level, K-Level10,11, is used by Medicare, Medicaid, and many other private insurance companies to determine eligibility for payment or reimbursement of prosthetic technologies12. Currently, this classification is largely based on clinical outcome tests focusing on walking speed, as well as on the physician’s subjective assessment13,14. However, the relationship between K-level and pathological gait biomechanics is not clear11,12,15. This relationship is particularly difficult to address due to the high variability within this population. Motion capture has the potential to address this challenge by providing a quantitative understanding of the relationship between biomechanics and K-levels. Although many research studies have focused on the gait analysis of individuals with above-knee amputations, there is no open biomechanics dataset for this patient population.
In this paper, we present an open dataset of above-knee amputee biomechanics. The proposed dataset has been established in 18 individuals with unilateral above-knee amputations. Nine subjects were classified as full community ambulators (K3), and nine subjects were classified as limited community ambulators (K2). The classification was performed based on the subject’s ability to walk comfortably at or above 0.8 m/s16. The proposed dataset includes kinematics and kinetics collected while walking on an instrumented treadmill at five different speeds. A different set of speeds were used for the two groups based on K-level. The raw data recorded consisted of three-dimensional trajectories of 61 cutaneous reflective markers spread over the whole body, and the kinetics collected from the force plates, all synchronized and recorded in real time. For each subject, we collected five walking trials for each walking speed condition plus three calibration trials. This open biomechanics dataset will provide a new resource for clinicians to make treatment decisions3,6, for therapists to select appropriate therapeutic interventions4,5, and for researchers to design better prosthesis technologies17,18,19,20.
Methods
We enrolled a total of 18 subjects with an above-knee amputation in this study. All subjects had received a unilateral above-knee amputation at least one year prior to the enrolment, have used a prescribed prosthesis for at least six months, and self-reported using the prosthesis for at least 3 hours a day. Table 1 shows the demographic data of the subjects. The experimental protocol for this study was approved by the University of Utah Institutional Review Board. All subjects provided written informed consent, including written permission to publish photos and videos of the experiment.
Upon enrolment, subjects were asked about their previous experience with walking on a treadmill. Subjects who reported using the treadmill regularly were asked to report their maximum comfortable treadmill speed and reliance on handrails during treadmill use. If a subject reported little to no experience walking on a treadmill with a prosthesis, they were provided training. Training consisted of the subject walking on the treadmill for 2–5 minute intervals with periods of rest in between each interval. During each training session, the experimenter started at the slowest speed of the treadmill (i.e., 0.2 m/s) and slowly incremented up until the subject reported that the speed was their maximum comfortable treadmill speed. Each training session lasted less than 2 hours. Weekly training sessions were conducted for three subjects, see Table 1, until no further improvements in comfortable walking speed were observed.
Subjects were divided into two groups based on the observed and reported maximum comfortable walking speed as well as their reliance on handrails. The walking speed of 0.8 m/s is commonly used as a threshold for determining if a subject is considered a limited community ambulator (K2) or full community ambulator (K3)16. Thus, for this study, we defined two subject groups (i.e., K2 and K3 group) based on the threshold speed of 0.8 m/s. Specifically, subjects were assigned to the K3 group if they could walk without using handrails at speeds up to 1.2 m/s. If a subject required the assistance of handrails for any speed above 0.8 m/s or their maximum walking speed was 0.8 m/s or lower, they were assigned to the K2 group. Different speed ranges were used during data collection for the two groups. The K2 group walked at [0.4, 0.5, 0.6, 0.7, 0.8] m/s; the K3 group walked at [0.6, 0.8, 1.0, 1.2, 1.4] m/s. An equal number of subjects were assigned to the K3 and K2 groups, Table 1.
Data collection was performed in a single session lasting no more than two hours. The experimental protocol comprised four sequential steps as described below.
-
1.
System Initialization. Motion capture was performed using a 10-camera Vicon system (Vicon Motion Systems Ltd; Oxford, UK) and a split-belt (20in width) Bertec Fully Instrumented Treadmill (Bertec Co; Columbus, OH). The treadmill has a frontal handrail and two lateral handrails that are not instrumented. The motion capture cameras and the instrumented treadmill were initialized following the instructions provided by the manufacturer21. The initialization protocol included calibration of the cameras within the capture volume21, leveling the treadmill21, setting the volume origin21, and zeroing the force plates of the treadmill21.
-
2.
Preparation of the subject. The subject wore tight fitted clothing and comfortable walking shoes. Reflective markers (14-mm diameter, 2-mm base) were placed on the subject following a modified Plug-in-Gait Model22,23,24,25,26 shown in Fig. 1 and listed in Table 1. The thigh and shank marker clusters were attached to the sound leg using a wrap and attached to the amputation side by directly placing the markers on the subject’s prosthesis and socket. An elastic wrap was placed over the abdomen to prevent the harness from blocking pelvic markers and to minimize soft tissue artifact. An upper-body harness was securely fastened to the subject. The subject was then directed onto the treadmill and the harness was connected to an overhead support system.
Fig. 1 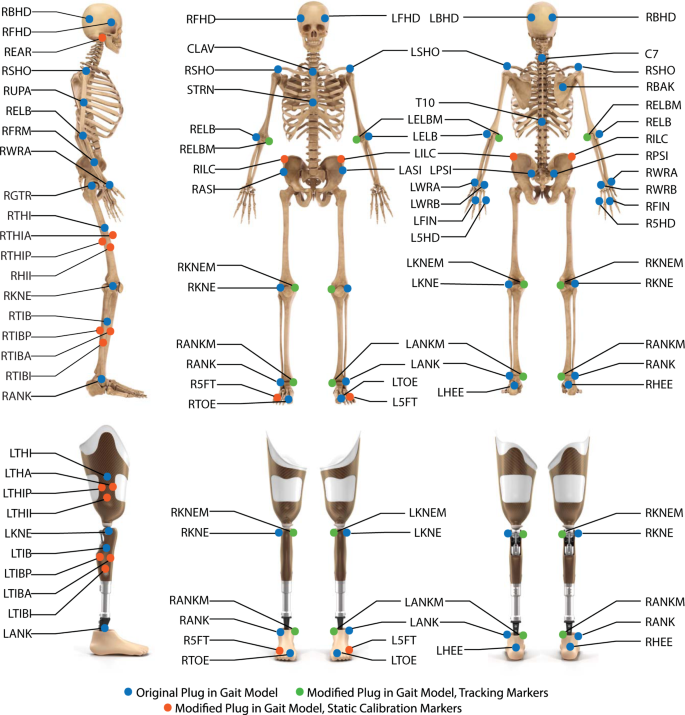
Locations and names of the markers in the modified Plug In Gait model. Markers used in both the original and modified Plug In Gait model are shown in blue. Markers used only in the modified Plug In Gait model are shown in orange for tracking and green for static calibration.
-
3.
Calibration Routines. Three calibration routines were performed with the subject on the treadmill. Static Calibration: the subject was asked to stand still for five seconds with legs shoulder-width apart and arms out in front with elbows slightly bent27. Static calibration markers are removed after static calibration is completed. Functional Calibration: the subject was brought up to the middle speed within the classification and were recorded walking for approximately five strides27. Joint Center Calibration: the subject was asked to swing each leg, individually, in a clock pattern from noon to six or six to noon, depending on the side. Then, the subject performed two squats to bend the knee joint of the prosthesis27.
-
4.
Walking trials. The subject walked at each speed in the assigned group starting from the slower speed. Subjects were instructed to hold on to the treadmill’s handrails during acceleration and deceleration of the treadmill. After the treadmill reached the desired speed, the experimenter encouraged the subject to walk without using the handrails. Subjects that were not able to walk without the support of handrails were noted by the experimenter (Table 1). For each treadmill speed, five trials of at least ten strides were recorded. If the subject crossed the force plates during data acquisition, the recording was stopped, and a new trial was recorded. After five trials of ten strides were successfully performed, the experimenter stopped the treadmill and the subject was given time to rest. The same protocol was repeated for the five different speeds specified in the subject group.

Marker trajectories and ground reaction force data were synchronized, recorded, and pre-processed using Vicon Nexus 2 software. Marker trajectory data was collected at 200 Hz and the ground reaction force data at 1000 Hz. Pre-processing consisted of labeling the markers, defining segments and calculating segment dimensions using the static and functional calibration routines. Once the markers were labeled, gaps in the marker trajectories were filled using rigid-body, spline, and pattern fill algorithms21. Gait events such as heel strike and toe off were detected and marked21. After the pre-processing was completed, the marker trajectories, force plate analog data and gait events were imported into Visual 3D software (C-Motion Inc, Germantown, Maryland). A low-pass Butterworth filter with a cut-off frequency of 6 Hz was applied for the marker trajectories. A low-pass Butterworth filter with cut-off frequency of 15 Hz was applied for the analog force plate data. The cut-off frequency for the low-pass Butterworth filter was determined using residual analysis28. Low-pass filtering was applied to the marker trajectories and analog force plate data before further analysis was performed.
To calculate the kinetics and kinematics, some anthropometric data including joint center of rotations were approximated for each subject within Visual 3D. The approximation of segment dimensions was determined from the modified Plug-in-Gait model using the static calibration file.
Dempster’s29 and Hanavan’s30 assumptions were used in combination with the subject’s reported weight (including the prosthesis) and segment dimension approximations to determine each subject’s mass, center of mass, and inertial properties of each segment. While these assumptions are commonly used in the field, other sources for anthropometric and inertial assumptions, such as De Leva31 or Zatziorsky32, can be applied to the provided marker trajectory data. Notably, a prosthesis cannot be accurately modeled using the assumptions made for an able-bodied individual33. Thus, the kinetics and kinematics were calculated using the assumptions that prosthesis side shank weight is 1/3 of the assumed able-bodied shank weight, and the center of mass is 25% below the top of the shank after previous studies34,35. Although the prostheses center of mass and inertial properties can be measured experimentally, this approach requires dedicated, custom equipment36 and was found not statistically different from assumptions we have used34,35. Starting from the specific prostheses components reported in Table 1, researchers may be able find experimental approximations of the center of mass and inertial properties and apply them to the provided marker trajectory data.
The knee joint center of rotation for both the prosthesis and sound side was calculated using the Symmetrical Axis of Rotation Analysis, SARA37,38, from the joint center calibration file. Noticeable error was observed when using the Symmetrical Center of Rotation Estimation, SCORE, for calculating the hip joint center of rotation. Upon analysis we concluded that this error correlated to movement at the socket-tissue interface. As a result, the Charnwood Dynamics Model, CODA39,40, was used to find the hip joint center of rotation. Using the joint center of rotations and the anthropometric assumptions, we computed the kinetics and kinematics of the ankle, knee and hip for both the contralateral (sound side) and ipsilateral (prosthesis side) side. Each subject’s use of the handrails, which were not instrumented, has been noted in Table 1. The kinetics and kinematics were calculated in Visual 3D and then exported into MATLAB (Mathworks, Natick, MA) data files for each subject.
Data Records
All data is made open using Figshare41. The subjects have been identified with an alphanumeric code using the format TF## noted for transfemoral amputation (TF) followed by their identification number (##). The de-identified subject information is stored in the Excel file named “Subject Information”. This file contains the alphanumeric codes, anthropometric data, ages, etiology of amputation, and prescribed prosthesis information for all subjects. The motion capture data has been grouped into folders. Each folder contains the data related to one subject and is named after the subject’s alphanumeric code. Within each subject folder there are two workspace folders, the Vicon Workspace and the Matlab Workspace. The Vicon Workspace contains the static, functional, and joint center calibration collections, as well as all the dynamic trials for the subject. The dynamic trials are noted as speed_## for the speed at which the subject walked for that collection, followed by the index of the collection at that speed. The speed was noted as 0p4 or 1p4, where p is used to replace the period in the naming of the speed using the units of m/s. For example, 0.4 m/s is coded as 0p4_##. The indexing of the collection for each speed is not sequential for all speeds, for example indexing of [01, 02, 03, 05, 06] where the index of [04] is dropped. This nonsequential indexing is due to the removal of collections with errors, such as a marker dropped, the subject crossed force plates during a step, or the subject requested an early rest. The Vicon workspace contains all the information about the collection and stores both the raw, unprocessed data from each collection, as well as the post-processed data after filling was completed. Vicon also creates a .c3d file for use in other software programs such as Visual 3D for further analysis and modeling. The marker trajectory data is provided so that any desired anthropometric and inertial assumptions can be applied to the data, including assumptions for the prosthesis. The MATLAB Workspace contains a data file for each subject with the processed kinetic and kinematic profiles. The MATLAB database is organized into a structure as shown in Fig. 2. The stride time is normalized to 1001 samples. All the strides for a given speed and side are saved as the raw data, along with the average and standard deviation across all strides. The folder Matlab Plotting Functions contains an example_plotting_script for how to use the plotting functions also contained in the folder. These plotting functions are built to compare speeds for a given variable (plot_allspeeds_pos_comp_sides), or to compare the ipsilateral and contralateral sides for a given subject (plot_eachspeed_comp_sides). The Vicon and Matlab workspaces provide a comprehensive dataset of the experiments by including raw marker data and processed joint biomechanics.

Matlab structure in which the kinetic and kinematic data is saved.
Technical Validation
Calibration of the motion capture volume
The capture volume consisted of 10 Vicon Cameras and a dual-belt fully instrumented Bertec Treadmill. Vicon Nexus software was used to synchronize the equipment and to perform the calibrations. As discussed in the Methods section, the capture volume was calibrated before each collection following the manufacturers recommended procedure21. This initialization protocol included calibration of the cameras within the capture volume21, leveling the treadmill21, setting the volume origin21, and zeroing the force plates of the treadmill21. For calibration of the cameras, a 5-marker wand and L-frame was used with 1000 refinement frames and 500 DV calibration frames. The global error of each camera displays the calibration error in mm and is saved in the ‘.xcp’ file for each recorded trail.
3D trajectories of reflective markers
The 3D trajectories for each of the reflective markers were fully reconstructed to alleviate any gaps in the trajectories. This filling was performed on all walking trials and the joint center calibration file. Note that no filling was performed on the static and functional calibration files. Image error is reflective of the 3D reconstruction accuracy and is saved for each camera in the ‘.xcp’ file for each recorded trial. All reconstruction and filling have been saved and stored in the ‘.history’ file.
Modified Plug-in-Gait model
A modified Plug-in-Gait Model was used for all experiments. This marker set used 67 reflective markers as listed in Table 2 to define 15 body segments (i.e., 2 feet, 2 shanks, 2 thighs, pelvis, trunk, head, 2 hands, 2 forearms, 2 arms). The exact location of the markers has been shown in Fig. 1. Compared to the standard Plug-in Gait model recommended by Vicon Nexus22, our modified Plug-in-Gait model used an additional 28 markers23,24. These additional markers were helpful in pre-processing to perform rigid-body-filling with markers specific to the segment without overlap across segments, minimizing inter-segment dependency24. Additional static calibration markers were also placed on the medial joints to measure joint width (e.g. markers on the medial and lateral sides of the knee used to calculated knee joint width). Notably, the medial markers were only placed for the static calibration file and then were removed for the rest of the protocol. The modified Plug-in-Gait Model was developed by adapting principles suggested in other models25,26.
References
Whittle, M. W. Clinical gait analysis: A review. Hum. Mov. Sci. 15, 369–387 (1996).
Davis, R. B., Ounpuu, S., DeLuca, P. A. & Romness, M. J. Clinical Gait Analysis and Its Role in Treatment Decision-Making. Medscape Gen. Med. 1–21 (2002).
Wren, T. A. L., Gorton, G. E., Ounpuu, S. & Tucker, C. A. Efficacy of clinical gait analysis: A systematic review. Gait Posture 34, 149–153 (2011).
Baker, R. Gait analysis methods in rehabilitation. J. Neuroeng. Rehabil. 3, 1–10 (2006).
Harlaar, J. & Lankhorst, G. J. Impairment assessment in rehabilitation medicine: The potential role of technology to assist clinical decision making. Disabil. Rehabil. 20, 29–32 (1998).
Lu, T. W. & Chang, C. F. Biomechanics of human movement and its clinical applications. Kaohsiung J. Med. Sci. 28, S13–S25 (2012).
Rommers, G. M., Vos, L. D., Groothoff, J. W. & Eisma, W. H. Mobility of people with lower limb amputations: Scales and questionnaires: A review. Clin. Rehabil. 15, 92–102 (2001).
Mishler, B. M. What are K Levels? Ottobock US, https://www.ottobockus.com/therapy/resources-for-prosthetics/what-are-k-levels.html (2020).
Lower limb technical terminology: mobility grade. Ottobock EU, https://www.ottobock-export.com/en/prosthetics/information-for-amputees/technical-terms/technical-terms-lower-limb/ (2020).
Hafner, B. J. & Smith, D. G. Differences in function and safety between Medicare Functional Classification Level-2 and -3 transfemoral amputees and influence of prosthetic knee joint control. J. Rehabil. Res. Dev. 46, 417–134 (2009).
Gailey, R. S. et al. The Amputee Mobility Predictor: An instrument to assess determinants of the lower-limb amputee’s ability to ambulate. Arch. Phys. Med. Rehabil. 83, 613–627 (2002).
U. S. Health Care Financing Administration. HCFA Common Procedure Coding System (HCPCS): National Level II Medicare Codes (2000).
Heinemann, A. W., Connelly, L., Ehrlich-Jones, L. & Fatone, S. Outcome instruments for prosthetics: Clinical applications. Phys. Med. Rehabil. Clin. N. Am. 25, 179–198 (2014).
Borrenpohl, D., Kaluf, B. & Major, M. J. Survey of U.S. Practitioners on the Validity of the Medicare Functional Classification Level System and Utility of Clinical Outcome Measures for Aiding K-Level Assignment. Arch. Phys. Med. Rehabil. 97, 1053–1063 (2016).
Dillon, M. P., Major, M. J., Kaluf, B., Balasanov, Y. & Fatone, S. Predict the Medicare Functional Classification Level (K-level) using the Amputee Mobility Predictor in people with unilateral transfemoral and transtibial amputation: A pilot study. Int. Soc. Prosthetics Orthot. 42, 191–197 (2018).
Bowden, M. G., Balasubramanian, C. K., Behrman, A. L. & Kautz, S. A. Validation of a speed-based classification system using quantitative measures of walking performance poststroke. Neurorehabil. Neural Repair 22, 672–675 (2008).
Shultz, A. H. & Goldfarb, M. A Unified Controller for Walking on even and Uneven Terrain with a Powered Ankle Prosthesis. IEEE Trans. Neural Syst. Rehabil. Eng. 26, 788–797 (2018).
Rezazadeh, S. et al. A Phase Variable Approach for Improved Rhythmic and Non-Rhythmic Control of a Powered Knee-Ankle Prosthesis. IEEE Access 7, 109840–109855 (2019).
Tran, M., Gabert, L., Cempini, M. & Lenzi, T. A Lightweight, Efficient Fully Powered Knee Prosthesis with Actively Variable Transmission. IEEE Robot. Autom. Lett. 4, 1186–1193 (2019).
Hood, S. A. & Lenzi, T. Preliminary Analysis of Positive Knee Energy Injection in A Transfemoral Amputee Walking with A Powered Prosthesis. In Proceedings of the Annual International Conference of the IEEE Engineering in Medicine and Biology Society, EMBS vols 2018-July 1821–1824 (2018).
Vicon Motion Systems Limited. Vicon Nexus User Guide. Vicon Documentation (2010).
Vicon Motion Systems Limited. Plug-in Gait Reference Guide. Vicon Documentation (2016).
Phinyomark, A., Petri, G., Ibanez-Marcelo, E., Osis, S. T. & Ferber, R. Analysis of Big Data in Gait Biomechanics: Current Trends and Future Directions. J. Med. Biol. Eng. 38, 244–260 (2018).
Kent, J. & Franklyn-Miller, A. Biomechanical models in the study of lower limb amputee kinematics: A review. Prosthet. Orthot. Int. 35, 124–139 (2011).
Collins, T. D., Ghoussayni, S. N., Ewins, D. J. & Kent, J. A. A six degrees-of-freedom marker set for gait analysis: Repeatability and comparison with a modified Helen Hayes set. Gait Posture 30, 173–180 (2009).
Buczek, F. L., Rainbow, M. J., Cooney, K. M., Walker, M. R. & Sanders, J. O. Implications of using hierarchical and six degree-of-freedom models for normal gait analyses. Gait Posture 31, 57–63 (2010).
Vicon Motion Systems Limited. Creating labeling skeleton templates (VSTs). Vicon Documentation (2016).
Winter, D. A. Biomechanics and Motor Control of Human Gait: Normal, Elderly and Pathological. 2nd edition (Waterloo Biomechanics Press, Waterloo, Ontario, 1991).
Dempster, W. Space requirements of the seated operator Geometrical, kinematic, and mechanical aspects of the body. (Wright-Patterson Air Force Base, Ohio, Wright Air Development Center, 1955).
Hanavan, E. P. A mathematical model of the human body. (Air Force Aeropsace Medical Research Lab Wright-Patterson AFB OH, 1966).
de Leva, P. Adjustments to Zatsiorsky-Seluyanov’s Segment Inertia Parameters. J. Biomech. 29, 123–1230 (1996).
Zatsiorsky, V. M. & Seluyanov, V. N. Mass and inertia characteristics of the main segments of the human body. In International Series on Biomechanics vol. 4 B 1152–1159 (Human Kinetics Publishers, 1983).
Sawers, A. B. & Hahn, M. E. The potential for error with use of inverse dynamic calculations in gait analysis of individuals with lower limb loss: A review of model selection and assumptions. Journal of Prosthetics and Orthotics. 22, 56–61 (2010).
Mattes, S. J., Martin, P. E. & Royer, T. D. Walking Symmetry and Energy Cost in Persons With Unilateral Transtibial Amputations: Matching Prosthetic and Intact Limb Inertial Properties. Arch. Phys. Med. Rehabil. 81, 561–568 (2000).
Ferris, A. E., Smith, J. D., Heise, G. D., Hinrichs, R. N. & Martin, P. E. A general model for estimating lower extremity inertial properties of individuals with transtibial amputation. J. Biomech. 54, 44–48 (2017).
Smith, J. D., Ferris, A. E., Heise, G. D., Hinrichs, R. N. & Martin, P. E. Oscillation and reaction board techniques for estimating inertial properties of a below-knee prosthesis. J. Vis. Exp. 87, 1–15 (2014).
Taylor, W. R. et al. Repeatability and reproducibility of OSSCA, a functional approach for assessing the kinematics of the lower limb. Gait Posture 32, 231–236 (2010).
Ehrig, R. M., Taylor, W. R., Duda, G. N. & Heller, M. O. A survey of formal methods for determining functional joint axes. J. Biomech. 40, 2150–2157 (2007).
Bell, A., Pederson, D. & Brand, R. Prediciton of hip joint center of locaiton from external landmarks. Hum. Mov. Sci. 8, 3–16 (1989).
Bell, A., Pederson, D. & Brand, R. A comparison of the accuracy of several hip center location prediction methods. J. Biomech. 23, 617–621 (1990).
Hood, S. & Lenzi, T. Lower Limb Kinetic and Kinematic Data of 18 Above Knee Amputees. figshare, https://doi.org/10.6084/m9.figshare.c.4962305 (2020).
Acknowledgements
Authors would like to thank Grace Hunt for assisting in data collection and analysis. Also, authors would like to thank Dr. Colby Hansen, MD, and Dr. Chris Duncan, MD, for help with subject recruitment. The University of Utah Undergraduate Research Opportunity Program (UROP) provided funding to support the assistance of Andrew Gunnell. This research was partly supported by the U.S. Department of Defense under contract W81XWH-16-1-0701.
Author information
Authors and Affiliations
Contributions
T.L., B.F., and S.H. conceived and planned the experiments. T.L., M.K.I., and S.H. recruited the subjects. M.K.I. and S.H. trained the subjects and carried out the experiments. B.F., S.H., and A.G. processed the data. T.L. directed the project. All authors discussed the results and contributed to the final manuscript.
Corresponding author
Ethics declarations
Competing interests
The authors declare no competing interests.
Additional information
Publisher’s note Springer Nature remains neutral with regard to jurisdictional claims in published maps and institutional affiliations.
Rights and permissions
Open Access This article is licensed under a Creative Commons Attribution 4.0 International License, which permits use, sharing, adaptation, distribution and reproduction in any medium or format, as long as you give appropriate credit to the original author(s) and the source, provide a link to the Creative Commons license, and indicate if changes were made. The images or other third party material in this article are included in the article’s Creative Commons license, unless indicated otherwise in a credit line to the material. If material is not included in the article’s Creative Commons license and your intended use is not permitted by statutory regulation or exceeds the permitted use, you will need to obtain permission directly from the copyright holder. To view a copy of this license, visit http://creativecommons.org/licenses/by/4.0/.
The Creative Commons Public Domain Dedication waiver http://creativecommons.org/publicdomain/zero/1.0/ applies to the metadata files associated with this article.
About this article

Cite this article
Hood, S., Ishmael, M.K., Gunnell, A. et al. A kinematic and kinetic dataset of 18 above-knee amputees walking at various speeds. Sci Data 7, 150 (2020). https://doi.org/10.1038/s41597-020-0494-7
Received:
Accepted:
Published:
DOI: https://doi.org/10.1038/s41597-020-0494-7
This article is cited by
-
A pelvic kinematic approach for calculating hip angles for active hip disarticulation prosthesis control
Journal of NeuroEngineering and Rehabilitation (2023)
-
Development of four-bar polycentric knee joint with stance-phase knee flexion
Scientific Reports (2023)
-
Is there a trade-off between economy and task goal variability in transfemoral amputee gait?
Journal of NeuroEngineering and Rehabilitation (2022)
-
Powered knee and ankle prostheses enable natural ambulation on level ground and stairs for individuals with bilateral above-knee amputation: a case study
Scientific Reports (2022)
-
Powered hip exoskeleton improves walking economy in individuals with above-knee amputation
Nature Medicine (2021)
