
Abstract
Emergence of coronaviruses poses a threat to global health and economy. The current outbreak of SARS-CoV-2 has infected more than 28,000,000 people and killed more than 915,000. To date, there is no treatment for coronavirus infections, making the development of therapies to prevent future epidemics of paramount importance. To this end, we collected information regarding naturally-occurring variants of the Angiotensin-converting enzyme 2 (ACE2), an epithelial receptor that both SARS-CoV and SARS-CoV-2 use to enter the host cells. We built 242 structural models of variants of human ACE2 bound to the receptor binding domain (RBD) of the SARS-CoV-2 surface spike glycoprotein (S protein) and refined their interfaces with HADDOCK. Our dataset includes 140 variants of human ACE2 representing missense mutations found in genome-wide studies, 39 mutants with reported effects on the recognition of the RBD, and 63 predictions after computational alanine scanning mutagenesis of ACE2-RBD interface residues. This dataset will help accelerate the design of therapeutics against SARS-CoV-2, as well as contribute to prevention of possible future coronaviruses outbreaks.
Measurement(s) | Molecular Genetic Variation |
Technology Type(s) | digital curation |
Factor Type(s) | ACE2 variants |
Sample Characteristic - Organism | Homo sapiens |
Machine-accessible metadata file describing the reported data: https://doi.org/10.6084/m9.figshare.12902498
Background & Summary
The novel and highly-pathogenic coronavirus (SARS-CoV-2) emerged from Wuhan city, Hubei province of China late 20191, spreading rapidly across the world and causing a global public health emergency with more than 28,000,000 infections in more than 200 countries. Symptoms include dry cough, tiredness, fever as well as severe pneumonia with additional extrapulmonary manifestations and complications2.
SARS-CoV-2 is the latest member of the betacoronavirus genus which includes SARS-CoV, MERS-CoV, bat SARS-related coronaviruses (SARSr-CoV), as well as others infecting diverse animal species and humans3. Although bat coronavirus RaTG13 seems to be the closest relative of the SARS-CoV-2, sharing > 93% sequence identity in the spike (S) gene, SARS-CoV and other SARSr-CoVs are distinct with < 80% sequence identity4. This (S) gene translates a protein which assembles in homotrimers on the viral envelope, forming the “corona” after which the group is named. Coronaviruses use this spike glycoprotein, composed of an S1 and an S2 subunit in each spike monomer, to bind host cell receptors5. This initial binding event triggers multiple events that culminate with the fusion of cell and viral membranes for cell entry. Recent studies have pointed the important and conserved role of the cell membrane receptor angiotensin-converting enzyme 2 (ACE2) in mediating entry of SARS-CoV-26. It is known that SARS-CoV-2 spike interacts with ACE2 through a receptor binding domain (RBD), which binds ACE2 with low nM affinity7, and then induces dissociation of S1 with ACE2, prompting the S2 to transfer from a prefusion to a postfusion state essential for membrane fusion. Therefore, spike protein RBD binding to the ACE2 receptor is the first key-step which enables the virus to enter target cells.
Recent crystallographic and electron cryo-microscopic (cryo-EM) studies have provided details into the structure of the SARS-CoV-2 S protein, resolved in its free state in both closed and open conformations8,9, but also bound (the RBD domain) to the ACE2 membrane receptor8,10,11. The atomic-level structural information greatly improves our understanding of the interaction between SARS-CoV-2 and susceptible cells, providing a precise target for neutralizing antibodies, and assisting structure-based drug design - urgently needed in our ongoing combat against the virus. To our knowledge, all current structural studies have examined the interaction of the SARS-CoV-2 RBD only with the main ACE2 membrane receptor variant while studies probing SARS-CoV-2 RBD domain in complex with ACE2 variants are limited12,13.
Studying the effect of naturally-occurring single nucleotide polymorphisms (SNPs) of ACE2 in humans12,13,14 on its affinity to the SARS-CoV-2 RBD domain is necessary for the development of appropriate therapeutics. ACE2 variants are known to be related to cardiovascular disease15 and indeed, a large proportion of patients infected by SARS-CoV-2 have underlying cardiac risk factors14,15. Some of these ACE2 variants result in amino acid changes (missense mutations), which consequently affect the 3D structure of the formed complex. Further, some variants might promote different infectivity rates due to different affinities of ACE2 to the SARS-CoV-2 RBD domain.
Therefore, understanding variation of ACE2 in human population is of critical importance for the development of therapeutic strategies against coronaviruses. Despite in vitro studies on other ACE2 variants, there has not been a systematic study of the effects of these variations on the 3D structure of the protein and its complex with RBD. 3D models of ACE2 variants in complex with the SARS-CoV-2 RBD will be of use to industrial and academic communities alike because they can be starting points for drug design while providing further understanding into the recognition of SARS-CoV-2 S proteins by ACE2. To this end, we assembled a structure-based dataset of ACE2 variants in complex with the SARS-CoV-2 RBD, communicating in total 242 structural models.
Methods
Database search
To identify all relevant variants of ACE2, we performed a search in multiple databases and created workflow for assembling the variants in complex with the SARS-CoV-2 RBD (Fig. 1). For variants naturally occurring in the human population, we searched gnomAD16 and identified 155 unique missense ACE2 variants, 140 of which are mapped on the structural model (Online-only Table 1). For variants of ACE2 with known binding data we searched Uniprot17 and the corresponding articles which describe site-directed mutagenesis experiments18,19,20. We identified 39 variants in total with 49 reported mutations (Table 1).

Schematic overview of the structure-based benchmark of ACE2 variants-S protein complexes. All available variants are collected from (a) missense mutations identified in the human genome; (b) overexpressed constructs of ACE2 variants reported in the literature; and (c) designed alanine scanning mutagenesis variants of ACE2, targeting the interface residues with the S protein (upper panels). In the bottom panel, a structure-based benchmark including all variants is assembled for use in drug development, and optimization of the interface of the variant by including the Zn+2 ion is performed using the HADDOCK software. Zn2+ is represented magnified, because it was considered for calculations.
Initial model and formation of variants
We used the cryo-EM model of the wild-type ACE2 in complex with the SARS-CoV-2 RBD, in the presence of the B°AT1 complex11 as a starting structure. Then, we systematically modelled all known variants of ACE2 and constructed the equivalent 2019-nCoV RBD/ACE2-B°AT1 complexes using PyMOL21 and the “mutagenesis” wizard. We picked the rotamers with the lowest clash score and stored the models in both .pdb and .cif formats. These models include all co-factors, namely ions and structurally-important glycan molecules that were structurally resolved11.
In silico alanine scanning mutagenesis
The initial model11 was used to calculate interface residues by considering all residue-residue pairs of the wild-type ACE2 and the SARS-CoV-2 RBD within 10 Å distance of each other. These positions were then individually mutated to alanine residues (Ala). In total, we selected 63 residues, plus 6 which were alanine residues in the wild-type sequence and served as positive controls (Table 2).
Interface refinement
Heterodimers of ACE2 variants and SARS-CoV-2 RBD were extracted from all three datasets and submitted to water refinement with the HADDOCK webserver v2.222 as previously described23,24, with the goal to optimize interface geometry and energetics. Briefly, ACE2/RBD heterodimers without glycans but in the presence of Zn2+ were uploaded to the HADDOCK refinement interface and submitted with default parameters. Weighting for the sorting of structures (scoring) after water explicit refinement25,26,27 were set for van der Waals energy (EvdW), Electrostatic (Coulombic) energy (Eelec), Buried Surface Area (BSA), Interaction energy (dEint) and Desolvation energy (Edesolv) to 1.0, 0.2, 0.0, 0.0 and 1.0, respectively25.
Data Records
Figshare and SBGrid
Structure files and associated data of human ACE2 variants in complex with SARS-CoV-2 RBD generated in this work have been deposited in Figshare28. The same data have also been deposited in SBGrid29.
Two folders are shared, (a) 6M0J for the models derived from the crystal structure30 and (b) 6M17 for the models derived from the cryo-EM structure11. In each folder the following subdirectories are placed: variants, ALA_scan, and UniProt, and specifically for 6M17, an additional subdirectory is included, PyMOL_models_6M17. This directory includes .pdb and .cif files of variants which were created by considering the complete cryo-EM model, with cofactors (ions, sugars) and all interfaces. In addition, the initial .pdb files that were used to produce all reported variants are placed in each folder (6M0J_chains_AE.pdb or 6M17_chains_BE.pdb).
For the common subdirectories (variants, ALA_scan, UniProt), structure is as follows: The subdirectory variants contains data for ACE2 residue variants naturally occurring in the human population16, UniProt contains data for variants with in vitro mutations reported in the literature17,18,19,20, and ALA_scan contains data for variants resulted from the performance of computational alanine scanning mutagenesis at the interface of SARS-CoV-2 RBD and the human ACE2 receptor.
In detail, each subdirectory (variants, ALA_scan, UniProt) includes three files: the results file after the HADDOCK refinement22 (.html file), the parameter file that was used for the structure calculation (.web), and the top scoring refined structure file (.pdb file).The user can reproduce any run by uploading the.web file using the online server (https://haddock.science.uu.nl/services/HADDOCK2.2/haddockserver-file.html).
The nomenclature of each file in subdirectories variants, ALA_scan and UniProt corresponds to XXXX_R1NUMR2. XXXX stands for the PDB ID from which the model was extracted, R1 is the one-letter residue code of the native residue of the ACE2 receptor, NUM is the residue number according to the Uniprot sequence of human ACE2 receptor and R2 is the one-letter residue code of the variant to which the residue R1 was changed. Results of the energetic calculations with HADDOCK for each generated variant of the complex are summarized in Online-only Table 1, and Tables 1 and 2.
Github
An online structure viewer of the resulting models from all refinement runs and their energetics is available at: https://kastritislab.github.io/human-ace2-variants/. The structure viewer allows the user to visualize interface contacts, compare structural information, and be informed about the corresponding energetics for any model reported in this work.
Technical Validation
Data redundancy and structural mapping
Variants in the 3 datasets are distinct, showing minor overlap in terms of amino acid substitution (Fig. 2a). The computational alanine scanning shows a minor overlap with reported mutagenesis studies, where only 13% of the total mutations can be found in both datasets. In addition, only 1 out of the 39 in vitro designed ACE2 variants can be found in the human population (Fig. 2a). Mutations from missense variants are distributed across the entire ACE2 surface (Fig. 2b), including the interfaces with the SARS-CoV-2 RBD and B0AT1 partners11 (Fig. 2c). This structural mapping highlights the usefulness of ACE2 variants for structure-based design, as different residues affect the physical-chemical parameters of the receptor, and consequently, its underlying affinity towards different protein-protein interactions.

Overview of the datasets used in the study with a focus on the localization of naturally occurring ACE2 variants in the human population. (a) Venn diagram showing the variability of sequence variants among the 3 different datasets assembled in this study. (b) structure-based mapping of missense variants on the wild-type ACE2 in complex with the SARS-CoV-2 RBD, in the presence of the B0AT1 complex11. Variants are distributed on the surface of the complex. (c) Measurement of distances of all mappable missense variants and report of the variants close to the different interfaces identified in the cryo-EM model of ACE2 in complex with the SARS-CoV-2 RBD, in the presence of the B0AT1 complex11.
Stereochemical quality
The stereochemical quality of derived models of ACE2 variants is of equivalent quality as their template structures, since we performed mostly single amino acid substitutions and refined them using restrained molecular dynamics simulations in explicit water26. This protocol is well-known to improve the quality of experimental structures and docking models26,27.
Modeling from different templates
To assess the consistency of the HADDOCK water refinement protocol, we additionally constructed homology models using the crystal structure of the ACE2 in complex with the SARS-CoV-2 RBD30. Although the root-mean-square deviation (RMSD) between the Cα atoms of the residues from the two calculated structures is low (RMSD = 1.054 Å), we observed high variability in rotamer states, in particular for interface residues. The buried surface area (BSA, Å2) of both structures is within the distribution of BSAs for transient protein-protein interactions with known affinities24 (Fig. 3a). Interestingly, the crystallographic structure and designed variants have larger BSA as compared to the cryo-EM counterparts (Fig. 3a). This is expected since structures determined by X-ray diffraction are more tightly packed due to the crystal state of the protein. In contrast, the cryo-EM interface is smaller, likely because the specimen was captured in vitreous ice and was free in solution. In addition, model building during cryo-EM map interpretation is performed within an averaged Coulomb electrostatic potential map, which may lead to low resolution or absent densities in flexible regions and, therefore, less tight interface packing.

HADDOCK refinement of ACE2 variants in complex with the S-protein using the crystal structure (PDB ID: 6M0J) or the cryo-EM structure (PDB ID: 6M17) as reference. (a) On the left, calculation of buried surface area (Å2) for the crystal (top, 6M0J) and the cryo-EM structure (middle, 6M17) for all mappable variants and their comparison to the BSA of transient protein-protein interactions with known binding affinities (bottom, Dataset)24. On the right, a zoom into the distribution of BSA of both derived benchmarks, highlighting the method-specific packing of the interface area. (b) Desolvation energy against HADDOCK score for all variants calculated using the cryo-EM structure as an initial model, showing a high contribution of this energy to the overall HADDOCK scoring. (c) The same as (B) but using the crystal structure of the complex as an initial structure for subsequent HADDOCK refinement.
Consistency in energy calculations
Usage of these two templates for generating variants and performing energy calculations constitutes an independent test for the robustness of the refinement protocol. Overall, for all generated models, high values for the corresponding Pearson-product momentum correlation coefficients are observed for HADDOCK score and underlying desolvation energies (Fig. 3b–c). This shows that energetic components for the HADDOCK score in both structures have similar contributions, desolvation energy being the most dominant. Only favourable energies are calculated for the variants when using the crystallographic model as an initial structure (Fig. 3c), whereas both favourable and unfavourable energies are calculated for the variants using the cryo-EM model (Fig. 3b). This is due to the presence of both transmembrane and soluble domains of the ACE2 in the cryo-EM model, whereas the crystallographic model includes only soluble domains. Desolvation energies, therefore, reflect contributions of solvation in the structures, in the presence or absence of the transmembrane regions.
Overlap with external datasets
To identify systematically present variations in our datasets, we overlapped the reported variations for which we communicate the respective structural models with 3 additional datasets described below:
-
The experimental Procko dataset (PROCKO). A recent preprint tested affinity of 2,223 ACE2 missense mutants with the RBD of the S protein of SARS-CoV-2 after one round of selection31. Interestingly, overlap of those data with the 3 datasets described above is minor (78 common out of 242 mutations) (Fig. 4). In particular, overlap with genome variants is even lower (20 out of 141). This highlights the complexity underlying genome variation in the human population and the distinct evolutionary pressure of the ACE2 gene as compared to in vitro deep mutagenesis experiments. Still, our structural models for the 20 overlapping mutations which have available affinity values (S19P, E23K, K26R, E37K, F40L, N64K, M82I, G326E, E329G, G352V, H378R, M383T, Q388L, P389H, T445M, I446M, F504I, F504L, S511P, R514G) can act as a starting point for further characterization.
Fig. 4 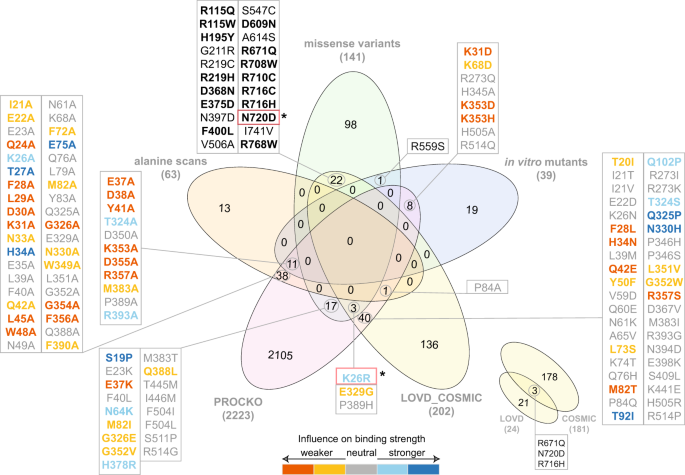
Venn diagram of datasets analyzed in this study. Overlap of datasets used for structural modeling (alanine scans, missense variants and in vitro mutants) with experimental deep scanning mutagenesis data (PROCKO31) and external datasets is shown. External datasets include open-access data deposited in LOVD 3.0 (https://www.lovd.nl) from COVID-19 patients and COSMIC32 from cancer patients. Overlapping mutations with in vitro determined interaction strength from deep scanning mutagenesis data31 are color-coded according to binding strength. Mutations in red boxes (N720D, K26R) are found in COVID-19 patients35. Mutations shown in bold font on the top represent common variants in both COSMIC and gnomAD ACE2 variants.
-
ACE2 mutations from cancer patients derived from COSMIC v9132. Due to the higher risk of severe COVID-19 symptoms manifesting in cancer patients33, we have specifically focused on retrieving genetic variants of ACE2 available in COSMIC v9132 (Fig. 4). Interestingly, 15 genetic variants reported in gnomAD (R115Q, R115W, H195Y, R219H, D368N, E375D, F400L, D609N, R671Q, R708W, R710C, R716H, R716C, N720D, R768W) are also identified in cancer patients (Fig. 4, shown in bold). This result provides a hypothesis on the role of these mutations in SARS-CoV-2 infection to be further investigated.
-
ACE2 mutations from COVID-19 patients included in LOVD 3.034 (Fig. 4). LOVD 3.0 reports additional variants for the ACE2 receptor and includes the N720D mutation which has been identified as a variant in COVID-19 patients in the Italian population35. N720D is found in genomic data (gnomAD), cancer (COSMIC v91) and COVID-19 patients (LOVD 3.0). Another ACE2 protein variation identified in COVID-19 patients is the K26R, which is also included in the gnomAD data, but not in cancer patients. This mutation has been successfully expressed by Procko31 and appears to increase binding affinity for the RBD of the S protein (Fig. 4). Interestingly, our respective 3D interaction model shows one of the lowest HADDOCK scores (−108.9 ± 5.1 a.u.), strongest van der Waals interactions (−57.8 ± 5.6 kcal.mol−1) and most favourable desolvation energy (−11.4 ± 7.9 kcal.mol−1) compared to all other analyzed mutations (Online-only Table 1). Considering the communicated correlation of HADDOCK score components with binding affinities for 144 protein-protein interactions24, the above-mentioned calculated energetic values corroborate the Procko results on the increased affinity for K26R, and therefore, possible higher infectivity of SARS-CoV-2. This is also corroborated by our distance calculations showing that K26R is only ~10 Å away from the interaction interface (Fig. 2).

References
Li, Q. et al. Early Transmission Dynamics in Wuhan, China, of Novel Coronavirus-Infected Pneumonia. N Engl J Med 382, 1199–1207, https://doi.org/10.1056/NEJMoa2001316 (2020).
Huang, C. et al. Clinical features of patients infected with 2019 novel coronavirus in Wuhan, China. Lancet 395, 497–506, https://doi.org/10.1016/S0140-6736(20)30183-5 (2020).
Cui, J., Li, F. & Shi, Z. L. Origin and evolution of pathogenic coronaviruses. Nat Rev Microbiol 17, 181–192, https://doi.org/10.1038/s41579-018-0118-9 (2019).
Coronaviridae Study Group of the International Committee on Taxonomy of, V. The species Severe acute respiratory syndrome-related coronavirus: classifying 2019-nCoV and naming it SARS-CoV-2. Nat Microbiol 5, 536–544, https://doi.org/10.1038/s41564-020-0695-z (2020).
Belouzard, S., Millet, J. K., Licitra, B. N. & Whittaker, G. R. Mechanisms of coronavirus cell entry mediated by the viral spike protein. Viruses 4, 1011–1033, https://doi.org/10.3390/v4061011 (2012).
Hoffmann, M. et al. SARS-CoV-2 Cell Entry Depends on ACE2 and TMPRSS2 and Is Blocked by a Clinically Proven Protease Inhibitor. Cell 181, 271–280 e278, https://doi.org/10.1016/j.cell.2020.02.052 (2020).
Tai, W. et al. Characterization of the receptor-binding domain (RBD) of 2019 novel coronavirus: implication for development of RBD protein as a viral attachment inhibitor and vaccine. Cell Mol Immunol 17, 613–620, https://doi.org/10.1038/s41423-020-0400-4 (2020).
Walls, A. C. et al. Structure, Function, and Antigenicity of the SARS-CoV-2 Spike Glycoprotein. Cell 181(281-292), e286, https://doi.org/10.1016/j.cell.2020.02.058 (2020).
Wrapp, D. et al. Cryo-EM structure of the 2019-nCoV spike in the prefusion conformation. Science 367, 1260–1263, https://doi.org/10.1126/science.abb2507 (2020).
Shang, J. et al. Structural basis of receptor recognition by SARS-CoV-2. Nature 581, 221–224, https://doi.org/10.1038/s41586-020-2179-y (2020).
Yan, R. et al. Structural basis for the recognition of SARS-CoV-2 by full-length human ACE2. Science 367, 1444–1448, https://doi.org/10.1126/science.abb2762 (2020).
Ali, F., Elserafy, M., Alkordi, M. H. & Amin, M. ACE2 coding variants in different populations and their potential impact on SARS-CoV-2 binding affinity. bioRxiv, 2020.2005.2008.084384, https://doi.org/10.1101/2020.05.08.084384 (2020).
Hussain, M. et al. Structural variations in human ACE2 may influence its binding with SARS-CoV-2 spike protein. J Med Virol https://doi.org/10.1002/jmv.25832 (2020).
Chen, Y. Y. et al. Relationship between genetic variants of ACE2 gene and circulating levels of ACE2 and its metabolites. J Clin Pharm Ther 43, 189–195, https://doi.org/10.1111/jcpt.12625 (2018).
Madjid, M., Safavi-Naeini, P., Solomon, S. D. & Vardeny, O. Potential Effects of Coronaviruses on the Cardiovascular System: A Review. JAMA Cardiol, https://doi.org/10.1001/jamacardio.2020.1286 (2020).
Karczewski, K. J. et al. The mutational constraint spectrum quantified from variation in 141,456 humans. Nature 581, 434–443, https://doi.org/10.1038/s41586-020-2308-7 (2020).
UniProt, C. UniProt: a worldwide hub of protein knowledge. Nucleic Acids Res 47, D506–D515, https://doi.org/10.1093/nar/gky1049 (2019).
Han, D. P., Penn-Nicholson, A. & Cho, M. W. Identification of critical determinants on ACE2 for SARS-CoV entry and development of a potent entry inhibitor. Virology 350, 15–25, https://doi.org/10.1016/j.virol.2006.01.029 (2006).
Li, W. et al. Receptor and viral determinants of SARS-coronavirus adaptation to human ACE2. EMBO J 24, 1634–1643, https://doi.org/10.1038/sj.emboj.7600640 (2005).
Rushworth, C. A., Guy, J. L. & Turner, A. J. Residues affecting the chloride regulation and substrate selectivity of the angiotensin-converting enzymes (ACE and ACE2) identified by site-directed mutagenesis. FEBS J 275, 6033–6042, https://doi.org/10.1111/j.1742-4658.2008.06733.x (2008).
The PyMOL Molecular Graphics System v. 2.3.2, Schrödinger, LLC.
van Zundert, G. C. P. et al. The HADDOCK2.2 Web Server: User-Friendly Integrative Modeling of Biomolecular Complexes. J Mol Biol 428, 720–725, https://doi.org/10.1016/j.jmb.2015.09.014 (2016).
Kastritis, P. L. & Bonvin, A. M. Are scoring functions in protein-protein docking ready to predict interactomes? Clues from a novel binding affinity benchmark. J Proteome Res 9, 2216–2225, https://doi.org/10.1021/pr9009854 (2010).
Kastritis, P. L., Rodrigues, J. P., Folkers, G. E., Boelens, R. & Bonvin, A. M. Proteins feel more than they see: fine-tuning of binding affinity by properties of the non-interacting surface. J Mol Biol 426, 2632–2652, https://doi.org/10.1016/j.jmb.2014.04.017 (2014).
Vangone, A. et al. Sense and simplicity in HADDOCK scoring: Lessons from CASP-CAPRI round 1. Proteins 85, 417–423, https://doi.org/10.1002/prot.25198 (2017).
Linge, J. P., Williams, M. A., Spronk, C. A., Bonvin, A. M. & Nilges, M. Refinement of protein structures in explicit solvent. Proteins 50, 496–506, https://doi.org/10.1002/prot.10299 (2003).
Kastritis, P. L., Visscher, K. M., van Dijk, A. D. & Bonvin, A. M. Solvated protein-protein docking using Kyte-Doolittle-based water preferences. Proteins 81, 510–518, https://doi.org/10.1002/prot.24210 (2013).
Sorokina, M. et al. HADDOCK refined models of ACE2 with the bound RBD of SARS-CoV-2 Spike glycoprotein. figshare https://doi.org/10.6084/m9.figshare.12458591 (2020).
Sorokina, M. et al. HADDOCK refined models of ACE2 with the bound RBD of SARS-CoV-2 Spike glycoprotein. SBGrid https://doi.org/10.15785/SBGRID/791 (2020).
Lan, J. et al. Structure of the SARS-CoV-2 spike receptorbinding domain bound to the ACE2 receptor. Nature 581(7807), 215–220, https://doi.org/10.1038/s41586-020-2180-5 (2020).
Procko, E. The sequence of human ACE2 is suboptimal for binding the S spike protein of SARS coronavirus 2. bioRxiv, https://doi.org/10.1101/2020.03.16.994236 (2020).
Forbes, S. A. et al. The Catalogue of Somatic Mutations in Cancer (COSMIC). Curr Protoc Hum Genet Chapter 10, Unit 10 11, https://doi.org/10.1002/0471142905.hg1011s57 (2008).
Liang, W. et al. Cancer patients in SARS-CoV-2 infection: a nationwide analysis in China. Lancet Oncol 21, 335–337, https://doi.org/10.1016/S1470-2045(20)30096-6 (2020).
Fokkema, I. F. et al. LOVD v.2.0: the next generation in gene variant databases. Hum Mutat 32, 557–563, https://doi.org/10.1002/humu.21438 (2011).
Benetti, E. et al. ACE2 gene variants may underlie interindividual variability and susceptibility to COVID-19 in the Italian population. Eur J Hum Genet, https://doi.org/10.1038/s41431-020-0691-z (2020).
Acknowledgements
This work was supported by the Federal Ministry for Education and Research (BMBF, ZIK program) [grant number 03Z22HN23 (to P.L.K.)]; the European Regional Development Funds for Saxony-Anhalt [grant number EFRE: ZS/2016/04/78115 (to P.L.K.)], the Deutsche Forschungsgemeinschaft (DFG, German Research Foundation), RTG 2467, project number 391498659 (to P.L.K.), R.G.C.C. International GmbH (to M.S.), BioSolutions GmbH (to M.S.) and the Martin Luther University Halle-Wittenberg. Open access funding provided by Projekt DEAL.
Author information
Authors and Affiliations
Contributions
All authors conceived and designed the project, performed data analysis and wrote the manuscript. P.L.K. supervised the project.
Corresponding author
Ethics declarations
Competing interests
I.P. is the founder and director of R.G.C.C. International GmbH. RP is the founder and director of BioSolutions Halle GmbH. MS is supported by both R.G.C.C. International GmbH and BioSolutions GmbH. The authors declare that they have no competing interests.
Additional information
Publisher’s note Springer Nature remains neutral with regard to jurisdictional claims in published maps and institutional affiliations.
Online-only Table
Rights and permissions
Open Access This article is licensed under a Creative Commons Attribution 4.0 International License, which permits use, sharing, adaptation, distribution and reproduction in any medium or format, as long as you give appropriate credit to the original author(s) and the source, provide a link to the Creative Commons license, and indicate if changes were made. The images or other third party material in this article are included in the article’s Creative Commons license, unless indicated otherwise in a credit line to the material. If material is not included in the article’s Creative Commons license and your intended use is not permitted by statutory regulation or exceeds the permitted use, you will need to obtain permission directly from the copyright holder. To view a copy of this license, visit http://creativecommons.org/licenses/by/4.0/.
The Creative Commons Public Domain Dedication waiver http://creativecommons.org/publicdomain/zero/1.0/ applies to the metadata files associated with this article.
About this article

Cite this article
Sorokina, M., M. C. Teixeira, J., Barrera-Vilarmau, S. et al. Structural models of human ACE2 variants with SARS-CoV-2 Spike protein for structure-based drug design. Sci Data 7, 309 (2020). https://doi.org/10.1038/s41597-020-00652-6
Received:
Accepted:
Published:
DOI: https://doi.org/10.1038/s41597-020-00652-6
This article is cited by
-
Characterization of ACE2 naturally occurring missense variants: impact on subcellular localization and trafficking
Human Genomics (2022)
-
The role of angiotensin-converting enzyme 2 (ACE2) genetic variations in COVID-19 infection: a literature review
Egyptian Journal of Medical Human Genetics (2022)
-
Hydrophobic Residues Confer the Helicity and Membrane Permeability of Ocellatin-1 Antimicrobial Peptide Scaffold Towards Therapeutics
International Journal of Peptide Research and Therapeutics (2021)
