
Abstract
The FLOTROP dataset contains numerous plant observations (around 340,000 occurrences) in northern tropical Africa (from the 5th to 25th parallel north) in open ecosystems (savannah and steppe). They were collected by multiple collectors between 1920 and 2012 and were managed by Philippe Daget. These observations are probably the most important and unique source of plant distribution over the Sahel area. The data are now available in the Global Biodiversity Information Facility, Tela Botanica website, and as maps in the African Plant Database. For the overall area involved, this dataset has increased by 40% the data available in the GBIF. For some countries between the 15th and 21st parallel north, the FLOTROP dataset has increased available occurrences 10-fold compared to the data existing in the GBIF.
Design Type(s) | data integration objective • biodiversity assessment objective • data collection and processing objective |
Measurement Type(s) | Plants |
Technology Type(s) | digital curation |
Factor Type(s) | species • geographic location • temporal_interval |
Sample Characteristic(s) | Viridiplantae • North Africa |
Machine-accessible metadata file describing the reported data (ISA-Tab format)
Background & Summary
Tropical northern Africa (herein defined as between the 5th and 25th parallel north) is mostly occupied by open ecosystems, such as steppe and savannah1. The vegetation in these ecosystems is consumed by animals2, either wildlife or livestock, and is also used by the local communities for food, energy or medicinal purposes3. The open ecosystems in tropical northern Africa are of great importance for the economy, food security and human well-being.
Plant diversity within these ecosystems is driven by many factors, such as the climate, soil, fire and grazing4,5. Plant diversity in these regions is being greatly impacted by global change6,7,8. Historical data are needed to understand species and diversity dynamics. The database presented in this work is the collection of numerous datasets gathered over the years.
At the outset, the FLOTROP database was intended to store all the data recorded by IEMVT (French institute for tropical livestock production and veterinary medicine, now part of CIRAD) in the sixties. In 1993, CIRAD and CNRS set up a project to collect a maximum of botanical surveys within these regions9,10,11.
Two software packages were created by the team to manage the database. The first was created under DOS then a second was started under Windows using the APL DYALOG language. Data were gathered and scanned between 1993 and 2016. We extracted the data from the software version. We shared the species occurrences recorded in the database on the Tela Botanica website (http://www.tela-botanica.org/) and in the GBIF database12. The dataset is available following this link: https://doi.org/10.15468/oxunf1.
Methods
Original data collection in the FLOTROP software
The different data were collected by the FLOTROP team, mostly Philippe Daget. Botanical surveys were collected from different sources: direct contact with the authors of the survey, collection of data from the supplementary materials of Masters or PhD theses, technical reports on research or development projects, books, etc. A large share of the survey was only available on paper and most of the collection work was to convert those data to digital format.
All the observations are geotagged. For most of the survey, the coordinates were not recorded with a GPS. The coordinates were extrapolated using the location indicated in the surveys (i.e. name of the town, distance along the road from a known point, etc.) and a topographical map. The surveys without any geographical information were not included in FLOTROP. The survey protocols drawn up for the surveys were classed in 8 different categories:
-
1.
Phytosociological unweighted surveys: These surveys contained the list of species presented at one station on one date.
-
2.
Phytosociological weighted surveys: These surveys contained the list of species. For each species, the authors gave a Braun Blanquet score13.
-
3.
Ecological surveys with species cover. These surveys contained all the species and their relative soil covers assessed using the Daget-Poissonet method14.
-
4.
Ecological surveys with species contributions. These surveys contained all the species and their relative contributions to the plant cover assessed using the Daget-Poissonet method14.
-
5.
Dominant species surveys. These surveys contained all the dominant species of the plant communities.
-
6.
Ecological surveys with the number of individuals. In these surveys, the number of individuals per species was recorded.
-
7.
Botanical occurrences. In this protocol, only one or a few species in the vegetation were recorded.
-
8.
Surveys in experimental fields. These surveys were carried out in experimental fields.
During all this collection work, the taxonomic referential was harmonized to the Lebrun Referential15.
Extraction, clean up and dissemination of the bases
In 2016, we extracted all the surveys from the FLOTROP software coded in APL DYALOG, and transformed the information into a more available format (.txt format, thus access format).
We found various errors in the database due to encoding problems during extractions: a mismatch between the protocol used and the way that abundance was coded, an inversion between the abundance and the number of species, and some surveys that were mostly only a list of species but were extracted as a survey with abundance. In this case, for half of the species, the number of species was inserted in the abundance columns.
We ran several tests to check for such errors. “Surveys containing such an error were flagged up”:
-
(1)
In the surveys with a Braun Blanquet score, the abundances could only be coded as 0, 1, 2, 3, 4 or 5. Otherwise, the surveys for this protocol that had abundance values different from these five were considered problematic and were not published.
-
(2)
In the surveys with species cover or a contribution estimation (protocols 3 and 4), the abundance estimation could not be over 100 (as 100% of the vegetation). The surveys that contained at least one species with an abundance over 100% were flagged up as problematic.
-
(3)
For all the surveys, if the species number and abundance were both over 100%, we assumed that it was probably a situation where the species number was placed in both the abundance and in the species number.
-
(4)
In the surveys with species cover or a contribution estimation (protocols 3 and 4), we flagged up the surveys where the sum of abundances was over 100%.
These different flags did not necessarily mean that the survey was problematic, but it was a good indicator. For the time being, we have not included any surveys that were flagged up and have only published surveys that did not have these errors.
We plan to review all the flagged up, and possibly corrected, surveys. This second database will be issued at a later date and the abundance estimators will also be included in this second release.
We chose to update the species referential with the African Plant Database (APD), which is widely accepted for African studies and recommended by the Association of the Taxonomic Study of the Flora of Tropical Africa (AETFAT). The comparison between the FLOTROP and APD names used a Fuzzy Lookup process (Ms Excel add-in). The analysis was carried out on one field containing full names (species with authors), with a threshold over 75%. As a comparison of 8,337 × 250,000 matrix names induced computer difficultly, an initial comparison was made with only North African names and then with tropical names. About 800 names were visually checked because the similarity was very low (between 075–0.95%), and 70 names concerning introduced species where added to APD. However, for 18 species out of the 8,337 species described in the FLOTROP list, we did not find any correspondence with the APD database. These names were probably transcription errors or confused species in the different Floras, for which finding the right name is quite impossible. In these cases, the species were entered into the database with the name selected in the FLOTROP database. The information of the name referential is put in the identificationRemarks.
For most of the surveys, the occurrences of species were also associated with an estimation of their abundance (either a percentage or Braun Banquet score, or individual counts). We only entered the occurrences. The different estimations of species abundances are available on request by email.
Data Records
This dataset was included in The Global Biodiversity Information Facility (GBIF)16. The data were also shared on the e-Flora of Tela Botanica (www.tela-botanica.org). The base included 342,698 occurrences for plant species in the African region between the 5th and 25th parallel north. In order to compare these datasets with the existing data shared in the GBIF, we extracted from the GBIF website, on 28 July 2017 (www.GBIF.org)12, all the species occurrences within geographical coordinates between the 5th and 25th parallel north and between longitudes 20°W and 52°E. We did not download the occurrences that were obtained from a fossil sample. From all these occurrences, we only selected the species within African countries contained in the FLOTROP area (list of countries in Table 1). In all, 801,900 plant occurrences are already present (without fossil specimens). The FLOTROP database will increase the GBIF base by 43% for the area as a whole.
Several variables are presented for each occurrence:
Regarding the way data are downloaded on the GBIF site (Source data or GBIF archive), some numbers presented here may vary (especially for the taxonomic description). The number here corresponds to the source data file.
-
(1)
Basis of record: All the surveys were made based on human observation. On some occasions, herbarium samples were collected and were conserved in different herbariums, such as the ALF herbarium17 (http://publish.plantnet-project.org/project/herbieralf).
-
(2)
The date of the observation (event Date): All the surveys are dated. However, for some surveys only the year was known. In this case, the date of the survey is 1st January of that year. Similarly, for some surveys the month and the year of the survey were known but not the day, so in this case the date of the survey is the first of the month. Figure 1 and Table 2 present the temporal distribution of the data per decade. The oldest observation in the FLOTROP database is from 1930. The data in FLOTROP mostly fall within the 1960–2000 period. The decade with the most data is the seventies, followed by the eighties. Severe drought events occurred during these two decades, especially in West Africa.
Fig. 1 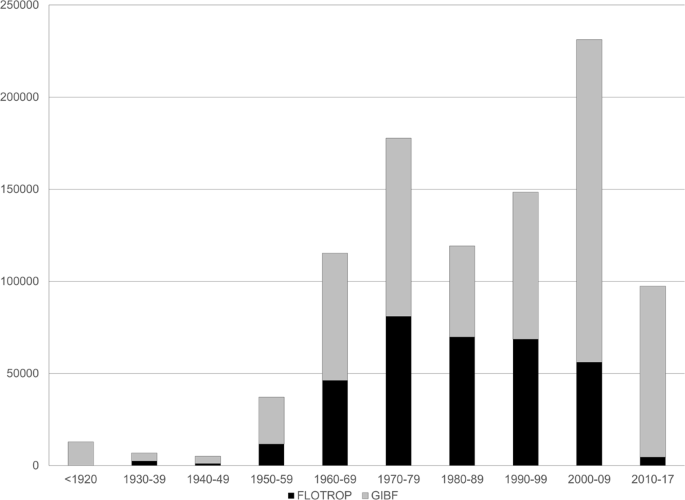
Temporal distribution of species occurrence in the FLOTROP database. Each bar represents the total number of occurrences now available in GBIF by decades. (In black the addition from FLOTROP and in grey the occurrences previously available in GBIF).
Table 2 Temporal distribution of FLOTROP and GBIF data by decades. The percentage increase in data is specified. -
(3)
The country (country Code): The country is coded following the ISO 3166 guidelines. Regarding the distribution by country, in Table 1, we have presented the number of occurrences in the FLOTROP database by country and by the data currently available in the GBIF database. The contribution of FLOTROP is quite consequent for Sahel countries (increasing by 1000% the data available for Chad, 600% for Mali and Mauritania, 500% for Niger, 300% for Senegal and 100% for Burkina Faso and Sudan (including South Sudan)) and for two small countries that are not well documented, Cape Verde and Djibouti. For the southern area of the Saharan countries, the contribution of FLOTROP is also substantial, increasing the GBIF data by 12% for Egypt and 197% for Algeria. The contribution of FLOTROP is low for eastern Africa (an increase of only 3% of the GBIF data for Ethiopia) and for humid tropical western Africa. In tropical western Africa, the main ecosystem is tropical rainforest and FLOTROP only contains plant observations made in open ecosystems.
-
(4)
The coordinates of the observation (decimal Latitude and decimal Longitude): All the surveys are geotagged with an accuracy to the minute (around 1.83 km in these regions). The coordinates are written in decimal for the latitude and the longitude. The climate within these African countries is highly variable from desert to tropical forest in Chad, for example. The North-South gradient in that country is a good indicator of the annual rainfall, especially in western Africa (dry climate in the North and wet climate in the South). Table 3 and Fig. 2 show the plant species observation number in FLOTROP and GBIF for each parallel. Between the 11th and 25th parallel, the inclusion of FLOTROP in GBIF will at least double the data (for the 11th parallel) or increase the data 19-fold (21st parallel). FLOTROP will thus amount to unique data on the drylands of sub-Saharan Africa. All the coordinates are in WGS 84. Figure 3 is a map of the density of occurrence of these species.
Table 3 Distribution between the different latitudes of plant occurrences in the FLOTROP and GBIF databases. The percentage due to the inclusion of FLOTROP in GBIF is calculated in the last column. Fig. 2 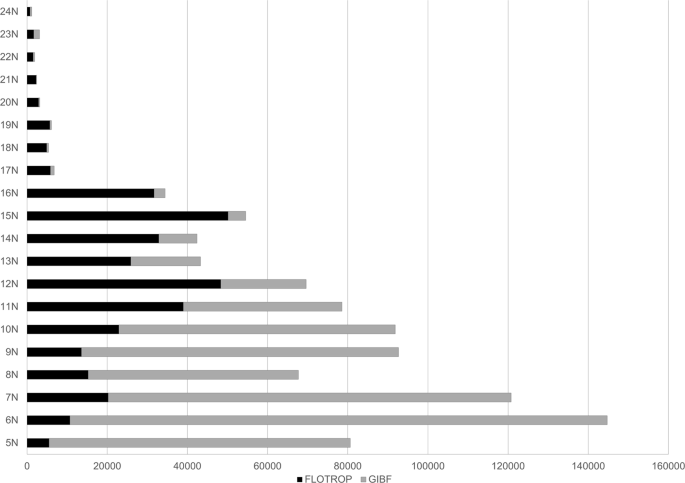
Latitudinal distribution of species occurrence in the FLOTROP database. Each bar represents the total number of occurrences now available in GBIF or the different parallels from the 5th parallel N to the 25th parallel N. (In black the addition from FLOTROP and in grey the occurrences previously available in GBIF).
Fig. 3 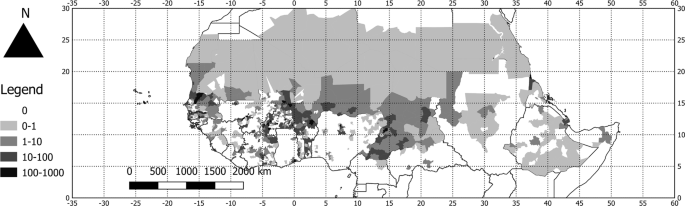
Map of the density of species occurrence in the FLOTROP dataset. number of occurrences per 100 km² for the different administrative units in the FLOTROP region.
-
(5)
The name of species (scientific Name and taxon Rank): In all, 4,372 species are presented in the FLOTROP database, of which 64 species have more than 1,000 occurrences in the base. Figure 4 shows the number of occurrences for the 19 species that have more than 2,000 occurrences in the FLOTROP base and the number of occurrences that were previously in the GBIF base for the same region. Most of the species are at species level some only at genus level.
Fig. 4 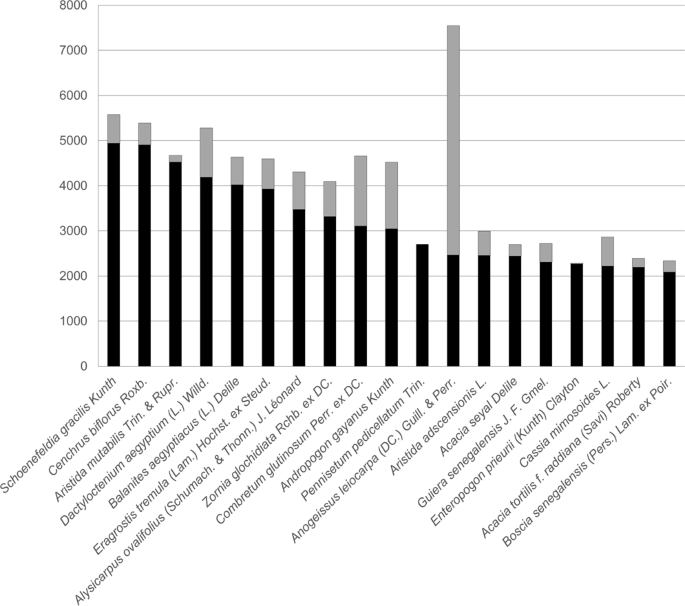
Number of occurrences for the most frequent species in FLOTROP. Each bar represents the total number of occurrences now available in GBIF for 19 species with more than 2,000 occurrences in the FLOTROP database (in black the addition from FLOTROP and in grey the occurrences previously available in GBIF).
-
(6)
The name of the observer (recorded By): The authors of these different surveys are specified in the metadata. Only the last names of the authors are indicated in the database. In a few surveys, the author was not identified and was coded by an x. The FLOTROP database contains data obtained from 222 known different authors. The two authors who contributed most to the base are Jean Valenza and Bernard Toutain, with almost 30,000 observations in the base.
-
(7)
Flotrop survey number (record Number): In the FLOTROP database, the observations have been regrouped per survey (observation of species together). The observations are in fact regrouped in 26,932 different surveys.
-
(8)
Occurrence Remarks: We add the original survey methods in remarks.
Survey protocols are classed in 8 different categories. These protocols are coded from 1 to 8. Most of the data come from method 2, Phytosociological Weighted Surveys (262,270 occurrences). In all, 40,768 occurrences were obtained with Phytosociological Unweighted Surveys (method 1). The other method concerned fewer than 20,000 occurrences (see Methods for a full description of the methods).
-
(9)
Identification Remarks: This column contains the referential name used for the species names (either APD; original Flotrop name). Name in the APD with a doubt were coded with APD*.


Technical Validation
Most of these field observations were connected by herbarium specimens validated by the IEMVT botanist, J.P. Lebrun, and now accessible in the CIRAD herbarium in Montpellier17 (about 50,000 specimens). Secondly, all the surveys included in the database were first assessed by Philippe Daget, who entered the surveys in the base according to their quality.
For the data obtained for FLOTROP, we carried out several tests to eliminate some encoding errors (see methods). We removed 90,000 occurrences for the upload, which will be corrected at a later date, based on expert knowledge.
The quantity of data is also a factor of quality: indeed, one species occurrence can be compared with the whole set of occurrences for the same species, to find out the distribution of any outliers.
Some of the original paper surveys included in the database are stored at CIRAD, in Montpellier. Where necessary, users can check the original if they need confirmation on the data.
Usage Notes
The data presented here are a collection of multiple data sources, so they need to be analysed, using appropriate statistical tools.
Users should remember that plant identification and taxonomy in Mauritania, Senegal, Mali and Niger are based on old Floras. Despite the large number of observations of this dataset and the updated nomenclature used, many species are only known by one or two specimens, sometimes without all the organs that are useful for good identification. New collections and observations are absolutely needed to confirm the identity or ecology of some complex taxa.
The occurrence data can be used in at least two types of studies:
-
(1)
Species distribution: Despite the fact that these data are not a full inventory of each country, for the main reason that they focus on herbaceous vegetation used for livestock or on potential economic species, they can be used to update national inventories or checklists, as in new Flora projects for Chad or Burkina Faso.
-
(2)
Species ecology: These data can be used to understand the ecology of a species and its spatial and temporal dynamics. Many different models and statistical analysis can be carried out to study species18,19. For the spatial distribution of the species, users must be aware that the climate varied considerably in the West Africa over the period7,8 (1950–2010) and they must therefore include temporal changes in their spatial analysis model.
-
(3)
Biodiversity studies: These data can be used to assess some biodiversity indicators, such as alpha, beta and gamma diversity. Open ecosystems are composed of herbaceous and tree species. However, in the FLOTROP database some surveys were only carried out on herbaceous species, or on tree species. However, this information was not specified during the collection of the data. We therefore suggest that users take care when using the data where some surveys contain only one type of plant species. Moreover, due to the temporal differences and spatial life cycle of tree species and herbaceous species, it may be better to analyse both types of communities separately.
Code Availability
No specific codes were used to produce the data presented.
References
Le Houerou, H. N. The rangelands of the Sahel. Journal of Range Management 41–46 (1980).
Assouma, M. et al. How to better account for livestock diversity and fodder seasonality in assessing the fodder intake of livestock grazing semi-arid sub-Saharan Africa rangelands. Livestock Science 216, 16–23 (2018).
Fortin, D., Lô, M., Maynart, G. & Arseneault, C. Plantes médicinales du Sahel. (AGRIS, 1990).
Hiernaux, P., de Leeuw, P. & Diarra, L. The interactive effects of rainfall, nutrient supply and defoliation on the herbage yields of Sahelian rangelands in north-east Mali. In Proceedings of the International Conference on Livestock and Sustainable Nutrient Cycling in Mixed Farming Systems of Sub-Saharan Africa. (Addis Ababa, Ethiopia, 1995).
Hiernaux, P. Effects of grazing on plant species composition and spatial distribution in rangelands of the Sahel. Plant Ecology 138, 191–202 (1998).
Sinclair, A. & Fryxell, J. The Sahel of Africa: ecology of a disaster. Canadian Journal of Zoology 63, 987–994 (1985).
L’hote, Y., Mahé, G., Somé, B. & Triboulet, J. P. Analysis of a Sahelian annual rainfall index from 1896 to 2000; the drought continues. Hydrological Sciences Journal 47, 563–572 (2002).
Nicholson, S. E. The West African Sahel: A review of recent studies on the rainfall regime and its interannual variability. ISRN Meteorology 2013 (2013).
Tacher, G. Le projet FLOTROP au Cirad-emvt. Flotrop Info 1, 1–2 (1993).
Daget, P. & Gaston, A. Flotrop: constitution d’une base de données sur les pâturages d’Afrique tropicale septentrionale. Science et changements planétaires/Sécheresse 10, 183–189 (1999).
Daget, P. “FLOTROP”, une base de données agropastorales sur l’Afrique tropicale au CIRAD-EMVT. Journal of Tropical Livestock Science 48, 281–282 (1995).
GBIF.org. GBIF Occurrence Download, https://doi.org/10.15468/dl.utgo4l (2017).
Braun-Blanquet, J. Plant sociology: The study of plant communities. 1st edn (McGraw-Hill Book Company, inc., 1932).
Daget, P. & Poissonet, J. Une méthode d’analyse phytologique des prairies. Annales Agronomiques 22, 5–41 (1971).
Lebrun, J. Enumération des plantes à fleurs d’Afrique tropicale. (Conservation du jardin botanique de Genève, 1997).
Taugourdeau, S. & Daget, P. The Global Biodiversity Information Facility, https://doi.org/10.15468/oxunf1 (2018).
Daget, P. & Frohlich, C. L’herbier ALF en ligne. Systematics and Geography of Plants 71, 363–366 (2001).
Pearson, R. G. Species’ distribution modeling for conservation educators and practitioners. Synthesis. American Museum of Natural History 50, 54–89 (2007).
Elith, J. & Leathwick, J. R. Species distribution models: ecological explanation and prediction across space and time. Annual Review of Ecology, Evolution, and Systematics 40 (2009).
Acknowledgements
We should like to thank all the authors who contributed to the database and agreed to share their data. We also thank Sylvestre Georgis for his work during his Masters internship. We thank Peter Biggins for the proofreading. This work was funded by a CIRAD internal project (AI CRESI Pat_Dy_veg).
Author information
Authors and Affiliations
Contributions
S.T. wrote the paper, cleaned up the data and compared the data between FLOTROP and GBIF. P.D. was the original creator of the FLOTROP database and collected and harmonized all the data. X.J. extracted the data from the FLOTROP software and transformed it into an Access format. C.C. updated the FLORTROP referential to that of Geneva. D.M., J.H. and A.I. were the initiators of the format transfer and the open access of these data, and they helped to draft the paper.
Corresponding author
Ethics declarations
Competing Interests
The authors declare no competing interests.
Additional information
Publisher’s note: Springer Nature remains neutral with regard to jurisdictional claims in published maps and institutional affiliations.
ISA-Tab metadata file
Rights and permissions
Open Access This article is licensed under a Creative Commons Attribution 4.0 International License, which permits use, sharing, adaptation, distribution and reproduction in any medium or format, as long as you give appropriate credit to the original author(s) and the source, provide a link to the Creative Commons license, and indicate if changes were made. The images or other third party material in this article are included in the article’s Creative Commons license, unless indicated otherwise in a credit line to the material. If material is not included in the article’s Creative Commons license and your intended use is not permitted by statutory regulation or exceeds the permitted use, you will need to obtain permission directly from the copyright holder. To view a copy of this license, visit http://creativecommons.org/licenses/by/4.0/.
The Creative Commons Public Domain Dedication waiver http://creativecommons.org/publicdomain/zero/1.0/ applies to the metadata files associated with this article.
About this article

Cite this article
Taugourdeau, S., Daget, P., Chatelain, C. et al. FLOTROP, a massive contribution to plant diversity data for open ecosystems in northern tropical Africa. Sci Data 6, 118 (2019). https://doi.org/10.1038/s41597-019-0120-8
Received:
Accepted:
Published:
DOI: https://doi.org/10.1038/s41597-019-0120-8
This article is cited by
-
50 years of woody vegetation changes in the Ferlo (Senegal) assessed by high-resolution imagery and field surveys
Regional Environmental Change (2020)
