
Abstract
RNA G-quadruplex (rG4)-SELEX is a method that generates l-RNA aptamers to target an rG4 structure of interest, which can be applied to inhibit G-quadruplex-mediated interactions that have important roles in gene regulation and function. Here we present a Protocol Extension substantially modifying an existing SELEX protocol to describe in detail the procedures involved in performing rG4-SELEX to identify rG4-specific binders that can effectively suppress rG4–peptide and rG4–protein associations. This Protocol Extension improves the speed of aptamer discovery and identification, offering a suite of techniques to characterize the aptamer secondary structure and monitor binding affinity and specificity, and demonstrating the utility of the l-RNA aptamer. The previous protocol mainly describes the identification of RNA aptamers against proteins of interest, whereas in this Protocol Extension we present the development of an unnatural RNA aptamer against an RNA structure of interest, with the potential to be applicable to other nucleic acid motifs or biomolecules. rG4-SELEX starts with a random d-RNA library incubated with the l-rG4 target of interest, followed by binding, washing and elution of the library. Enriched d-aptamer candidates are sequenced and structurally characterized. Then, the l-aptamer is synthesized and used for different applications. rG4-SELEX can be carried out by an experienced molecular biologist with a basic understanding of nucleic acids. The development of rG4-targeting l-RNA aptamers expands the current rG4 toolkit to explore innovative rG4-related applications, and opens new doors to discovering novel rG4 biology in the near future. The duration of each selection cycle as outlined in the protocol is ~2 d.
Introduction
Guanine (G)-rich sequences of single-stranded DNA and RNA can fold into stable, intra- or intermolecular secondary structures called G-quadruplexes (dG4s and rG4s). These nucleic acid structure scaffolds are composed of stacks of G-quartets and can be further stabilized in the presence of monovalent ions, preferentially K+ or Na+ but not Li+1,2,3. Earlier findings have shown that G4s play important roles in various cellular events, including but not limited to DNA replication, DNA damage repair, transcription, translation, RNA metabolism and epigenetic remodeling3,4,5,6,7,8,9. The ability to regulate fundamental biological processes, as well as their chemically interesting structures, makes G4s promising targets for potential cancer, antimicrobial and antiviral treatments10,11,12,13,14,15,16,17,18,19. With the mounting interests in the biological role of G4s, more structure-specific, sensitive and low-cytotoxicity tools are needed to not only differentiate between G4s and duplexes, but also among different subtypes of G4s, to allow gene/transcript control and manipulation by selective targeting of specific G4 structure in any gene/transcript of interest.
Naturally occurring nucleic acids are homochiral and are built from the monomers of d-DNA and d-RNA nucleotides. Earlier studies have shown that d-DNA/RNA oligonucleotides are incapable of forming contiguous Watson–Crick base pairing with their enantiomeric counterparts, l-DNA/RNA oligonucleotides20. As they are unnatural, l-nucleic acids are unrecognizable by natural nucleases, which enables them to have extended half-lives for cellular and in vivo studies20. These special properties motivate researchers to develop various biological tools based on l-nucleic acids20. One of the common examples is an l-RNA aptamer, also known as a spiegelmer. Speigelmers, first reported by Furste and colleagues21,22, evolved from a modified version of systematic evolution of ligands through exponential enrichment (SELEX)23,24,25. To date, spiegelmers have been selected to recognize a range of targets, including small molecules, peptides and proteins20. In addition, a few spiegelmers are currently under clinical trial phases I or II26. Inspired by the earlier works of Sczepanski and Joyce to use spiegelmers to target canonical RNA structure motifs such as hairpin and stem-loop RNAs27,28, and also by the protocol of Lorenz et al. to use natural RNAs to target proteins of interest29, we were motivated to investigate whether such a strategy can be adopted, refined and generally applicable in developing a new class of targeting tool for noncanonical RNA structures such as rG4 motifs. The rationale behind structured RNA targeting spiegelmers is based on the non-Watson–Crick base-pairing principle of nucleic acids with opposite chirality. The experimental details shown below have been demonstrated and reported in our recent publications that employed (UUAGGG)4, which is part of the telomeric repeat-containing RNA (TERRA) sequence30, and the human telomerase RNA (hTERC rG4)31 as our targets, and in this Protocol Extension we have summarized this information as a protocol and resource for the scientific community.
Applications of the method
As we have successfully showcased the validity of rG4-SELEX using different rG4 targets in our proof-of-concept studies30,31, we believe this method can be a novel strategy to create highly specific, noncytotoxic and nuclease-resistant rG4-targeting probes. The unique tertiary interaction between each l-aptamer (l-Apt.) and d-RNA G4 can potentially achieve an unprecedented specificity in G4 targeting, i.e., distinguishing an individual rG4 from other RNA structure motifs such as hairpins and stem loops, or even between dG4s and rG4s30. In terms of potential biological applications, we have demonstrated that these spiegelmers can interfere with the binding of the target rG4s with biologically relevant peptides or proteins30,31, with a half-maximal inhibitory concentration (IC50) comparable to state-of-the-art small-molecule G4 ligands31, which may be used as a strategy for G4 targeting therapeutics. The nuclease-resistant nature of these rG4-targeting l-RNA aptamers also allows them to be promising probes for developing trackers of G4 folding and unfolding dynamics, or high-specificity vehicles for delivery in cells by coupling them with fluorophores or other moieties of interest, respectively. Besides that, these rG4-targeting l-RNA aptamers can also be employed as rG4 ligands to regulate rG4-mediated gene expression and RNA metabolism, as well as control of gene activity for diverse applications32. Recently, Tolnai et al. developed a sandwich detection assay based on two different speigelmers that bind to the C- and N- termini of cardiac troponin I, respectively, which suggests spiegelmers can be developed into highly sensitive and specific sensors for biopolymers33. A similar strategy may be designed for biosensing of rG4 using rG4-targeting spiegelmers.
Even though our method was developed and optimized for rG4s, it is likely that our strategy can be applied to other noncanonical nucleic acids structures such as pseudoknots34 and i-motifs35, potentially by refining the selection conditions to meet the folding of these specific types of structure motifs. In particular, pseudoknot RNAs were reported to be a highly conservative motif in the 3′ untranslated region (3′UTR) of coronaviruses36 and other regions that regulate gene expressions in viruses through mechanisms like frameshifting37. They were also found to be an essential element for standby-mediated translation in bacteria38 and regulation of human telomerase RNA activity39,40,41,42. DNA i-motifs, whose in vivo existence has long been controversial due to their structural instability at physiologically relevant pH range35, were recently shown to be detectable in the nuclei of living cells43,44. This noncanonical structure generally appears in the complementary strand of dG4s with high proximity, although its biological role is still elusive and requires further investigation45. While discovery of small-molecule ligands for these noncanonical nucleic acid structural motifs is feasible and ongoing46,47, it may be a challenging process, and often requires laborious chemical synthesis, purification and characterization; thus, we think that our spiegelmer approach may serve as an alternative and practical option, especially for biochemists and molecular biologists.
Comparison with other methods
A large collection of G4 detection methods is available, with many that show specificity toward G4 over non-G4 structural motifs such as duplexes and hairpins3,48,49,50. One of the most commonly employed G4 detection tools is to use small-molecule ligands—low molecular weight (LMW) organic or inorganic compounds that typically show notable fluorescence enhancement or increase in thermostability in the form of melting temperature (Tm), or stronger binding affinity (lower dissociation constant Kd), while interacting with G4s49,51. The use of G4 ligands has been widely adopted both in vitro and in cells for diverse chemical and biological applications52,53,54,55, and some of these G4 ligands can stabilize the formation of G4s and dissociate G4–G4 binding protein complexes, which may be further developed as therapeutics13,49,56,57. For instance, commercially available ligands like N-methyl mesoporphyrin IX (NMM)58,59,60 and Thioflavin T (ThT)61,62 have shown promising G4 sensitivity in vitro; thus, their fluorescence signal has widely been applied as one of the G4 detection methods3. Yet, unlike the l-RNA aptamers that we are presenting here, most ligands lack the ability to achieve selective G4 structure binding, i.e., selectively bind to an individual G4 target over other closely related G4s; recently, however, a few small-molecule ligands were reported to have a higher specificity toward an individual G4 target49, such as the telomeric multimeric dG463 and the c-MYC dG464,65,66. These ligands showed preferred binding preference toward one specific G4 over other G4s, highlighting that individual G4 targeting should be feasible with G4 ligands, potentially by rationally designing ligand sidechains to recognize the groove and loops of G4 to provide additional specificity. However, the rationale behind such a property is not fully explained and whether such a strategy can be applied easily to any other G4 targets is unclear given the limited data. Apart from ligands, other G4 detection approaches using G4-specific antibodies and G4-specific peptides are also available67,68,69,70,71,72,73,74,75,76. Similar to G4 ligands, they showed excellent binding toward G4s over non-G4s67,68,69,70,71,72,73,74,75,76; however, so far there are only limited data on their ability to distinguish individual G4s over other G4s76. Notably, Chen et al. utilized a supramolecular host–guest sensing array that allows efficient distinction of G4s of different topologies77, while a few recent studies have reported guanine- or guanine analog–conjugated antisense oligonucleotides or peptides as new strategies to achieve greater G4 target specificity78,79,80,81. Interestingly, some innovative methods like targeting G4 with small-molecule ligand-labeled oligonucleotides or G-rich displacing oligonucleotides with either modified nucleic acids or its analogs have shown some success in distinguishing G4 targets with high sequence specificity81. However, these conjugate probes require additional recognition sites with the G4 targeting module to achieve such specificity. Compared with these above-mentioned approaches, the unique tertiary interaction between an l-RNA aptamer and d-RNA G4 provides uncharted territory to explore the possibility of achieving selective rG4 targeting through specific interaction between d- and l-nucleic acids, potentially with higher G4 specificity than other currently available approaches without the additional recognition sites.
Limitations
The synthesis of l-RNA for long transcripts (e.g., 50 nt or above) cannot be easily achieved, making it difficult to target long RNAs, and the associated costs are generally more expensive compared with d-RNA; therefore, it is recommended to design the target and optimize the aptamer to be shorter in length. Another potential solution is to evolve and optimize DNA/RNA polymerase and reverse transcriptase that can incorporate l-DNA/RNA nucleotides82,83,84, such that the rG4-SELEX can be carried out using l-DNA/RNA instead of d-DNA/RNA. During the negative selection step, the original SELEX protocol27 used nitrocellulose membrane to remove membrane-specific RNAs, whereas here we use magnetic beads to remove bead-specific RNAs because the use of nitrocellulose membrane is not feasible when targeting RNAs rather than proteins29. However, the magnetic beads approach is not sufficient to prevent the selection of nonspecific RNAs, i.e., sequences that do not bind to our intended target. From our lab’s experience, we found that these nonspecific RNAs arise due to imperfect selection and over-amplification in the rG4-SELEX process; thus, these nonspecific sequences also showed up in the final sequencing results. Hence, in addition to beads, the use of scramble RNAs or mutant rG4 in the negative selection can potentially improve the selection of highly specific aptamers. In addition, minimal number of PCR cycles should be used in the amplification steps to minimize bias introduced by PCR amplification. Like the original protocol29, we have successfully employed Sanger sequencing platform to sequence and identify potential aptamer candidates; however, this low-throughput sequencing platform can only provide limited number of sequencing data, which restricts the number of potential candidates for consideration. A possible solution is to employ a next-generation sequencing platform, which can provide a much larger candidate pool for analysis and further verification. A summary of the current limitations of rG4-SELEX and their potential solutions are listed in Table 1.
Overview of the procedure
Prior to the selection, primers, biotin-l-RNA rG4 target and a d-DNA aptamer library with randomized sequence 40 nucleotides long (N40) need to be designed (see ‘Experimental design’ for details). Unlike the parent protocol that utilized a genomic library29, rG4-SELEX begins with the generation of a double-stranded DNA (dsDNA) library from N40 library (Fig. 1, Steps 1–5). The dsDNA library is then transcribed to a d-RNA library (Fig. 1, Steps 6–26). Streptavidin-coated magnetic beads (streptavidin beads) are then prepared and incubated with transfer RNA (tRNA) (see ‘Experimental design’ for details) to suppress nonspecific binding sites (Fig. 1, Steps 27–28). Then the d-RNA library is subjected to a negative selection by incubating with a portion of prepared streptavidin beads (Fig. 1, Steps 29–32), and bead-specific d-RNAs are discarded while bead nonspecific d-RNAs are retained (Fig. 1, Step 33). The bead nonspecific d-RNAs are then incubated with the biotin-l-RNA rG4 target (Fig. 1, Steps 34–35), followed by the addition of another portion of prepared streptavidin beads (Fig. 1, Step 36). Then the streptavidin beads are washed and unbound d-RNAs are discarded while the bound d-RNA sequences are recovered (Fig. 1, Steps 37–45). The recovered d-RNA sequences are then reverse transcribed to complementary DNA (cDNA) (Fig. 1, Steps 46–52), followed by PCR amplification (Fig. 1, Steps 53–70). The amplified dsDNAs are then used as starting materials for the next round of selection. After seven rounds of selection (Fig. 1, Step 71), enrichment of the selected aptamers is monitored from the decreased number of PCR cycles required to amplify the cDNAs. The enriched sequences are then cloned (Fig. 1, Steps 72–81), and positive clones are identified by colony amplification followed by bacterial growth and plasmid extraction (Fig. 1, Steps 82–91). Extracted plasmids are then sequenced using the Sanger sequencing platform (Fig. 1, Step 92). Other sequencing platforms such as next-generation sequencing can also be employed. Subsequently, individual sequences are characterized for their binding with the target and followed by other validations and applications (Fig. 1, Steps 93–117).

d-RNA library is transcribed and subjected to negative and positive selections for multiple rounds. Enriched d-RNA sequences are then cloned and sequenced to identify individual d-RNA aptamers. The identified d-RNA aptamers are further optimized and characterized, followed by downstream analysis. The final l-RNA aptamer will be synthesized for diverse applications. Figure adapted with permission from ref. 31, Oxford University Press.
Experimental design
Before starting: oligonucleotides, library design, and choice of rG4 target and label
Design of primers that are compatible with random libraries is critical in rG4-SELEX and other types of SELEX. This is because of the many steps that require the priming region(s) during the selection cycles, including T7 RNA transcription, reverse transcription and PCR amplification, hence the need for fixed sequence region(s) in the library design. An example of primers and library design (random region plus fixed primer regions) that we used is as follows (the underlined sequences are T7 DNA promoter sites for in vitro RNA transcription):
Forward | 5′-TTCTAATACGACTCACTATAGGTTACCAGCCTTCACTGC |
Reverse | 5′-GTGTGACCGACCGTGGTGC-3′ |
Library | 5′-TTCTAATACGACTCACTATAGGTTACCAGCCTTCACTGC (N40) GCACCACGGTCGGTCACAC-3′ |
‘Forward’ is the forward primer consisting of a T7 promoter sequence (underlined sequence) + forward priming region (boldface) for extension, transcription and PCR amplification. ‘Reverse’ is the reverse priming region (italics). Bold type and italics represent reverse transcription and PCR amplification. The sequences of the fixed region have been used successfully in the past for different types of targets27,30,31. Other sequences for the fixed region may also be designed, usually ~20 nucleotides long (for the parts shown in bold type and italics). Efficient amplification is an indispensable step for a successful selection. Therefore, primers should be designed considering factors such as annealing temperature, GC content of ~50–70% and prevention of self-dimers from primer itself, and heterodimers between the primers. There are several available programs to aid in appropriate primer design. We used software of Integrated DNA Technologies (IDT; https://sg.idtdna.com/pages). The library contains the randomized region (N40) and primer annealing sequences, with theoretically 440 sequences.
The initial random RNA library pool can be prepared using different lengths of random region, different sequences for the fixed regions and different strategies for synthesizing the RNA. The degree of randomness of a library is denoted with the letter ‘N’ followed by a number (e.g., N40), which signifies the extent of the library diversity. In general, the longer the randomized sequence, the more diverse the initial library, and based on previous literature and our own experience27,28,30,31,85, it can be within the range of 30–70. The design of a good library will ensure a successful selection.
Another crucial aspect of rG4-SELEX is the choice of rG4 target and label to use. Some of the factors to consider in choosing an rG4 to be targeted by the l-RNA aptamer that is selected during the procedure include its biological relevance, binding modes to other molecules, rG4 structural subtypes such as canonical versus noncanonical rG4, etc. The labeling of the rG4 target should also be carefully considered in terms of its intended purpose (selection or binding test), taking into consideration factors such as its physical size and excitation and emission wavelengths. For instance, for selection, a biotin label is commonly used for partitioning the bound and unbound aptamer candidates using streptavidin-coated magnetic beads, while for binding tests, fluorescein (FAM) and Cy5 labels are an example of labels with different sizes and emission wavelengths, etc. All oligonucleotides used are obtained commercially and dissolved in ultrapure nuclease-free water to desired concentrations.
Before selection: preparation of the 5′-biotinylated target, random RNA library and streptavidin-coated magnetic beads (Steps 1–28)
Prior to the selection of the aptamer, the 5′-biotinylated target is dissolved in ultrapure nuclease-free water to desired concentration, and the initial randomized RNA library is prepared through template extension of ssDNA to generate a dsDNA library (Steps 1–5) and subsequently transcribed to an RNA library (d-form RNA; Steps 6–26). Also, streptavidin-coated magnetic beads are prepared and incubated with tRNA (Steps 27–28) to suppress nonspecific binding sites on the beads, and the beads are then divided into two equal portions.
rG4-SELEX
rG4-SELEX consists of three major stages, namely (i) selection, involving positive selection to allow the binding of the randomized d-RNA library with biotinylated target, as well as the removal of nonspecific library sequences using negative selection with streptavidin-coated magnetic beads; (ii) partitioning, involving the separation of library sequences that bind to the target and those that do not bind to the target; and (iii) amplification, involving the amplification of the selected library sequences to generate sufficient amount for subsequent selections.
Stage 1: negative and positive selection (Steps 29–35)
rG4-SELEX consists of two types of selections: negative and positive. To enhance the selection of high-affinity aptamers, shaking is introduced in each of these selection cycles.
For negative selection, the d-RNA library is incubated with one portion of the pre-prepared streptavidin-coated magnetic beads. This selection aims at reducing the amount of nonspecific binding sequences (or bead-specific d-RNA sequences). We advise that negative selection should be introduced from the first round of selection and can be done before or after positive selection. This will ensure the removal of most of these bead-specific d-RNA sequences as otherwise they may get over-represented after PCR amplification and multiple SELEX cycles. Note that other aptamer selection methods introduced negative selection after positive selection, during the second round of aptamer selection86.
For positive selection, the bead nonspecific d-RNA sequences obtained from negative selection are then incubated with the 5′-biotinylated l-RNA target. To enhance the selection of highly specific aptamer sequences, the selection conditions used become more stringent (from mild to harsh) during subsequent selection rounds. For instance, d-RNA input is reduced in later rounds of selections, and magnesium ion concentration is also reduced (see Table 2 for an example of selection stringency we previously employed).
Stage 2: partitioning and recovery (Steps 36–45)
The mixture of d-RNA sequences with 5′-biotinylated l-RNA target (from positive selection) is incubated with the second portion of prepared streptavidin-coated magnetic beads (Step 36). The l-RNA target is labeled at its 5′ end with biotin to help with partitioning the d-RNA sequences that bind to the l-RNA target using streptavidin–biotin interactions, followed by the removal of supernatant containing unbound d-RNA sequences. Then, washing is done as indicated in Table 2 to eliminate weakly bound and/or unbound d-RNA sequences. Washing for a longer time (i.e., longer incubation) as well as shaking during the washing enhances the removal of unbound sequences and the recovery of sequences with higher affinities. The bound d-RNA sequences (aptamers) are recovered from the streptavidin–biotin–l-RNA target complex through elution with an elution buffer (see ‘Reagent setup’). Then, the eluted d-RNA aptamer sequences are column purified before reverse transcription and PCR amplification.
Stage 3: reverse transcription of bound aptamer (Steps 46–52)
To increase the amount of eluted d-RNA aptamer required for the next selection round, sequences are reverse transcribed to cDNAs. We recommend that reverse transcription be done with Li+-containing reverse-transcription buffer to avoid rG4-mediated reverse-transcriptase stalling87,88 (should the aptamer fold into rG4).
Stage 4: PCR amplification of bound aptamer (Steps 53–70)
Next, the cDNAs are PCR amplified and transcribed back to d-RNA sequences, followed by column purification. The significance of PCR in aptamer selection cannot be overemphasized, and an appropriate level of PCR amplification will increase the success rate for aptamer selection. Hence, PCR amplification is conducted on cDNAs (obtained from reverse transcription) following each round of selection as follows: (i) optimization to determine the optimal number of cycles required and (ii) performing PCR amplification on the remaining pool of cDNAs using the optimal number of cycles, followed by (iii) concentration and purification of cDNAs.
Monitoring selection progress (Steps 53–65)
To ascertain the enrichment of evolved aptamer candidates, selection is monitored using agarose gel electrophoresis following the PCR optimization step. From our experience, an enrichment in selection will usually reduce the number of PCR cycles required to generate product, even though the input materials gradually decrease in the SELEX process as shown in Table 2.
Iteration and end of selection (Step 71)
This is attained when there is no notable difference in the optimal PCR cycle number of three or more successive rounds of selections. We recommend at least seven iterations of the selection rounds be performed.
Cloning of enriched aptamers (Steps 72–86)
Once an enrichment is observed, potential aptamer sequences are then cloned into bacteria, followed by identification and sequencing of positive clones. Like the parent protocol, TOPO PCR 2.1 is used according to manufacturer instructions29. 3′ A overhangs are introduced into the aptamer pool by using Taq DNA polymerase in the PCR amplification step (of the last selection round; Steps 53–70). Then, the PCR products are ligated with a vector plasmid followed by transformation of the vector into competent Escherichia coli cells and overnight incubation. Positive clones are identified by colony PCR amplification (Steps 82–86).
Sequencing individual clones (Steps 87–92)
Positive clones (transformants) identified from colony PCR are selected and incubated at 37 °C overnight for E. coli to replicate and grow. Then, the plasmid DNA is extracted and mini prepped (purification and concentration). Plasmid DNAs are then sequenced using the Sanger sequencing platform.
Sequencing analysis and aptamer optimization (Steps 93–109)
Aptamer sequences are ranked based on their frequency of appearance or abundance. Then, a few of these top-ranked candidates are selected for further analysis (five to ten candidates, depending on the number of clones sequenced). The structures of the selected aptamer candidates are determined using Mfold structural prediction server. Any sequence conservation and/or structural similarity across the selected aptamer candidates is noted at this point. As Mfold does not predict rG4 structure, the identification of rG4 motifs can be separately done using the QGRS, G4hunter and G4NN prediction tools89,90,91. Next, the binding of selected aptamer candidates to the target is tested using electrophoretic mobility shift assay (EMSA) or microscale thermophoresis (MST). Afterward, aptamer mutations such as truncation, substitution and base-pair covariation are done to identify the shortest possible aptamer construct that has similar binding affinity to the full-length aptamer.
Aptamer characterization and downstream applications (Steps 110–117)
To understand the secondary structure in the selected aptamer candidates, different structure probing and spectroscopic methods can be employed; characterization of the aptamer structure can then be determined using methods such as the OH-radical footprinting, reverse-transcriptase stalling, selective 2′-hydroxyl acylation analyzed by lithium-mediated primer extension (SHALiPE) among other methods30,31. To investigate whether the aptamer contains an rG4 motif, rG4-specific ligand-enhanced fluorescent assay is used (rG4s can recognize rG4-specific ligands and cause an enhancement in the fluorescence of the ligands); circular dichroism (CD) can be used to characterize the topology of the aptamer (if it folds into rG4) and UV melting can be used to obtain information on the thermal stability of the potential rG4 in the aptamer. Additional mutations can be done on the aptamer to see if the rG4 is required for the target binding30,31. Several applications can be explored for the selected aptamer(s), one example of which is inhibition of peptide/protein–rG4 interactions30,31 (as shown in the Procedure and ‘Anticipated results’). Other possibilities include gene activity manipulation, target enrichment/pull down and cellular imaging32.
Materials
Reagents
Oligonucleotides, library and primers
Critical
The following primers, library and other oligonucleotides can be obtained from commercial sources such as ChemGenes, Genewiz and IDT or synthesized in the laboratory if needed.
-
DNA N40 library template (see ‘Experimental design’ for more details about designing the library)
-
d-RNA oligonucleotides (used for binding test and characterization)
-
Primers (see ‘Experimental design’ for more details about design)
-
M13 primers (used for Sanger sequencing)
-
Aptamer candidate templates (DNA template with sequence based on the sequencing result after in vitro selection).
-
5′ FAM-labeled G4s
-
5′ biotinylated l-rG4 target
-
5′ FAM-labeled l-rG4 target
-
5′ FAM – l-Apt. candidate
General reagents
-
Dynabeads MyOne Streptavidin C1 magnetic beads (Invitrogen, cat. no. 65001)
-
HiScribe T7 High Yield RNA Synthesis Kit (New England BioLabs (NEB, cat. no. E2040S)
-
SuperScript III First-Strand Synthesis System (Invitrogen, cat. no. 18-080-051)
-
TIANprep Mini Plasmid Kit (Tiangen Biotech Beijing, cat. no. DP103-03)
-
Trans5α chemically competent cells (Transgen Biotech Beijing, cat. no. CD201-02).
-
RHAU53 peptide (Synpeptide)
-
Nucleolin protein (OriGene, cat. no. TP319082)
-
Q5 Hot Start High-Fidelity Master Mix (NEB, cat. no. M0494L-1)
-
DreamTaq polymerase (Thermo Scientific, cat. no. EP0702)
-
Absolute ethanol, ACS grade (AQA, cat. no. NC0281066)
-
Ethanol, 70% (vol/vol) (see ‘Reagent setup’)
-
d-(+)-Sucrose (Fisher Bioreagents, cat. no. BP220-212)
-
Yeast tRNA (Invitrogen, cat. no. AM7119)
-
Magnesium chloride, 1 M (Sigma, cat. no. 63069)
-
40% acrylamide/bis solution, 37.5:1 (Bio-Rad, cat. no. 1610148)
-
40% acrylamide/bis solution, 19:1 (Bio-Rad, cat. no. 1610144)
-
10× TE buffer, pH 7.4 (Fischer BioReagents, cat. no. BP2477500)
-
Lithium hydroxide monohydrate (Acros Organic, cat. no. AC413325000)
-
100 mM dNTPs (NEB, cat. no. N04465)
-
PCR buffer, 10× (Beyotime, cat. no. D7223)
-
Ultrapure distilled water for RNA work (Invitrogen, cat. no. 10-977-023)
-
Agarose (BioReagents, cat. no. BP160-100)
-
DNA Gel stain SYBR Safe (Invitrogen, cat. no. S33102)
-
Sodium hydroxide, 10 M (Sigma, cat. no. 72068)
-
Potassium chloride solution, 3 M (Fisher Chemicals, cat. no. 10358383)
-
Potassium acetate (Amethyst Chemicals, cat. no. 222500)
-
Lithium chloride solution, 8 M (Sigma, cat. no. L7026)
-
TOPO TA Cloning Kit for sequencing (Invitrogen, cat. no. 450071)
-
N′N′N′N′-tetramethylethylenediamine (TEMED), 99% (Acros Organic, cat. no. AC138450500)
Caution
This compound is corrosive. Handle it with gloves and in a fume hood.
-
Cacodylic acid, 98% (Acros Organic, cat. no. AC318150050)
Caution
This compound is toxic. Handle it with gloves and in a fume hood.
-
10% ammonium persulfate (APS), 98% (Acros Organic, cat. no. AC401160100)
Caution
This compound is corrosive. Handle it with gloves and in a fume hood (see ‘Reagent setup’)
-
Agar granulated (Labware HK, cat. no. 400405000)
-
LB broth (Lenox), powder microbial growth medium (Sigma Life Science, cat. no. L3022)
-
Ampicillin (Sigma-Aldrich, cat. no. 59349)
Caution
This compound is hazardous. Handle it with gloves and in a fume hood.
-
RNA Clean & Concentrator 5 (Zymo Research, cat. no. R1016)
-
5× Li+ RT buffer + 5 mM dNTPs mix (see ‘Reagent setup’)
-
Turbo DNase (Invitrogen, cat. no. AM2238)
-
Ultrapure Tris HCl, 1 M, pH 7.5 (Invitrogen, cat. no. 15567027)
-
10× Tris/boric acid EDTA buffer (Bio Rad, cat. no. 1610770)
-
50× Tris/acetic acid EDTA buffer (Invitrogen, cat. no. 24710030)
-
Zymo Clean Gel DNA Recovery Kit (Zymo Research, cat. no. D4008)
-
Single-stranded RNA (ssRNA) low-range ladder (NEB, cat. no. N0364S)
-
Gel loading dye, orange, 6× (NEB, cat. no. B7022S)
-
SYBR Safe DNA gel stain, 10,000× (Invitrogen, cat. no. S33102)
-
Quick load purple LMW DNA ladder (NEB, cat. no. N0557S)
Equipment
-
Culture dish, 100 mm × 20 mm (Corning, cat. no. 353003)
-
PCR strips, 0.2 mL (Thermo, cat. no. AM12230)
-
Microcentrifuge tubes, 2 mL (Gene Plastix, cat. no. MCT-C-2.0)
-
Microcentrifuge tubes, 1.5 mL (Gene Plastix, cat. no. MCT-C-1.5)
-
Conical tubes, 50 mL Falcon
-
Conical tubes, 15 mL Falcon
-
Centrifuge (Eppendorf, 5430R)
-
Microcentrifuge (Gene, GENE SPEED X1)
-
Heat block (Thermo-Shaker, MSC-100, Eco-Life Scientific)
-
Microwave (Whirlpool, MM260X)
-
Weight scale (ACCURIS Instrument)
-
Analytical balance (ACCURIS Instrument)
-
Orbital shaker (IKA KS 4000 ic control)
-
Thermal cycler (Bio-Gener)
-
Electrophoresis power supply (Major Science Mini-500)
-
Horizontal gel tank (Novex Mini Cell, Life Technologies, ref. no. EI0001)
-
Vertical gel tank (Beijin Bay Gene Biotech)
-
Autoclave (Hirayama HA-300 MIV)
-
UV trans illuminator (Bio-Rad, ChemiDoc Touch Imaging system)
-
CD spectrophotometer (JASCO, J-1500 CD)
-
Incubator (SHEL-LAB)
-
UV-visible spectrophotometer (Agilent Technologies, Cary series)
-
Nano Drop100 spectrophotometer (Thermo Scientific)
-
Magnetic rack (DynaMag, Life Technologies, lot no. 3519)
-
FujiFilm Typhoon FLA-9000 PhosphoImager
-
Computer with internet for accessing online sequence analysis tools
-
4 °C refrigerator (KANEDA)
-
−30 °C freezer (Haier Biomedical)
-
−80 °C freezer (FORMA 900 Series, Thermo Scientific)
Reagent setup
Buffers and solutions
Critical
All buffers and solutions can be prepared in stocks and stored at room temperature (25 °C) for several months unless otherwise mentioned.
Washing buffer:
To prepare 35 mL of washing buffer, to 27.79 mL of ultrapure water add 175 µL of 1 M Tris–HCl (pH 7.5), 35 µL of 0.5 M EDTA and 7 mL of 5 M NaOH solution.
Solution A:
To prepare 12 mL of Solution A, to 11.76 mL of ultrapure water add 120 µL of 10 M NaOH solution and 120 µL of 5 M NaCl solution.
Solution B:
To prepare 12 mL of Solution B, to 11.76 mL of ultrapure water add 240 µL of 5 M NaCl solution.
Selection buffer (1×):
To prepare 14 mL of selection buffers, add to an empty 15 mL Eppendorf tube, 2.1 mL of 1 M KCl solution and 350 µL of 1 M Tris–HCl (pH 7.5), then add 70 µL of 1 M MgCl2 solution. Finally, make up the volume to 14 mL with ultrapure water.
Selection buffer (2×):
To prepare 14 mL of selection buffer (2×), add to an empty 15 mL Eppendorf tube, 2.1 mL of 1 M KCl solution and 350 µL of 1 M Tris–HCl (pH 7.5), then add 140 µL of 1 M MgCl2 solution. Finally, make up the volume to 14 mL with ultrapure water.
Elution buffer:
To prepare 14 mL of elution buffer, add to an empty 15 mL Eppendorf tube, 70 µL of 5 M NaOH solution and 28 µL of 0.5 M EDTA solution to 13.902 mL of ultrapure water.
Neutralization buffer:
1 M Tris–HCl (pH 7.5).
70% (vol/vol) ethanol:
Add 700 mL of water to 300 mL of absolute ethanol to obtain 1 L of 70% (vol/vol) ethanol.
5× Li+ RT buffer + 5 mM dNTPs mix:
Prepare required volume of buffer containing 20 mM MgCl2, 5 mM DTT, 750 mM LiCl, 100 mM Tris–HCl (pH 7.5) and 5 mM dNTPs mix. Store buffer at −20 °C for a maximum of 1 year.
Critical
Based on our experience, the use of homemade Li+-containing RT buffer, instead of vendor-provided RT buffer, in Step 1 is important to reduce potential G4 stalling during the primer extension step. Similarly, the use of homemade Li+-containing RT buffer, instead of vendor-provided RT buffer, in Step 48 is crucial to minimize potential rG4 stalling during the reverse-transcription step. From our previous studies, several reverse transcriptases we tested are lithium ion tolerant in the reverse-transcription reaction87,92, including Superscript III, TGIRT and Protoscript.
5× binding buffer:
to prepare 14 mL of 5× binding buffer, to 8.68 mL of ultrapure water add 3.5 mL of 3 M KCl solution, 70 µL of 1 M MgCl2 solution and 1.75 mL of 1 M Tris–HCl (pH 7.5).
2× RNA buffer:
to prepare 14 mL of 2× RNA buffer, add to an empty 15 mL Eppendorf tube, 4.2 mL of 1 M KCl and 700 µL of 1 M Tris–HCl to 9.1 mL of ultrapure water.
40% sucrose solution:
to prepare 50 mL of 40% sucrose solution, add 20 g of sucrose powder to 50 mL of ultrapure water to an empty 15 mL Eppendorf tube.
10% APS solution:
to prepare 10 mL of 10% APS, add to an empty 12 mL Eppendorf tube, 1 g of APS to 10 mL of ultrapure water, vortex well and store at 4 °C.
TE–Li800 buffer:
to prepare 50 mL of TE–Li800 buffer, add to an empty 50 mL Eppendorf tube 40 mL of water to 5 mL of 10× TE buffer pH 7.4 (to obtain a final concentration of 1×) and 5 mL of 8 M LiCl (final concentration of 0.8 M).
Critical
The use of TE–Li800 buffer, instead of commonly used TE-Na250 buffer, in Step 22 minimized G4 formation in this step. We found the RNA extraction yields from gel using TE–Li800 buffer or TE–Na250 solution were similar.
Running buffer:
to prepare 1 L of running buffer, to an empty and clean 1 L bottle, add 500 mL ultrapure water followed by 150 mM KOAc, 1 mM MgCl2 and 25 mM Tris–HCl pH 7.5 final concentrations, and adjust the volume to 1 L with ultrapure water.
Agar plate preparation:
in a clean 1 L bottle, weigh out 20 g of LB broth and 15 g of agar. Then, add miliQ water up to the 1 L mark and mix. Autoclave the mixture at 15 psi for 15–20 min. Allow the molten agar to cool down to ~60 °C. Then, add 1 mL of ampicillin at a final concentration of 50 µg ml−1, and mix well by shaking. Carefully transfer 20–25 mL of the molten agar into culture dish (100 mm × 20 mm), partially cover the plate with the lid and allow the gel to solidify. Then, use a plastic film to wrap the plates. The plates can be stored at 4 °C for 6 months maximum.
Critical step
Turn the plates upside down to prevent water droplets on the agar.
Equipment setup
Software
The following software (or similar) is required:
-
IDT primers and library design
-
Mfold; RNA folding form webserver (RNA Folding Form (unafold.org))
-
ImageJ for image quantification or analysis (imagej.nih.gov)
-
Snap Gene for sequencing data analysis (snapgene.com)
-
GraphPad Prism for plotting graphs and determination of dissociation (Kd) and inhibition (IC50) constants (www.graphpad.com)
Procedure
Critical
Avoid RNase contamination throughout the Procedure.
Template preparation
Timing 1–2 h
-
1
Prepare the ssDNA library–reverse primer hemi-duplex by mixing the library and the primer at a 2:3 ratio, and add 5× Li RT buffer + 5 mM dNTP mix at a final concentration of 1× buffer + 1 mM dNTP.
Critical step
Based on our experience, the use of homemade Li+-containing RT buffer, instead of vendor-provided RT buffer is important to reduce potential G4 stalling during the primer extension step.
-
2
Denature the DNAs at 75 °C for 3 min, and allow them to reanneal at 35 °C for 10 min.
-
3
Add Superscript III reverse transcriptase (200 U/µL) to the mixture at final concentration of 10 U/μL, and incubate the reaction at 50 °C for 50 min. An example of the exact volumes of each reagent used for a 20 µL reaction is described in the table below:
Reagents
Volume
Final concentration
Nuclease-free water
5 μL
–
10 μM ssDNA library
4 μL
2 µM
10 μM reverse primer
6 μL
3 µM
5× Li RT buffer + 5 mM dNTP mix
4 μL
1× + 1 mM dNTP mix
200 U/μL Superscript III RT
1 μL
10 U/μL
Total volume
20 μL
–
-
4
Cool the reaction to room temperature, and purify the resulting dsDNA library using Zymoclean Gel DNA Recovery kit following the manufacturer’s protocol.
-
5
Quantify the dsDNA using a NanoDrop UV spectrophotometer at 260 nm or other appropriate quantification methods.
In vitro transcription
Timing 5–6 h + overnight incubation
-
6
Transcription setup (Steps 6–9). Mix 200–300 ng of dsDNA library from Step 4 with 8 µL of each 100 mM NTPs stock from the in vitro transcription kit.
-
7
Add 8 µL of 10× reaction buffer and 8 µL of T7 RNA polymerase mix, both provided by the in vitro transcription kit.
-
8
Add nuclease-free water to top up to 80 µL total reaction volume.
-
9
Incubate the reaction at 37 °C for 3 h.
-
10
Digestion of DNA template (Step 10). Add 4 µL of Turbo DNase (2 U/µL), and continue the incubation at 37 °C for 15 min. The amount of each component for an 80 µL transcription reaction is listed below. The reaction can be scaled up or down depending on the amount of RNA needed.
Reagents
Volume
Final concentration
ATP (100 mM)a
8 μL
10 mM
CTP (100 mM)a
8 μL
10 mM
UTP (100 mM)a
8 μL
10 mM
GTP (100 mM)a
8 μL
10 mM
dsDNA library from Step 4 + nuclease-free water
Up to 32 μL
200–300 ng
10× reaction buffera
8 μL
1×
10× T7 RNA polymerase mixa
8 μL
1×
Total volume
80 μL
–
DNase digestion after transcription
Turbo DNase (2U/μL)
4 μL
0.1U/μL
-
11
PAGE purification of transcribed RNA (Steps 11–26). Prepare a 10 mL 12% 19:1 acrylamide:bis-acrylamide gel solution containing 8 M urea and 1× TBE.
-
12
Add 70 µL of 10% APS and 7 µL of TEMED into the solution, and mix the solution well.
-
13
Quickly pour the solution into a 1.0 mm thickness gel cast and insert an appropriate well comb. Allow the gel to form at room temperature for ~30 min.
Critical step
Polymerization will start after addition of APS and TEMED, so it is suggested to cast the gel immediately. Decreased volume of TEMED and APS can slow down the polymerization, and vice versa.
-
14
Remove the comb, and clean the gel piece inside the wells carefully with a needle.
Pause point
Prepared gels can be stored at 4 °C for at most 2 d by wrapping with wet tissue paper and wrap paper.
-
15
Install the gel into the gel chamber. Fill the tank with 1× TBE to ensure the inlet and the outlet with the electrode are fully covered.
-
16
Prerun the gel at 300 V for 30 min to homogenize the running buffer and gel, then briefly flush the wells with 1× TBE with a syringe.
-
17
Add 1× volume of 2× RNA loading dye to the transcription product from Step 10.
Pause point
Quenched samples (from Step 17) can be stored at −20 °C for a few days.
-
18
Heat the mixture at 95 °C for 3 min prior to loading onto the gel.
-
19
Inject the transcription product into the wells carefully using a pipette. Run the gel for 45–60 min or until the dye components have moved to a desirable position. The relative migration of the dyes on different percentages of PAGE can be found at https://www.thermofisher.com/de/de/home/references/ambion-tech-support/rna-electrophoresis-markers/general-articles/gel-electrophoresis-tables.html.
-
20
Carefully remove the glass plate, then put the gel flat on top of a thin-layer chromatography plate.
-
21
Detect the band(s) under a UV lamp (254 nm), then cut the intense RNA band while avoiding smears with a clean razor blade and transfer it into a clean 2.0 mL microcentrifuge tube (Fig. 2).
Fig. 2: UV shadowing of RNA produced by T7 in vitro transcription. 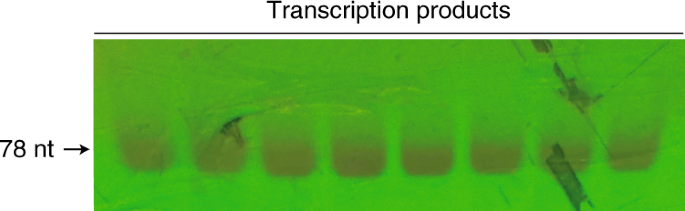
RNA product from T7 in vitro transcription was run on a 12% denaturing PAGE, shadowed by a 254 nm hand-held UV lamp. The resultant RNA is 78 nucleotides long, which contains a 40-nucleotide random aptamer region (N40) and a 38-nucleotide fixed primer region (see ‘Experimental design’).
-
22
Crush the gel into small pieces with a clean pipette tip. For 80 µL transcription scale, add 640 µL of TE–Li800 buffer (see ‘Reagent setup’) to the crushed gel.
Critical step
The use of TE–Li800 buffer, instead of commonly used TE–Na250 buffer, minimizes G4 formation in this step. We found that the RNA extraction yields from gel using TE–Li800 buffer or TE–Na250 solution were similar.
-
23
Incubate the suspension in a thermoshaker at 4 °C and shake at 22.4g (1,000 rpm) overnight (~12–15 h).
-
24
Filter the solid from the suspension with a Corning Costar Spin-X plastic centrifuge tube filter and collect the flow through.
-
25
Clean and concentrate the RNA using the Zymo Research RNA Clean & Concentrator-5 kit according to the manufacturer’s protocol.
-
26
Quantify the RNA using a NanoDrop or any other quantification method available.

Magnetic beads preparation
Timing ~1.5 h
-
27
Dynabeads wash (Steps 27–28). Prepare and wash 3 mg Dynabeads MyOne Streptavidin C1 according to the manufacturer’s washing protocol for RNA applications.
-
28
Suspend the Dynabeads in 297 µL 2× selection buffer. Add 3 µL yeast tRNA (10 mg/mL) to the solution and incubate at room temperature with shaking at 22.4g (1,000 rpm) for 1 h using a thermoshaker.
In vitro selection
Timing ~5 h
-
29
Negative selection (Steps 29–33). Dilute the purified RNA library from Step 26 with nuclease-free water to a 100 µL solution with an RNA concentration of 9 µM (for the first selection round).
-
30
Add 100 µL 2× RNA buffer, and incubate the solution at 75 °C or higher for 3 min, then allow it to cool down to room temperature for 15 min.
-
31
Vortex the Dynabeads suspension from Step 28, and add 100 µL of the suspension (1 mg Dynabeads) to the mixture.
-
32
Incubate the RNA library and the Dynabeads at room temperature with shaking at 11g (700 rpm) for 2 h.
-
33
Place the mixture on a magnetic rack, collect the solution and discard the Dynabeads.
-
34
Positive selection (Steps 34–45). Incubate 10 µL of 20 µM 5′-biotin-labeled l-RNA target at 75 °C or higher for 3 min, then allow it to cool down to room temperature for 15 min. Then add it to the solution.
-
35
Incubate the mixture at room temperature with shaking at 11g (700 rpm) for 30 min.
-
36
Remove the buffer from the remaining 2 mg Dynabeads from Step 28, transfer the mixture from Step 35 into the 2 mg Dynabeads slurry and incubate the suspension under the same conditions (as in Step 35) for 15 min.
Critical step
Do not transfer the suspension to the selection mixture as it will dilute the RNA library concentration.
-
37
Place the suspension in a magnetic rack for 1 min. Discard the supernatant.
-
38
Resuspend the beads with 600 µL 1× selection buffer. Mix well with pipette.
-
39
Place the suspension in a magnetic rack for 1 min. Discard the supernatant.
-
40
Repeat Steps 38–39 five times.
-
41
Resuspend the beads with 100 µL of elution buffer. Mix well with pipette.
-
42
Place the suspension in a magnetic rack for 1 min. Collect the supernatant in a new Eppendorf.
-
43
Repeat Steps 41–42 once. Combine the collected supernatant.
-
44
Neutralize the collected solution by adding 50 µL of 1 M neutralization buffer.
-
45
Purify and concentrate the selected RNA pool with the Zymo Research RNA Clean & Concentrator-5 Kit according to the manufacturer’s protocol. Elute the RNA with 30 µL of nuclease-free water.
Critical step
We suggest reverse-transcribing the RNA immediately after selection.
Reverse transcription
Timing ~30 min
-
46
Mix the selected RNA from Step 45 with 2 µL of 10 µM reverse primer and 8 µL nuclease-free water.
-
47
Heat the mixture at 75 °C for 3 min, then allow it to cool down at 35 °C for 10 min.
-
48
Add 18 µL of 5× Li RT buffer + 5 mM dNTP mix and 2 µL of Superscript III Reverse Transcriptase (200 U/µL).
Critical step
The use of homemade Li+-containing RT buffer, instead of vendor-provided RT buffer, is crucial to minimize potential rG4 stalling during the reverse-transcription step. From our previous studies, several reverse transcriptases we tested are lithium ion tolerant in the reverse-transcription reaction87,92, including Superscript III, TGIRT and Protoscript.
-
49
Incubate the reaction at 50 °C for 15 min.
-
50
Add 3 µL of 2 M NaOH to the mixture, and heat it at 95 °C for 10 min.
-
51
Cool down the mixture to room temperature, then neutralize the ssDNA with 15 µL of neutralization buffer. The amounts of reagents used in this reaction are listed in the table below.
Components
Volume
Final concentration
Nuclease-free water
8 μL
–
Purified selected RNAs
30 μL
–
10 μM reverse primer
2 μL
0.33 μM
5× Li RT buffer + 5 mM dNTP mix
18 μL
1× + 1 mM dNTP mix
200 U/μL Superscript III RT
2 μL
6.67 U/μL
Total volume
60 μL
After reverse transcription
2 M NaOH (for enzyme inactivation and RNA degradation)
3 μL
1 M neutralization buffer (for pH neutralization)
15 μL
-
52
Purify and concentrate the ssDNA with the Zymo Research RNA Clean & Concentrator-5 Kit according to the manufacturer’s protocol. Elute the ssDNA with 30 µL of nuclease-free water.
DNA amplification (cycle test)
Timing 2 h
-
53
Reaction setup (Steps 53–57). Mix 8 µL of the ssDNA from Step 52 with 1 µL of 10 µM forward primer and 1 µL of 10 µM reverse primer.
-
54
Add 10 µL of Q5 Hot Start High-Fidelity 2× Master Mix (NEB) to the mixture.
-
55
Separate the mixture into four equal aliquots of 5 µL each.
-
56
Carry out PCR on the aliquots with conditions according to the following table:
Cycle number
Denature
Anneal
Extend
1
98 °C, 3 min
2–15
98 °C, 20 s
60 °C, 20 s
72 °C, 20 s
16
72 °C, 3 min
-
57
Quench the four aliquots at cycles 10, 12, 14 and 16, respectively, by removing one from the thermocycler, adding 1 µL of 6× DNA loading dye and cooling it down to 4 °C.
Critical step
The testing cycles should be adjusted in different rounds of selection to determine the minimal number of PCR cycles needed to have a clear band on gel (Fig. 3). Usually, you will need fewer PCR cycles when you proceed with the selection as the affinity becomes stronger for the enriched library. Hence, the testing range can be decreased to 8, 10, 12, 14 or even 6, 8, 10, 12.
-
58
Agarose gel electrophoresis (Steps 58–65). Weigh 450 mg of agarose powder, and suspend it in 30 mL of 1× TAE in a 250 mL conical flask.
Fig. 3: PCR cycle test on a representative selection round. 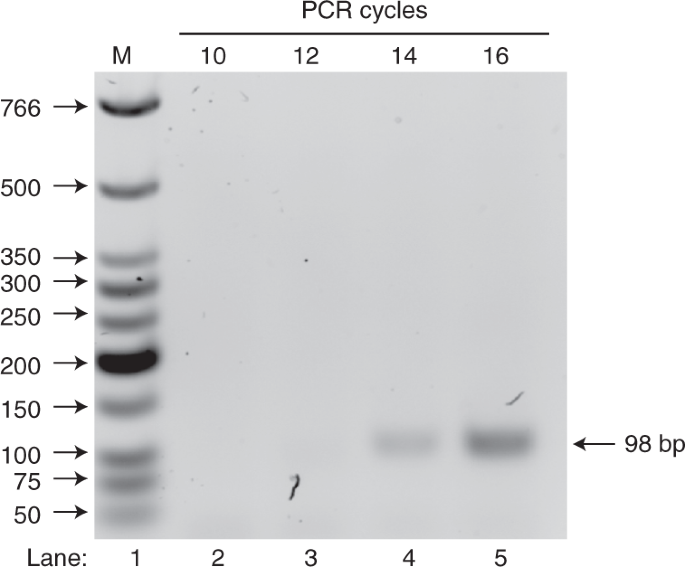
PCR cycle test was carried out on an aliquot of selected cDNA and run on 1.5% agarose gel (wt/wt) to determine the minimum number of PCR cycles required for the next step (Fig. 1), i.e., DNA amplification using optimal PCR cycle number. On the gel, lane 1 (M) shows the NEB LMW DNA ladder that indicates the dsDNA size, and lanes 2–5 show the PCR products at different PCR cycles. The desired product should be 98 bp in length. In this representative PCR cycle test example, 14 cycles were selected as the optimal PCR cycle number with which to amplify the library.
-
59
Microwave the suspension for ~2 min, until a clear solution is obtained.
-
60
Add 3 µL of 10,000× SYBR Safe to the 30 mL gel solution, and shake the conical flask to ensure the stain is well mixed.
-
61
Quickly pour the solution into a gel cast with a six-well comb inserted. Wait for the solution to solidify (~20 min).
-
62
Transfer the gel into a gel chamber, and fill the chamber with 1× TAE until both electrodes and the gel are fully covered.
-
63
Load 5 µL of each aliquot from Step 57 to each well, as well as 2 µL of LMW DNA ladder (NEB) to one of the wells on the side.
-
64
Run the electrophoresis for 20 min at 120 V at room temperature.
-
65
Visualize the DNA using a gel imager. Determine the fewest number of PCR cycles that can provide a clear band on gel (Fig. 3).

DNA amplification using optimal PCR cycle number
Timing ~1 h
-
66
Mix the remaining 22 µL of selected RNA from Step 45 with 4 µL of forward primer and 4 µL of reverse primer.
-
67
Add 30 µL of Q5 Hot Start High-Fidelity 2× Master Mix (NEB) to the mixture, as follows:
Components
Volume
Final concentration
ssDNA from reverse transcription
22 µL
–
10 μM forward primer
4 μL
0.67 μM
10 μM reverse primer
4 μL
0.67 μM
Q5 Hot Start High-Fidelity 2× Master Mix
30 μL
1×
Total volume
60 μL
–
-
68
Start the PCR with the conditions as listed below:
Cycle number
Denature
Anneal
Extend
1
98 °C, 3 min
2–13
98 °C, 20 s
60 °C, 20 s
72 °C, 20 s
14
72 °C, 5 min
-
69
Purify and concentrate the enriched dsDNA library with the Zymoclean Gel DNA Recovery Kit following the manufacturer’s protocol.
Critical step
Note that other recovery or purification kits compatible with low-range dsDNA could alternatively be used.
-
70
Quantify the dsDNA with a NanoDrop or any other quantification method available.
Iteration of selection cycle (Steps 27–71)
Timing ~2 d per cycle
-
71
Repeat the selection cycle starting from the in vitro transcription (Step 27) using the enriched dsDNA library in Step 70 as the template. In each successive cycle, the selection conditions should be adjusted to be more stringent to enhance the selection of highly specific aptamer sequences, with a shorter incubation time, change in temperature (depends on intended application of aptamer), lower concentrations of salt, RNA library and l-RNA target (see ‘Experimental design’ and Table 2). Hence, multiple selection buffers with different salt concentrations and standard solutions of RNAs should be prepared to meet the range of selection conditions throughout the selection cycles.
Pause point
Leftover dsDNAs should be stored at −20 °C for at least 1 year as a backup in case the library could not survive next selection or for later development of other in vitro selection designs.
TA cloning
Timing 1 d
-
72
DreamTaq PCR (Step 72). For the PCR amplification step in the final cycle (Steps 53–70), DreamTaq DNA polymerase (Thermo) is used to introduce a 3′ A overhang to the dsDNA library (Fig. 4), as follows:
Fig. 4: DreamTaq PCR cycle test on a representative selection round. 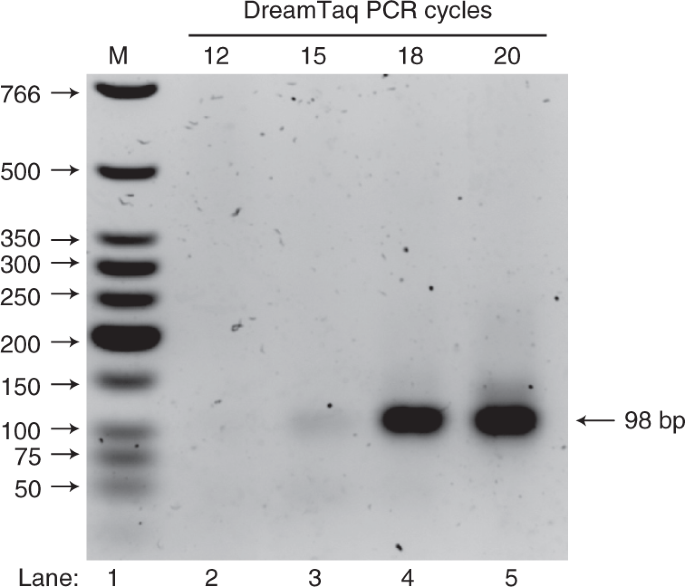
PCR cycle test was carried out on an aliquot of selected cDNA and run on 1.5% agarose gel (wt/wt) to determine the minimum number of PCR cycles required for subsequent ligation and cloning. On the gel, lane 1 (M) shows the NEB LMW DNA ladder that indicates the dsDNA size, and lanes 2–5 show the PCR products at different PCR cycles. The desired product should be 98 bp in length. In this representative PCR cycle test, cycle 18 was selected to amplify the dsDNA library to allow sufficient DNA material for cloning.
Components
Volume
Final concentration
ssDNA from reverse transcription
10 µL
–
10 μM forward primer
4 μL
1 μM
10 μM reverse primer
4 μL
1 μM
dNTP mix (2 mM each)
4 µL
0.2 mM each
10× DreamTaq Buffer
4 µL
1×
DreamTaq DNA polymerase (0.5 U/µL)
2 μL
0.025 U/μL
Nuclease-free water
12 µL
Total volume
40 μL
–
Critical step
DreamTaq polymerase has lower amplification efficiency than Q5 polymerase.
-
73
TOPO-TA cloning reaction (Steps 73–75). First prepare an agar plate as shown in ‘Reagent setup’. Then mix 4 µL of DreamTaq PCR product from Step 72 with 1 µL of salt solution and 1 µL of TOPO vector.
-
74
Allow the mixture to stand at room temperature for 5 min.
-
75
Plasmid transfection (Steps 75–81). Defrost 50 µL of Trans5α chemically competent cells on ice.
-
76
Add 2 µL of the TOPO cloning reaction from Step 74 into 50 µL of the competent cells, and mix by gently flicking the tube.
-
77
Allow the cells to stand on ice for 30 min.
-
78
Heat-shock the cells at 42 °C for 30 s without shaking, then place on ice immediately.
-
79
Add 250 µL of room-temperature LB medium to the cells, and incubate the cells at 37 °C and shake at 0.9g (200 rpm) for 1 h.
-
80
Spread the cells on an ampicillin-positive LB agar plate with a cell spreader gently.
Critical step
It is suggested that this step be carried out in a sterile bench, e.g., next to a Bunsen burner and while wearing a mask to avoid contamination with foreign bacteria.
-
81
Seal the agar plate with parafilm, place it with the agarose side on top at 37 °C for at least 20 h or until clear colonies are observed on the plate (Fig. 5).
Fig. 5: Transfected E. coli colonies grown on LB-agar plate. 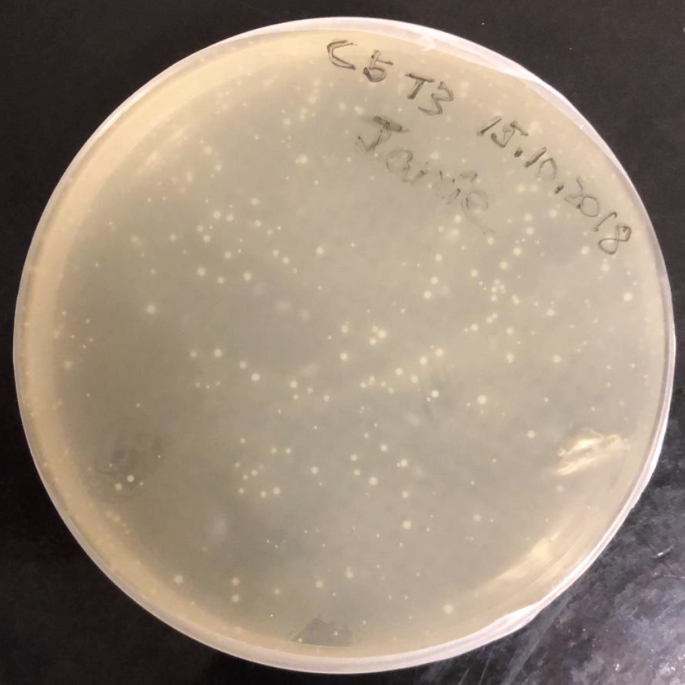
A representative ampicillin LB-agar plate depicting grown E. coli colonies after incubation overnight at 37 °C. The E. coli was transfected with ampicillin-resistant plasmids containing the selected dsDNA library.
Critical step
One should not place the gel at 37 °C for too long as the bacteria would overgrow and become unsuitable for sequencing.
Pause point
Agar plates can also be stored at 4 °C to minimize the growth rate, but in general >4 weeks is not suggested.


Colony amplification and plasmid extraction
Timing 1.5 d
-
82
Colony PCR test (Steps 82–86). Mark and label the colonies on the plate.
-
83
Prepare PCR reactions per colony as follows. Create a mastermix, then aliquot to smaller portions to ensure same volume of reagents in each tube.
Components
Volume
Final concentration
10 μM M13 forward primer
0.5 μL
0.83 μM
10 μM M13 reverse primer
0.5 μL
0.83 μM
Q5 Hot Start High-Fidelity 2× Master Mix
3 μL
1×
Nuclease-free water
2 µL
–
Total volume
6 μL
–
-
84
Use a clean pipette tip to gently touch a colony, then put it into individual reaction solution. Repeat for all visible and clearly separated colonies. Generally, 10–20 colonies are picked for colony PCR test.
Critical step
The colonies are quite fragile and need to be handled with extra caution. One should avoid taking all of the bacteria from the colony, which may result in not enough material for the later steps.
-
85
Perform a 25-cycle PCR according to the conditions described in Step 68.
-
86
Prepare a 60 mL 1.5% agarose gel similar to that prepared in Steps 58–65. Use an appropriate comb to allow loading of all samples (Fig. 6).
Fig. 6: Colony PCR test on selected colonies. 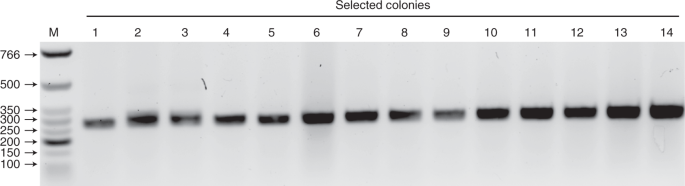
PCR on selected colonies was carried out to check if the DNA inserted is of the right size. On the 1.5% agarose (wt/wt) gel, M refers to the NEB LMW DNA ladder that indicates the size of dsDNA. Fourteen colonies (1–14) were picked for the colony PCR test. The desired PCR product size is 264 bp using the M13 primer pairs in this case.
-
87
Growth of positive clones (Steps 87–92). Select the colonies that show a clean band with the correct mobility on the gel.
-
88
For each selected colony, prepare 4 mL LB medium in a 15 mL clean centrifuge tube.
-
89
Use a pipette tip to scratch the colony from the agar plate, then put the tip into the LB medium.
-
90
Incubate the colonies in an incubator at 37 °C, and shake at 14g (250 rpm) for at least 20 h.
-
91
Extract the plasmid from the cells with the TIANprep Mini Plasmid Kit (Tiangen) according to the manufacturer’s protocol.
-
92
Aliquot an appropriate amount of plasmid for Sangar sequencing (~50 ng in our case).
Critical step
The amount of plasmid needed depends on the sequencing protocol that you are using. If you order sequencing services from a company, it is better to communicate with the service provider for the amount they need.

Sequencing data analysis
Timing ~5 h
-
93
Download the sequencing data, and save with an appropriate name on a computer.
Critical step
Aptamer sequences can appear in either sense or antisense strands within the sequencing data. To analyze these data, we used the SnapGene software (GSL Biotech) following the steps below.
-
94
Launch the SnapGene software.
-
95
Under menu, select file and open the saved data (from Step 93).
-
96
Select ‘sequence’ from the bottom left menu. This will provide the entire sequence of the bacterial clone.
-
97
Click on the add primer function (on the menu bar); a new window will appear.
-
98
Search for the forward primer by inputting its sequence (5′– 3′) in the new window (Step 97), and the primer region will automatically be located (as shown in Fig. 7)
Fig. 7: Analysis of Sanger sequencing result using SnapGene. 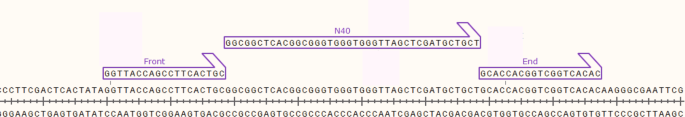
Using SnapGene software (GSL Biotech), the sequence of the Sanger sequencing result can be displayed on the computer screen, with the fixed primer region mapped and annotated (labeled front and end in this case). The DNA sequences in the N40 region can then be extracted.
-
99
Label the located primer region as appropriate, for example ‘forward primer or FP’, and click the ‘add primer to template’ button located on the bottom right of the add primer window.
-
100
Repeat Steps 97–99 to locate and label the reverse primer region.
-
101
The randomized nucleotides region is the region between the two primer regions. Highlight this region.
-
102
Repeat Steps 97–99 to label the randomized nucleotide region.
-
103
Use the reverse complement option (located on the top right side within the add primer window) to change antisense strand sequences.
-
104
Repeat Steps 95–103 for all remaining sequencing data.
-
105
List out all of these full sequences (fixed primer regions and N40 region) together in an excel file, and rank them according to their frequency at which they appear in the sequencing results, and eliminate invalid outputs, e.g., missing of fixed primer regions or extremely short sequences.
-
106
Using an alignment program such as the Clustal Omega (https://www.ebi.ac.uk/Tools/msa/clustalo/), define the sequence alignment of the aptamer candidates (the N40 region) to each other (Fig. 8a).
-
107
Determine the secondary structure of aptamer candidates using Mfold, by firstly launching Mfold (RNA folding form at (http://www.unafold.org/mfold/applications/rna-folding-form.php) and entering the name and sequence name of the aptamer candidate (5′–3′) to be folded in the appropriate box (FASTA format is also supported). Enter any constraint information if applicable in the appropriate box (different options are available to choose from), select the RNA sequence form and leave all other parameters at default settings. Click the fold RNA tab and wait while the server processes the request. Once the result is ready, it will be displayed in a new window showing the output. The output will show the parameters used to fold the aptamer and the different possible structures (if it folds into more than one structure). Download and view the aptamer structures (e.g., Fig. 8b) by clicking the file formats of preference.
Critical step
Be sure to download results as soon as possible as they will be erased from the server after 12 h.
-
108
Classify sequences into families based on different structures/features such as loop length and stems, as shown in Fig. 8, and identify potential rG4 motif using the tools QGRS, G4hunter or G4NN. An example of a QGRS result obtained by inputting the aptamer sequence at https://bioinformatics.ramapo.edu/QGRS/index.php using default parameter is shown in Fig. 9.
-
109
Analyze and rank the sequences based on the criteria described in Step 108. The most abundant ones from each family are usually picked as candidates for subsequent testing.
Critical step
Because the more abundant candidate from the sequencing result may not necessarily bind better than less abundant candidates, we recommend selecting about 6-12 candidates.
Fig. 8: Sequence alignment and RNA secondary structure prediction. 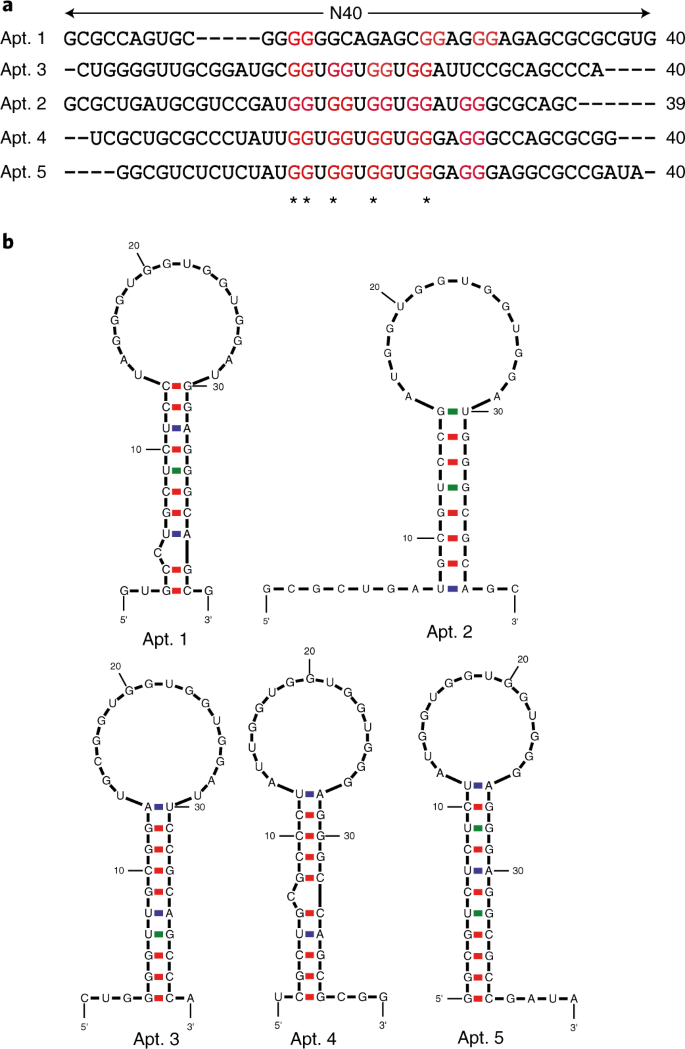
a, An example of alignment of aptamer candidates using the Clustal Omega program. The rG4 motifs are indicated in red and the most conserved sequences are designated with asterisks beneath. b, RNA secondary structure prediction of potential aptamer candidates from a using Mfold. Panel b adapted with permission from ref. 31, Oxford University Press.
Fig. 9: Structural prediction of representative aptamer candidates using Mfold and QGRS Mapper. 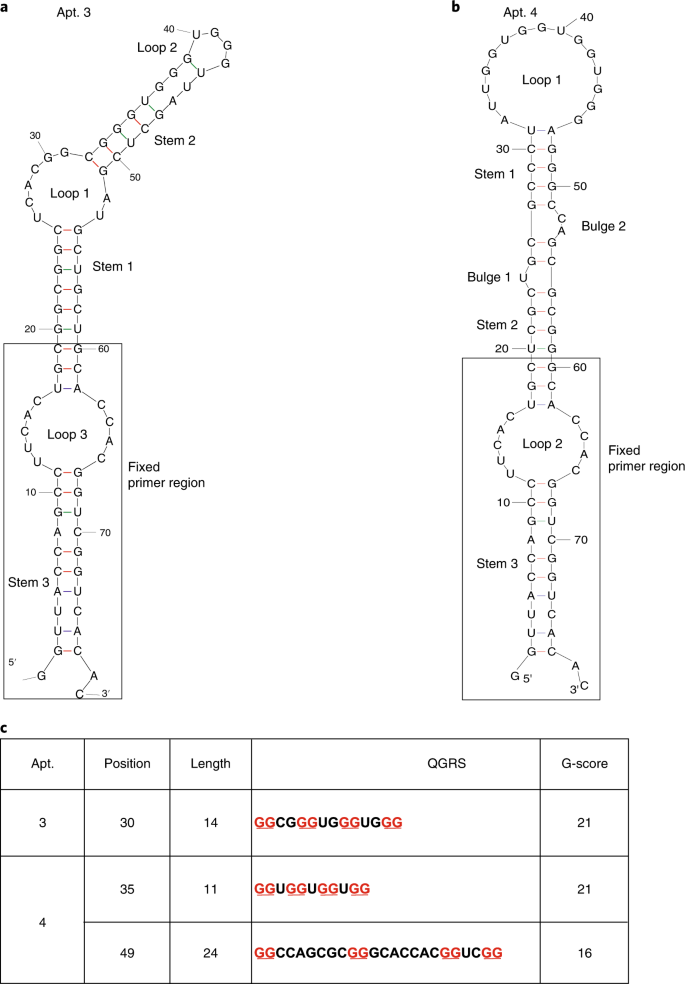
All loops, stems, bulges and fixed primer regions are labeled accordingly. a, An aptamer candidate selected against a canonical rG4, TERRA rG4. b, An aptamer candidate selected against a noncanonical rG4, hTERC rG4. c, rG4 motif prediction in Apt. 3 and Apt. 4 using the QGRS Mapper tool, an online server for G4 analysis (https://bioinformatics.ramapo.edu/QGRS/index.php). Figure adapted with permission from: a, ref. 30, Wiley; b, ref. 31, Oxford University Press.


Affinity test of selected aptamer candidates
-
110
Advisably, at least two different binding assays should be used to test, characterize and validate the binding of aptamers and their corresponding targets. In this protocol, we employ EMSA (option A) and MST (option B) to resolve the bindings between selected aptamer candidates and their targets.
Option A: affinity test of selected aptamer candidates on native PAGE
Timing ~2 d
-
(i)
Preparation of d-RNA aptamer candidates. Order dsDNA template for at least 6–12 selected aptamer candidates from the sequencing results from Step 107.
-
(ii)
Transcribe the aptamer candidates according to Steps 6–26 using 10 µM of the ordered dsDNA as template.
Critical step
As the selected sequences usually have strong secondary structures, we have encountered low transcription yield for some samples if a hemi-duplex template (only promoter region is double stranded) approach is used for the transcription. Hence, we suggest using fully dsDNA template here.
-
(iii)
Sample preparation for affinity test. Prepare reaction mixtures as indicated in the table below with final volume of 20 µL that contains up to 2 nM 5′FAM-labeled l-rG4 target, 8% sucrose, 1× selection buffer and 0–5.4 µM of a selected d-RNA aptamer candidate from sequencing.
Components
Volume
Final concentration
5× selection buffer
4 µL
1×
40% sucrose solution
4 µL
8%
FAM-l-rG4 (1 µM)
0.04 µL
1–2 nM
d-RNA aptamer candidate from Step 109
Variable
0–5.4 µM
Nuclease-free water
Add up to 20 µL
Total volume
20 µL
–
-
(iv)
Incubate the samples at 75 °C for 3 min, then cool down to 37 °C for 30 min.
-
(v)
Add 2 µL of 6× orange DNA loading dye to each of the samples, and mix well with pipette.
-
(vi)
Native PAGE setup. Prepare 1 L running buffer that contains 150 mM KOAc, 1 mM MgCl2 and 25 mM Tris–HCl pH 7.5 according to ‘Reagent setup’.
-
(vii)
Prepare a 10 mL 8% gel solution by diluting 2 mL 40% acrylamide (19:1) stock solution with 8 mL running buffer.
-
(viii)
Add 80 µL of 10% APS and 8 µL of TEMED into the solution, and mix the solution well.
-
(ix)
Quickly pour the solution into a 1.0 mm thickness gel cast, and insert an appropriate well comb. Allow the gel to form at room temperature until it is fully solidified (~1 h).
Critical step
Native polyacrylamide gels are harder to solidify then urea–TBE gel. An incomplete gel formation will result in undesirable gel image.
Pause point
Prepared gels can be stored at 4 °C for at most 2 d by wrapping with wet tissue paper and wrap paper.
-
(x)
Remove the comb, and clean the gel piece inside of the wells carefully with a needle.
-
(xi)
Install the gel into the gel chamber. Fully fill the tank with running buffer to the inlet and with a liquid level barely below the glass gel holder in the outlet.
-
(xii)
Put the gel chamber in an ice bath/inside 4 °C fridge, and prerun the gel with 70 mA per gel for 30 min or less.
-
(xiii)
Native PAGE binding test. Flush away gel pieces in the well of the gel with the running buffer with a syringe.
-
(xiv)
Load 10 µL of each sample (from Step 110A(iii)) to each well.
-
(xv)
Run the gel in ice bath at 70 mA until the orange dye reaches the end of the gel (~45 min or less).
-
(xvi)
Use phosphoimager to scan the gel and observe the potential gel shift (a replacement of the aptamer band by an upper band) that indicates the binding of the aptamer candidate to the target.
-
(xvii)
Adjust the contrast of the whole gel image to obtain an optimal visualization.
-
(xviii)
Quantify the upper and lower bands with ImageJ (NIH free software).
-
(xix)
Normalize the raw data to ‘Fraction Bound’ by dividing the bound band intensity with total band intensity using the following formula:
$$F_{\rm{Bound}} = \frac{{I_{{\rm{Bound}}}}}{{I_{{\rm{Bound}}} + I_{{\rm{Unbound}}}}}$$ -
(xx)
Curve-fit the normalized data and determine the dissociation constant (Kd), in which 50% of the complex is dissociated, with the ‘one-site specific binding model’ in Graphpad Prism.
-
(xxi)
Repeat the test for each selected aptamer candidate from Step 109.
Option B: affinity test of selected aptamer candidates using MST
Timing ~2 h
-
(i)
Generate a protocol for the experiment by inputting the target and ligand concentrations in the MST software.
-
(ii)
Prepare 170 µL of 1× selection buffer as diluent (for 16 samples).
-
(iii)
Transfer 10 µL of diluent into PCR tubes numbers 2–16.
-
(iv)
Prepare a 20 µL start-point reaction sample in the first PCR tube, containing selection buffer and aptamer at final concentrations of 1× and 10 µM, respectively.
-
(v)
Transfer 10 µL of start-point reaction sample into tube number 2, and mix well with the pre-added 10 µL diluent. Next, transfer 10 µL of number 2 sample into tube number 3, and then 10 µL from number 3 to number 4; repeat such serial dilution until tube number 16. Finally, discard 10 µL reaction mixture from sample number 16, such that each tube contains 10 µL mixture with aptamer concentrations 1× more than the subsequent one. Heat tubes at 75 °C for 3 min.
-
(vi)
Prepare 170 µL FAM–rG4 target solution containing selection buffer and aptamer at final concentrations of 1× and 20 nM, respectively. Heat at 75 °C for 3 min.
-
(vii)
Add 10 µL of target solution into each of the PCR tubes, so that the final sample solutions contain 20 nM 5′FAM–rG4 target, 150 mM KCl, 1 mM MgCl2, 25 mM Tris–HCl (pH 7.5) and concentrations of l-Apt. ranging from 5 µM to 0.153 nM.
-
(viii)
Incubate at 37 °C for 30–120 min.
-
(ix)
Put MST capillaries into each sample, and allow samples to be soaked up to the middle.
-
(x)
Place the capillaries onto the provided capillary holder, with the sample that has the highest concentration of aptamer as sample number 1, and lowest as sample number 16.
-
(xi)
In the instruction manual of the software, type in the target working concentration as ‘20 nM or the amount used’ and stock ligand concentration as ‘10 µM’. The working concentration of the ligand should be autofilled as ‘5 µM’. After that, the measurement can be started.
-
(xii)
Analyze affinity using the MST provided software; nano-temper analysis. The dissociation constant will be automatically calculated.
-
(xiii)
Repeat the test for each selected aptamer candidate from Step 109.
Affinity test of optimized l-RNA aptamer: 1 d
-
111
Further optimize the aptamer candidate with the best affinity from the result obtained in Step 110 by truncating primer region or strengthening duplex regions by replacing A:U base pairs with G:C base pairs. Core binding region can be determined by partial mutation of the aptamer. A newly derived candidate is created for each mutation and an affinity test (Step 110) is run for each of them until a finalized sequence of the aptamer with strongest affinity is discovered.
-
112
Order a FAM-labeled d-RNA rG4 target and the l-RNA of the optimized aptamer candidate to confirm the binding repeating Step 110 with the l-RNA version of aptamer and natural chirality of the rG4 target (d-rG4).
Critical step
Tested aptamers in Step 108 with the best affinity can be further optimized by truncating primer region or strengthening duplex regions by replacing A:U base pairs with G:C base pairs.
l-RNA aptamer applications: inhibition test of rG4–peptide or rG4–protein interactions
-
113
Several applications can be explored for the l-RNA aptamer candidate such as inhibition of rG4–peptide or rG4–protein interactions. To test the inhibition efficiency, denature d-rG4 and l-RNA aptamer separately at 75 °C for 3 min.
-
114
Anneal a solution of 5 nM rG4, then add 80 nM rG4-interacting protein in PCR tubes at room temperature.
-
115
Titrate different concentrations of annealed l-RNA aptamer (from Step 113) from 0 to 20 µM into the assembled rG4–protein reactions.
-
116
Incubate the reaction at 37 °C for 30–120 min, depending on the selected protein of interest and how strongly it naturally binds to the target.
-
117
Monitor the binding interactions either with MST, following Step 110B, or using Step 110A on a 12% native PAGE (37.5:1 acrylamide-bis-acrylamide) at 25 mA per gel for 45 min in an ice bath.
Troubleshooting
Troubleshooting advice can be found in Table 3.
Timing
-
Steps 1–5, template preparation: 1–2 h
-
Steps 6–26, in vitro transcription: 5–6 h + overnight
-
Steps 6–9, transcription setup: 3 h
-
Step 10, digestion of DNA template: 15 min
-
Steps 11–26, PAGE purification of transcribed RNA: 2–3 h + overnight
-
Steps 27–28, magnetic beads preparation: 1.5 h
-
Steps 29–45, in vitro selection: 5 h
-
Steps 29–33, negative selection: 2–3 h
-
Steps 34–45, positive selection: 1–2 h
-
Steps 46–52, reverse transcription: 30 min
-
Steps 53–65, DNA amplification (cycle test): 2 h
-
Steps 53–57, reaction setup: 30 min to 1 h
-
Steps 58–65, agarose gel electrophoresis: 1 h
-
Steps 66–70, DNA amplification using optimal cycle: 1 h
-
Step 71, iteration of selection cycle: 2 d per cycle
-
Steps 72–81, TA cloning: 1 d
-
Step 72, DreamTaq PCR: 3 h
-
Steps 73–74, TOPO-TA cloning reaction: 5 min
-
Steps 75–81, plasmid transfection: 1 d
-
Steps 82–92, colony amplification and plasmid extraction: 1.5 d
-
Steps 82–86, colony PCR test: 1 h
-
Steps 87–92, growth of positive clones: 1.5 d
-
Steps 93–109, sequencing data analysis: ~5 h
-
Step 110: affinity test of selected aptamer candidates
-
Option A, on native PAGE: 2 d per candidate
Preparation of d-RNA aptamer candidates: 5 h + overnight
Sample preparation for affinity test: 1–2 h
Native PAGE setup: 1–2 h
Native PAGE binding test: 1–2 h
-
Option B, using MST: 2 h
-
Steps 111–112, affinity test of optimized spiegelmer on native PAGE: 1 d
-
Steps 113–117, inhibition test of rG4–peptide or rG4–protein interactions: 1 d
Anticipated results
Sanger sequencing results
In this Protocol Extension, several rounds of both positive and negative selections and increasing selection pressure/stringency result in an enrichment in aptamer pools, which are subsequently cloned and sequenced. The sequencing data obtained will contain both randomized nucleotides and (forward and reverse) primers. Identified sequences are ranked based on their frequency across several clones, though one has to be reminded that the more abundant candidate from the sequencing results may not necessarily bind better than lesser abundant candidates. Aligning the sequences of the aptamer candidates as exemplified in Fig. 8a provides an insight into sequence similarities (indicated with an asterisks in Fig. 8a). Additionally, results from the structural conformation of the aptamer candidates can further help in identifying the regions that are essential for the aptamer binding as depicted in Fig. 8b.
Aptamer structural prediction
Secondary structures of the sequences are predicted using Mfold webserver for RNA secondary structure prediction (RNA Folding Form (unafold.org)). Two examples are shown in Fig. 9. As Mfold does not predict rG4 structure, the identification of rG4 motifs can be separately done using the QGRS, G4hunter and G4NN prediction tools89,90,91. Figure 9c shows an example of QGRS Mapper (https://bioinformatics.ramapo.edu/QGRS/index.php) result for rG4 prediction in Apt. 3 and Apt. 4, respectively. Gs predicted for G4 formation are highlighted in red and underlined, while the G-score value is an indicator for potential and stable G4 formation, and the higher the G-score value, the more stable the G489.
Binding assays
Advisably, at least two different binding assays should be used to test, characterize and validate the binding of aptamers and their corresponding targets. In this protocol, we employ EMSA (Step 110A) and MST (110B) to resolve the bindings between selected aptamer candidates and their targets. Examples are shown in Figs. 10 and 11.

Example results of binding affinity tests of two l-RNA aptamers, labeled as l-Apt. 3-7 (aptamer targeting d-TERRA rG4) and l-Apt. 4-1c (aptamer targeting for d-hTERC rG4), from our two published works30,31. a, EMSA between 5′FAM-d-TERRA rG4 (2 nM, fixed) and l-Apt. 3-7 (0–5.4 µM). With increasing l-Apt. 3-7 concentration (from left to right), the free FAM-d-TERRA rG4 band (unbound) decreases, whereas the complex band (bound) increases. b, Curve-fitting of l-Apt. 3-7 and FAM-d-TERRA rG4 binding. The Kd value, in which 50% of the complex is dissociated (dashed line), was determined to be 99.0 ± 20.3 nM. The error bars represent the standard error of the mean (SEM) of three replicates. N = 3. c, Results of EMSA experiments as in a, but for a different aptamer candidate and target, and using different concentrations; each lane contained 1 nM 5′FAM-d-hTERC rG4 and varying concentration of l-Apt. 4-1c (0–4.5 µM). With increasing l-Apt. 4-1c concentration (from left to right), the free FAM-d-hTERC rG4 band (unbound) decreases, whereas the complex band (bound) increases. d, Curve-fitting of l-Apt. 4-1c and FAM-d-hTERC rG4 binding. The Kd value, in which 50% of the complex is dissociated (dashed line), was determined to be 74.9 ± 7.5 nM. The error bars represent the SEM of three replicates. N = 3. Figure reproduced with permission from: a, ref. 30; c, ref. 31, Oxford University Press. Figure adapted with permission from: b, ref. 30, Wiley; d, ref. 31, Oxford University Press.

Curve-fitting of l-Apt. 4-1c and FAM-d-hTERC rG4 binding. The Kd value, in which 50% of the FAM-D-hTERC rG4–l-Apt. 4-1c complex is dissociated (dashed line), was determined to be 59.1 ± 11.9 nM. The error bars represent the SEM of three replicates. N = 3. Figure adapted with permission from ref. 31, Oxford University Press.
Characterization of rG4 motif in selected aptamer
Aptamers containing a potential rG4 motif predicted by QGRS as shown in Fig. 9c or other G4 prediction tools can be further characterized and validated. Some of these assays are specifically designed for rG4 motif detection while others can be applicable to other RNA secondary structures such as hairpin motifs, for example, structural probing assay93,94,95, used to characterize both exposed and protected RNA nucleotides (as shown in Fig. 12), and rG4-specific ligand-induced fluorescence assay30,31,51,96, used to characterize the formation of rG4 (enhance fluorescence) in the presence of rG4-specific ligands (as shown in Fig. 13a,b). Other assays include CD30,31,95,97, used to characterize the topology of the rG4 aptamer (as shown in Fig. 13c), and UV melting30,31,95,97, used to characterize the melting temperature of the aptamer (as shown in Fig. 13d).

a, Apt. 3-7 structure proposed based on nucleotides’ reactivity to RNA structure probe NAI. Blue asterisks denote regions with high reactivity to NAI. b, Apt. 3-7 NAI difference map, with green and red asterisks denoting aptamer target ratios of 1:0 (less reactive) and 1:85 (more reactive), respectively. Figure adapted with permission from ref. 30, Wiley.

a,b, NMM-ligand-enhanced (a) and ThT-ligand-enhanced (b) fluorescent spectra of an rG4-containing aptamer. The ligands were excited at 395 nm and 425 nm while emission was collected at 550–750 nm and 440–700 nm for NMM and ThT ligands, respectively. The enhancement in fluorescent intensity under 150 mM KCl compared with LiCl condition indicates the formation of rG4 in the selected aptamer. c, CD spectra of rG4-containing aptamer. The presence of a positive peak at around 260 nm and a negative peak at around 240 nm under 150 mM KCl condition and not in 150 mM LiCl condition indicates the formation of an rG4 with a parallel topology in the aptamer. d, UV-melting profile monitored at 295 nm; formation of hypochromic shift (negative peak) under 150 mM KCl condition compared with Li condition observed from the derivative plot supports rG4 formation in the aptamer. The melting temperature (Tm) was found to be 76 °C. It should be noted that the Tm of rG4 should be monovalent ion dependent, with the Tm being higher in K+ than in Li+. Figure adapted with permission from ref. 31, Oxford University Press.
Inhibition analysis of rG4–protein interaction by selected l-Apt
One of the applications that can be explored for selected aptamers is interference of its target interactions with other molecules such as protein. Figure 14 is an example of EMSA- and MST-based assays demonstrating the capacity of l-Apt. 4-1c to inhibit rG4–protein interactions.

a, Native PAGE showing d-hTERC rG4–nucleolin interaction and the ability of l-Apt. 4-1c to inhibit their complex formation in a concentration-dependent manner: as the aptamer concentration increases, the rG4–nucleolin complex diminishes while the rG4–aptamer complex begins to appear. b, EMSA-based inhibition curve (obtained from a) showing the effect of l-Apt. 4-1c on hTERC rG4–nucleolin complex formation. The half maximal inhibitory constant (IC50), in which 50% of the rG4–nucleolin complex was dissociated by l-Apt. 4-1c, was determined to be 278.6 ± 1 nM. c, MST-based inhibition curve with IC50 determined to be 219 ± 30 nM. The error bars indicate the SEM of three independent replicates. N = 3. Figure adapted with permission from ref. 31, Oxford University Press.
Reporting Summary
Further information on research design is available in the Nature Research Reporting Summary linked to this article.
Data availability
The data are available from the authors. Source data of the gels and plots are also available in Mendeley Data with the following doi: 10.17632/x582nh3949.1. Source data are provided with this paper.
References
Davis, J. T. G-quartets 40 years later: from 5′-GMP to molecular biology and supramolecular chemistry. Angew. Chem. Int. Ed. 43, 668–698 (2004).
Neidle, S. & Balasubramanian, S. Quadruplex Nucleic Acids. Vol. 7 (Royal Society of Chemistry, 2006).
Kwok, C. K. & Merrick, C. J. G-quadruplexes: prediction, characterization, and biological application. Trends Biotechnol. 35, 997–1013 (2017).
Rhodes, D. & Lipps, H. J. G-quadruplexes and their regulatory roles in biology. Nucleic Acids Res. 43, 8627–8637 (2015).
Valton, A. L. & Prioleau, M. N. G-quadruplexes in DNA replication: a problem or a necessity? Trends Genet. 32, 697–706 (2016).
Fay, M. M., Lyons, S. M. & Ivanov, P. RNA G-quadruplexes in biology: principles and molecular mechanisms. J. Mol. Biol. 429, 2127–2147 (2017).
Kwok, C. K., Marsico, G. & Balasubramanian, S. Detecting RNA G-quadruplexes (rG4s) in the transcriptome. Cold Spring Harb. Perspect. 10, a032284 (2018).
Varshney, D., Spiegel, J., Zyner, K., Tannahill, D. & Balasubramanian, S. The regulation and functions of DNA and RNA G-quadruplexes. Nat. Rev. Mol. Cell. Biol. 21, 459–474 (2020).
Lyu, K., Chow, E. Y., Mou, X., Chan, T. F. & Kwok, C. K. RNA G-quadruplexes (rG4s): genomics and biological functions. Nucleic Acids Res. 49, 5426–5450 (2021).
Metifiot, M., Amrane, S., Litvak, S. & Andreola, M. L. G-quadruplexes in viruses: function and potential therapeutic applications. Nucleic Acids Res. 42, 12352–12366 (2014).
Harris, L. M. & Merrick, C. J. G-quadruplexes in pathogens: a common route to virulence control? PLoS Pathog. 11, e1004562 (2015).
Hansel-Hertsch, R., Di Antonio, M. & Balasubramanian, S. DNA G-quadruplexes in the human genome: detection, functions and therapeutic potential. Nat. Rev. Mol. Cell. Biol. 18, 279–284 (2017).
Ruggiero, E. & Richter, S. N. G-quadruplexes and G-quadruplex ligands: targets and tools in antiviral therapy. Nucleic Acids Res. 46, 3270–3283 (2018).
Cui, H. & Zhang, L. G-quadruplexes are present in human coronaviruses including SARS-CoV-2. Front. Microbiol. 11, 567317 (2020).
Zhao, C. et al. Targeting RNA G-quadruplex in SARS-CoV-2: a promising therapeutic target for COVID-19? Angew. Chem. Int. Ed. 60, 432–438 (2021).
Ruggiero, E. & Richter, S. N. Viral G-quadruplexes: new frontiers in virus pathogenesis and antiviral therapy. Annu. Rep. Med. Chem. 54, 101–131 (2020).
Ji, D. et al. Discovery of G-quadruplex-forming sequences in SARS-CoV-2. Brief. Bioinform. 22, 1150–1160 (2021).
Kosiol, N., Juranek, S., Brossart, P., Heine, A. & Paeschke, K. G-quadruplexes: a promising target for cancer therapy. Mol. Cancer 20, 40 (2021).
Sanchez-Martin, V., Soriano, M. & Garcia-Salcedo, J. A. Quadruplex ligands in cancer therapy. Cancers 13, (2021).
Young, B. E., Kundu, N. & Sczepanski, J. T. Mirror-image oligonucleotides: history and emerging applications. Chemistry 25, 7981–7990 (2019).
Nolte, A., Klussmann, S., Bald, R., Erdmann, V. A. & Furste, J. P. Mirror-design of l-oligonucleotide ligands binding to l-arginine. Nat. Biotechnol. 14, 1116–1119 (1996).
Kluszmann, S., Nolte, A., Bald, R., Erdmann, V. A. & Furste, J. P. Mirror-image RNA that binds d-adenosine. Nat. Biotechnol. 14, 1112–1115 (1996).
Tuerk, C. & Gold, L. Systematic evolution of ligands by exponential enrichment: RNA ligands to bacteriophage T4 DNA polymerase. Science 249, 505–510 (1990).
Ellington, A. D. & Szostak, J. W. In vitro selection of RNA molecules that bind specific ligands. Nature 346, 818–822 (1990).
Robertson, D. L. & Joyce, G. F. Selection in vitro of an RNA enzyme that specifically cleaves single-stranded DNA. Nature 344, 467–468 (1990).
Vater, A. & Klussmann, S. Turning mirror-image oligonucleotides into drugs: the evolution of Spiegelmer® therapeutics. Drug Discov. Today 20, 147–155 (2015).
Sczepanski, J. T. & Joyce, G. F. Binding of a structured d-RNA molecule by an l-RNA aptamer. J. Am. Chem. Soc. 135, 13290–13293 (2013).
Sczepanski, J. T. & Joyce, G. F. Specific inhibition of microRNA processing using l-RNA aptamers. J. Am. Chem. Soc. 137, 16032–16037 (2015).
Lorenz, C., von Pelchrzim, F. & Schroeder, R. Genomic systematic evolution of ligands by exponential enrichment (Genomic SELEX) for the identification of protein-binding RNAs independent of their expression levels. Nat. Protoc. 1, 2204–2212 (2006).
Chan, C. Y. & Kwok, C. K. Specific binding of a d-RNA G-quadruplex structure with an l-RNA aptamer. Angew. Chem. Int. Ed. 59, 5293–5297 (2020).
Umar, M. I. & Kwok, C. K. Specific suppression of d-RNA G-quadruplex–protein interaction with an l-RNA aptamer. Nucleic Acids Res. 48, 10125–10141 (2020).
Ji, D., Lyu, K., Zhao, H. & Kwok, C. K. Circular l-RNA aptamer promotes target recognition and controls gene activity. Nucleic Acids Res. 49, 7280–7291 (2021).
Tolnai, Z. J. et al. Spiegelmer-based sandwich assay for cardiac troponin I detection. Int. J. Mol. Sci. 21, 4963 (2020).
Staple, D. W. & Butcher, S. E. Pseudoknots: RNA structures with diverse functions. PLoS Biol. 3, e213 (2005).
Benabou, S., Aviñó, A., Eritja, R., González, C. & Gargallo, R. Fundamental aspects of the nucleic acid i-motif structures. RSC Adv. 4, 26956–26980 (2014).
Williams, G. D., Chang, R. Y. & Brian, D. A. A phylogenetically conserved hairpin-type 3′ untranslated region pseudoknot functions in coronavirus RNA replication. J. Virol. 73, 8349–8355 (1999).
Brierley, I., Pennell, S. & Gilbert, R. J. Viral RNA pseudoknots: versatile motifs in gene expression and replication. Nat. Rev. Microbiol. 5, 598–610 (2007).
Romilly, C., Lippegaus, A. & Wagner, E. G. H. An RNA pseudoknot is essential for standby-mediated translation of the tisB toxin mRNA in Escherichia coli. Nucleic Acids Res. 48, 12336–12347 (2020).
Theimer, C. A., Blois, C. A. & Feigon, J. Structure of the human telomerase RNA pseudoknot reveals conserved tertiary interactions essential for function. Mol. Cell 17, 671–682 (2005).
Chen, J. L. & Greider, C. W. Functional analysis of the pseudoknot structure in human telomerase RNA. Proc. Natl Acad. Sci. USA. 102, 8080–8085 (2005). discussion 8077-8089.
Mihalusova, M., Wu, J. Y. & Zhuang, X. Functional importance of telomerase pseudoknot revealed by single-molecule analysis. Proc. Natl Acad. Sci. USA. 108, 20339–20344 (2011).
Wang, Y., Yesselman, J. D., Zhang, Q., Kang, M. & Feigon, J. Structural conservation in the template/pseudoknot domain of vertebrate telomerase RNA from teleost fish to human. Proc. Natl Acad. Sci. USA. 113, E5125–E5134 (2016).
Dzatko, S. et al. Evaluation of the stability of DNA i-motifs in the nuclei of living mammalian cells. Angew. Chem. Int. Ed. 57, 2165–2169 (2018).
Zeraati, M. et al. I-motif DNA structures are formed in the nuclei of human cells. Nat. Chem. 10, 631–637 (2018).
Abou Assi, H., Garavis, M., Gonzalez, C. & Damha, M. J. i-Motif DNA: structural features and significance to cell biology. Nucleic Acids Res. 46, 8038–8056 (2018).
Donlic, A. & Hargrove, A. E. Targeting RNA in mammalian systems with small molecules. Wiley Interdiscip. Rev. RNA 9, e1477 (2018).
Falese, J. P., Donlic, A. & Hargrove, A. E. Targeting RNA with small molecules: from fundamental principles towards the clinic. Chem. Soc. Rev. 50, 2224–2243 (2021).
Monchaud, D. & Teulade-Fichou, M. P. A hitchhiker’s guide to G-quadruplex ligands. Org. Biomol. Chem. 6, 627–636 (2008).
Asamitsu, S., Bando, T. & Sugiyama, H. Ligand design to acquire specificity to intended G-quadruplex structures. Chemistry 25, 417–430 (2019).
Spiegel, J., Adhikari, S. & Balasubramanian, S. The structure and function of DNA G-quadruplexes. Trends Chem. 2, 123–136 (2020).
Umar, M. I., Ji, D., Chan, C. Y. & Kwok, C. K. G-quadruplex-based fluorescent turn-on ligands and aptamers: from development to applications. Molecules 24, 2416 (2019).
Collie, G. W. & Parkinson, G. N. The application of DNA and RNA G-quadruplexes to therapeutic medicines. Chem. Soc. Rev. 40, 5867–5892 (2011).
Chen, X. C. et al. Tracking the dynamic folding and unfolding of RNA G-quadruplexes in live cells. Angew. Chem. Int. Ed. 57, 4702–4706 (2018).
Moruno-Manchon, J. F. et al. Small-molecule G-quadruplex stabilizers reveal a novel pathway of autophagy regulation in neurons. eLife 9, e52283 (2020).
Di Antonio, M. et al. Single-molecule visualization of DNA G-quadruplex formation in live cells. Nat. Chem. 12, 832–837 (2020).
Zafferani, M. & Hargrove, A. E. Small molecule targeting of biologically relevant RNA tertiary and quaternary structures. Cell Chem. Biol. 28, 594–609 (2021).
Tao, Y., Zheng, Y., Zhai, Q. & Wei, D. Recent advances in the development of small molecules targeting RNA G-quadruplexes for drug discovery. Bioorg. Chem. 110, 104804 (2021).
Arthanari, H., Basu, S., Kawano, T. L. & Bolton, P. H. Fluorescent dyes specific for quadruplex DNA. Nucleic Acids Res. 26, 3724–3728 (1998).
Paramasivan, S. & Bolton, P. H. Mix and measure fluorescence screening for selective quadruplex binders. Nucleic Acids Res. 36, e106 (2008).
Ren, J. et al. Label-free detection of nucleic acids by turn-on and turn-off G-quadruplex-mediated fluorescence. Anal. Bioanal. Chem. 399, 2763–2770 (2011).
Xu, S. et al. Thioflavin T as an efficient fluorescence sensor for selective recognition of RNA G-quadruplexes. Sci. Rep. 6, 24793 (2016).
Renaud de la Faverie, A., Guedin, A., Bedrat, A., Yatsunyk, L. A. & Mergny, J. L. Thioflavin T as a fluorescence light-up probe for G4 formation. Nucleic Acids Res. 42, e65 (2014).
Hu, M. H. et al. Specific targeting of telomeric multimeric G-quadruplexes by a new triaryl-substituted imidazole. Nucleic Acids Res. 45, 1606–1618 (2017).
Hu, M. H. et al. Discovery of a new four-leaf clover-like ligand as a potent c-MYC transcription inhibitor specifically targeting the promoter G-quadruplex. J. Med. Chem. 61, 2447–2459 (2018).
Hu, M. H. et al. Development of a smart fluorescent sensor that specifically recognizes the c-MYC G-quadruplex. Anal. Chem. 91, 2480–2487 (2019).
Sun, R. et al. c-Myc G-quadruplex is sensitively and specifically recognized by a fluorescent probe. Talanta 226, 122125 (2021).
Fernando, H. et al. Genome-wide analysis of a G-quadruplex-specific single-chain antibody that regulates gene expression. Nucleic Acids Res. 37, 6716–6722 (2009).
Biffi, G., Tannahill, D., McCafferty, J. & Balasubramanian, S. Quantitative visualization of DNA G-quadruplex structures in human cells. Nat. Chem. 5, 182–186 (2013).
Lam, E. Y., Beraldi, D., Tannahill, D. & Balasubramanian, S. G-quadruplex structures are stable and detectable in human genomic DNA. Nat. Commun. 4, 1796 (2013).
Biffi, G., Di Antonio, M., Tannahill, D. & Balasubramanian, S. Visualization and selective chemical targeting of RNA G-quadruplex structures in the cytoplasm of human cells. Nat. Chem. 6, 75–80 (2014).
Henderson, A. et al. Detection of G-quadruplex DNA in mammalian cells. Nucleic Acids Res. 42, 860–869 (2014).
Dang, D. T. & Phan, A. T. Development of fluorescent protein probes specific for parallel DNA and RNA G-quadruplexes. Chembiochem 17, 42–45 (2016).
Ngo, K. H. et al. Cyclization of a G4-specific peptide enhances its stability and G-quadruplex binding affinity. Chem. Commun. 56, 1082–1084 (2020).
Zheng, K. W. et al. Detection of genomic G-quadruplexes in living cells using a small artificial protein. Nucleic Acids Res. 48, 11706–11720 (2020).
Liu, K. C. et al. Affinity-selected bicyclic peptide G-quadruplex ligands mimic a protein-like binding mechanism. J. Am. Chem. Soc. 142, 8367–8373 (2020).
Minard, A. et al. A short peptide that preferentially binds c-MYC G-quadruplex DNA. Chem. Commun. 56, 8940–8943 (2020).
Chen, J. et al. Selective discrimination and classification of G-quadruplex structures with a host–guest sensing array. Nat. Chem. 13, 488–495 (2021).
Chen, S. B. et al. Visualization of NRAS RNA G-quadruplex structures in cells with an engineered fluorogenic hybridization probe. J. Am. Chem. Soc. 138, 10382–10385 (2016).
Tan, D. J. Y., Das, P., Winnerdy, F. R., Lim, K. W. & Phan, A. T. Guanine anchoring: a strategy for specific targeting of a G-quadruplex using short PNA, LNA and DNA molecules. Chem. Commun. 56, 5897–5900 (2020).
He, Y. D. et al. Selective targeting of guanine-vacancy-bearing G-quadruplexes by G-quartet complementation and stabilization with a guanine–peptide conjugate. J. Am. Chem. Soc. 142, 11394–11403 (2020).
Cadoni, E., De Paepe, L., Manicardi, A. & Madder, A. Beyond small molecules: targeting G-quadruplex structures with oligonucleotides and their analogues. Nucleic Acids Res. 49, 6638–6659 (2021).
Jiang, W. et al. Mirror-image polymerase chain reaction. Cell Discov. 3, 17037 (2017).
Ling, J. J. et al. Mirror-image 5S ribonucleoprotein complexes. Angew. Chem. Int. Ed. 59, 3724–3731 (2020).
Wang, M. et al. Mirror-image gene transcription and reverse transcription. Chem 5, 848–857 (2019).
Sczepanski, J. T. & Joyce, G. F. A cross-chiral RNA polymerase ribozyme. Nature 515, 440–442 (2014).
Sefah, K., Shangguan, D., Xiong, X., O’Donoghue, M. B. & Tan, W. Development of DNA aptamers using Cell-SELEX. Nat. Protoc. 5, 1169–1185 (2010).
Kwok, C. K. & Balasubramanian, S. Targeted detection of G-Quadruplexes in Cellular RNAs. Angew. Chem. Int. Ed. 54, 6751–6754 (2015).
Kwok, C. K., Marsico, G., Sahakyan, A. B., Chambers, V. S. & Balasubramanian, S. rG4-seq reveals widespread formation of G-quadruplex structures in the human transcriptome. Nat. Methods 13, 841–844 (2016).
Kikin, O., D’Antonio, L. & Bagga, P. S. QGRS Mapper: a web-based server for predicting G-quadruplexes in nucleotide sequences. Nucleic Acids Res. 34, W676–W682 (2006).
Garant, J. M., Perreault, J. P. & Scott, M. S. Motif independent identification of potential RNA G-quadruplexes by G4RNA screener. Bioinformatics 33, 3532–3537 (2017).
Brazda, V. et al. G4Hunter web application: a web server for G-quadruplex prediction. Bioinformatics 35, 3493–3495 (2019).
Yeung, P. Y. et al. Systematic evaluation and optimization of the experimental steps in RNA G-quadruplex structure sequencing. Sci. Rep. 9, 8091 (2019).
Kwok, C. K., Sahakyan, A. B. & Balasubramanian, S. Structural analysis using SHALiPE to reveal RNA G-quadruplex formation in human precursor microRNA. Angew. Chem. Int. Ed. 55, 8958–8961 (2016).
Kwok, C. K., Ding, Y., Tang, Y., Assmann, S. M. & Bevilacqua, P. C. Determination of in vivo RNA structure in low-abundance transcripts. Nat. Commun. 4, 2971 (2013).
Lyu, K., Chen, S. B., Chan, C. Y., Tan, J. H. & Kwok, C. K. Structural analysis and cellular visualization of APP RNA G-quadruplex. Chem. Sci. 10, 11095–11102 (2019).
Chan, K. L. et al. Structural analysis reveals the formation and role of RNA G-quadruplex structures in human mature microRNAs. Chem. Commun. 54, 10878–10881 (2018).
Chan, C. Y., Umar, M. I. & Kwok, C. K. Spectroscopic analysis reveals the effect of a single nucleotide bulge on G-quadruplex structures. Chem. Commun. 55, 2616–2619 (2019).
Acknowledgements
This work is supported by the Shenzhen Basic Research Project (JCYJ20180507181642811), Research Grants Council of the Hong Kong SAR, China Projects CityU 11100421, CityU 11101519, CityU 11100218, N_CityU110/17, Croucher Foundation Project No. 9509003, State Key Laboratory of Marine Pollution Director Discretionary Fund, City University of Hong Kong projects 7005503, 9680261 and 9667222 to C.K.K.; M.I.U. received support during his PhD from the Nigerian government through the Petroleum Technology Development Fund. This paper was written during C.-Y.C.’s PhD period in the Thomas Carell Lab, LMU, Munich, Germany. The final revision of this paper was done during M.I.U.’s postdoc period in the Markus Hafner Lab, NIAMS, NIH, Maryland, USA. We thank H. L. Lau for proofreading.
Author information
Authors and Affiliations
Contributions
C.K.K. supervised the study. M.I.U. and C.-Y. C. performed the experiments. M.I.U., C.-Y. C. and C.K.K. conducted the data analysis. All authors contributed the ideas, discussed the results and wrote the manuscript.
Corresponding author
Ethics declarations
Competing interests
The authors declare no competing interests.
Peer review
Peer review information
Nature Protocols thanks Jean-Louis Mergny and the other, anonymous, reviewer(s) for their contribution to the peer review of this work.
Additional information
Related links
Key references using this protocol
Chan, C. Y. & Kwok, C. K. Angew. Chem. Int. Ed. 59, 5293–5297 (2020): https://doi.org/10.1002/anie.201914955
Umar, M. I. & Kwok, C. K. Nucleic Acids Res. 48, 10125–10141 (2020): https://doi.org/10.1093/nar/gkaa759
This protocol is an extension to: Nat. Protoc. 1, 2204–2212 (2006): https://doi.org/10.1038/nprot.2006.372
Supplementary information
Source data
Source Data Fig. 2
Unprocessed gel.
Source Data Fig. 3
Unprocessed gel.
Source Data Fig. 4
Unprocessed gel.
Source Data Fig. 5
Unprocessed agar plate image.
Source Data Fig. 6
Unprocessed gel.
Source Data Fig. 10
Unprocessed gel.
Source Data Fig. 10
Statistical source data for Fig. 10b,d plots.
Source Data Fig. 11
Statistical source data for Fig. 11.
Source Data Fig. 13
Statistical source data for Fig. 13.
Source Data Fig. 14
Unprocessed gel of Fig. 14a.
Source Data Fig. 14
Statistical source data for Fig. 14b,c.
Rights and permissions
About this article

Cite this article
Umar, M.I., Chan, CY. & Kwok, C.K. Development of RNA G-quadruplex (rG4)-targeting l-RNA aptamers by rG4-SELEX. Nat Protoc 17, 1385–1414 (2022). https://doi.org/10.1038/s41596-022-00679-6
Received:
Accepted:
Published:
Issue Date:
DOI: https://doi.org/10.1038/s41596-022-00679-6
This article is cited by
-
The application of Aptamer in biomarker discovery
Biomarker Research (2023)
Comments
By submitting a comment you agree to abide by our Terms and Community Guidelines. If you find something abusive or that does not comply with our terms or guidelines please flag it as inappropriate.
