
Abstract
The trRosetta (transform-restrained Rosetta) server is a web-based platform for fast and accurate protein structure prediction, powered by deep learning and Rosetta. With the input of a protein’s amino acid sequence, a deep neural network is first used to predict the inter-residue geometries, including distance and orientations. The predicted geometries are then transformed as restraints to guide the structure prediction on the basis of direct energy minimization, which is implemented under the framework of Rosetta. The trRosetta server distinguishes itself from other similar structure prediction servers in terms of rapid and accurate de novo structure prediction. As an illustration, trRosetta was applied to two Pfam families with unknown structures, for which the predicted de novo models were estimated to have high accuracy. Nevertheless, to take advantage of homology modeling, homologous templates are used as additional inputs to the network automatically. In general, it takes ~1 h to predict the final structure for a typical protein with ~300 amino acids, using a maximum of 10 CPU cores in parallel in our cluster system. To enable large-scale structure modeling, a downloadable package of trRosetta with open-source codes is available as well. A detailed guidance for using the package is also available in this protocol. The server and the package are available at https://yanglab.nankai.edu.cn/trRosetta/ and https://yanglab.nankai.edu.cn/trRosetta/download/, respectively.
Introduction
In recent years, substantial progress has been made in protein structure prediction, especially in de novo protein structure prediction, as witnessed by the critical assessment of protein structure prediction (CASP) experiments1,2. This advance can be mostly attributed to the application of powerful deep learning techniques. Deep learning is now becoming an indispensable component for improving the accuracy of protein structure prediction.
A two-step approach is adopted in most of the deep learning–based protein structure prediction methods. Deep learning is first used to predict inter-residue 2D contacts/distances, which are then used as restraints for subsequent 3D structure prediction. The first representative approach is RaptorX-Contact by Xu and colleagues, in which the deep residual network (ResNet) was successfully applied to protein contact prediction3. As shown in the CASP12 experiment, the precision of predicted binary inter-residue contacts by RaptorX-Contact doubled compared with previous methods4. The binary contact prediction was further extended to real distance prediction to include more information5. The range of considered distances was divided into discrete bins, and the real distance measurements were replaced with bin numbers. This allows the data to be formatted as a multiclass classification problem so that a similar network in contact prediction can be applied. For example, in trRosetta (transform-restrained Rosetta), the distance (2,20 Å) was divided into 36 distinct bins with a bin size of 0.5 Å (ref. 6). DeepMind developed a similar system called AlphaFold1, which ranked at the top in CASP137. Inspired by these successes, we proposed that these results could be further improved by using inter-residue orientations as well as distance measurements. In trRosetta, these geometries are converted into restraints to guide the energy minimization–based de novo modeling. The template modeling score (TM-score)8 of the predicted structure models by trRosetta was shown to be higher than AlphaFold1, even though trRosestta was trained with fewer computing resources6.
In CASP14, DeepMind’s AlphaFold2 took one more step forward by replacing almost all components of AlphaFold1. It almost solved the single-chain-based protein structure prediction problem, achieving a median global distance test-total score (GDT-TS)9 of 92.4. According to the CASP14 meeting, this advance was mostly due to the application of end-to-end training with the attention-based neural network (3D equivariant transformer), which took raw multiple sequence alignment as input and produced the protein structure directly. The work of AlphaFold2 is regarded as one of the milestones in protein structure prediction and is anticipated to ‘change everything’10. Recently, DeepMind released the source code of AlphaFold2, which enables the public to have access to the AlphaFold system11. On the basis of the success of AlphaFold2, we believe that more deep learning–based methods will be developed in the future (e.g., the recent RoseTTAFold12).
In this protocol, we present the trRosetta server, one of the most popular web-based platforms for rapid and accurate protein structure prediction. Since its release in 2020, we have received >60,000 submissions by >7,000 users from >80 countries/regions. The standalone package has been downloaded by >2,000 registered users. These data indicate that trRosetta has been widely applied in the communities of structural biology, biochemistry and computational biology. We anticipate that this protocol will help the communities make better use of the trRosetta system.
Development of the protocol
trRosetta was developed after CASP13, inspired by AlphaFold1 and other related works. The flowchart of the trRosetta algorithm is presented in Fig. 1a. The details about trRosetta have been described elsewhere6. A brief overview is summarized here for the sake of completeness. The query sequence is searched against the sequence database uniclust30_2018_08 by HHblits13 to generate a multiple sequence alignment (MSA). A total of 526 1-site and 2-site feature channels are derived from the MSA, which are fed into a deep neural network (Fig. 1b) to predict the inter-residue geometries, including distance and orientations. Optional features from homologous templates (if available according to HHsearch14) are used as additional inputs to the network. The predicted geometries are then transformed into restraints to guide the structure prediction by direct energy minimization, which is implemented under the Rosetta framework15. For the purpose of accelerating scientific research for the protein structure prediction community and benefiting biologists, we established the trRosetta server and released the source codes in a standalone package in 2020.

a, The flowchart of the trRosetta protocol. With a target sequence as input, an optimal MSA is generated on the basis of the software HHblits. When homologous templates are found in the Protein Data Bank (PDB), they are fed into a deep neural network together with the generated multiple sequence alignment (MSA) to predict the 2D inter-residue geometries, including distance (d) and three orientations (θ, ω and φ). These geometries are converted into smoothed energy terms after reference correction, which are used as restraints to guide the subsequent step of structure modeling. A two-step procedure is applied for the structure prediction. 30 coarse-grained models are first generated with the quasi-Newton-based energy minimization. The low-energy models are then submitted to the procedure of a fast constrained relaxation to generate the final structure models. b, The architecture of the deep neural network for inter-residue geometry prediction. With features derived from the MSA, the multi-task learning network is used to predict the 2D inter-residue geometries. conv2d, 2D convolution layer; ELU, exponential linear unit; InstanceNorm, instance normalization layer.
Updates made since the first release
A few updates were made after the first release to improve the performance.
MSA selection and MSA submission
It was shown that MSA selection is an efficient way of improving the accuracy of the final structure models6. However, it takes much computational cost to generate multiple MSAs iteratively. At the time of the server establishment, to save the time spent in MSA generation, a single MSA was generated with a fixed e-value cutoff (i.e., 1) in HHblits13, which works well for most targets. However, a more stringent e-value cutoff may be required for some targets to remove noise. To keep a balance between speed and accuracy, a total of six MSAs are now considered: two default MSAs at two e-value cutoffs (1 and 0.001) plus four filtered MSAs at coverage cutoffs of 75% and 50% of the default MSAs. Each of these MSAs is submitted to the network to predict the 2D geometries. The one with the highest average probability of the top-predicted distances is selected as the final MSA. In addition, an option is available for accepting MSAs prepared by the users, such as those from Pfam16.
New network architecture
As shown in Fig. 1b, the central part of the network is a stack of 16 Res2Net blocks17, which takes the input of an L×L×526 tensor. In each block, after a 1×1 convolution layer, the feature maps are split into four subsets channel-wise, followed by an identity map and three dilated 3×3 convolution layers. Another 1×1 convolution layer is applied to combine the feature maps. The output of the network consists of the inter-residue distance (d) and three orientations (φ, ω, θ).
Inclusion of template-based restraints
The original trRosetta server is fully based on de novo modeling. However, for targets with detectable homologous structures in the Protein Data Bank (PDB) library18, models built by template-based methods are usually more accurate than those built by de novo modeling. To take advantage of homology modeling, an automated template detection by HHsearch14 was recently included to improve the accuracy. Homologous templates were detected for >70% of the recent 9,181 job submissions. The templates may cover different regions of the query but have a large overlap for most targets. A similar network was trained to combine features from homologous templates and MSA. Nevertheless, users who are interested in fully de novo modeling can select the option without templates.
Applications of trRosetta
Protein structure prediction
The most popular application of the trRosetta server is to predict the structure models for targets of interest. One of the key features in trRosetta is de novo modeling. Nevertheless, to enhance the performance for targets with detectable homologous structures, the server automatically includes homologous templates. Because trRosetta combines both de novo and template-based modeling (TBM), it works well for a broad range of targets. For example, trRosetta was successfully applied to build initial structure models in the cryo-electron microscopy–based structure determinations for the human endoplasmic reticulum membrane protein complex19,20 and the endogenous human BAF complex21. The trRosetta models were shown to fit well with the cryo-electron microscopy experimental data for these targets. trRosetta was also used to build structure models for severe acute respiratory syndrome coronavirus 2–related proteins, such as NSP122 and ORF4a23, which do not have homologous structures in PDB. The predicted structure models can be used for further research, such as structure-based function annotation, molecular docking and drug design.
Validation of designed proteins
Because of trRosetta’s de novo feature and efficiency, it can be applied to the problem of protein design to validate the foldability of designed sequences. As demonstrated in our previous work6, with a single sequence as input, trRosetta can build accurate structure models for designed proteins. This suggests that trRosetta has implicitly learned the fundamental sequence-structure relationship. Based on such observation, trRosetta was used to verify the possibility of a hallucinated sequence to fold into a stable structure in trDesign24. A hallucinated sequence is a designed sequence that is obtained by introducing random mutations progressively based on Monte Carlo simulations, starting from a random sequence. The hypothesis is that if a designed protein is foldable, trRosetta should be able to produce a reasonable structure model. Therefore, before performing the time-consuming wet-lab experiments, it is advisable to validate the designed protein with trRosetta first. For a designed protein, if the predicted structure model by trRosetta is in low confidence (e.g., with estimated TM-score <0.5), it is likely that this design is not foldable, and no wet-lab experiments are required.
Comparison between trRosetta and similar servers
Besides trRosetta, there are many other public servers for protein structure prediction. Table 1 presents a comparison between trRosetta and 17 other servers in terms of six features: modeling approach, deep learning, confidence estimation, downloadable package, response time and TM-score.
Modeling approach
The servers can be clustered into three groups according to modeling approach: TBM, de novo modeling and unified. For trRosetta, FALCON, MULTICOM and Robetta, both free modeling (FM) and TBM are provided in a unified server, whereas others are either for de novo modeling or TBM. Note that trRosetta has also been available as a module (TR) in the Robetta server since September 2020. Its major difference with the trRosetta server introduced in this protocol is additional rounds of refinement, which improves the structure quality slightly at the expense of more running time (see the response time and TM-score columns in Table 1).
Deep learning
Deep learning algorithms are applied in about half of the listed servers.
Confidence score estimation
10 servers provide confidence score estimation, which can guide the users to make better use of the predicted models.
Downloadable version
More than half of the listed servers, including trRosetta, provide downloadable package to install locally for large-scale applications.
Response time
To compare the speed and accuracy of the above-mentioned servers, we collected 15 targets from CAMEO (between May 29, 2021 and June 5, 2021) and submitted them to those servers. Note that the response time listed in Table 1 may include queueing time, depending on the availability of computer resource from each individual laboratory. Because QUARK allows submissions only with length <200 residues, and MULTICOM and FALCON jobs stay queuing/running for >7 d, no results are available for these three servers.
TM-score
The TR module in Robetta has slightly higher TM-score than trRosetta, probably due to its additional steps of refinement with more running time. Overall, with or without templates, trRosetta takes, on average, <1.5 h per target to return the prediction results with an average TM-score over 0.8, suggesting the advantage of trRosetta in both speed and accuracy in protein structure prediction.
Performance of trRosetta-based methods
Performance in CASP14
Previous benchmark tests suggested that trRosetta outperformed the top human group AlphaFold1 and the top server group Zhang-Server on CASP13’s 31 FM targets6 (Supplementary Table 1). On CAMEO’s 131 hard targets (Supplementary Table 2), the trRosetta models had higher TM-score than the models by the top Robetta server6.
In addition, we participated in the bind test of the CASP14 experiment with trRosetta-based algorithm (group name: Yang-Server). Here, two kinds of scoring systems are used to rank the groups in CASP14. The first one is based on the Z-scores of the raw GDT-TS scores9, which is adopted in the official ranking. The raw GDT-TS scores for the predicted models of a target are first calculated and are then converted into Z-scores by the following formula:
where N is the number of predicted models (one by each method), and μ and σ are the mean and standard deviation of the raw GDT-TS scores. The summed Z-scores over all targets are then used to rank the participating groups. According to the official results released by the CASP organizers, Yang-Server was 11th out of 47 server groups in the Z-score–based ranking. It was 5th after removing method variants from the same laboratory. Intuitively, Z-score measures how far a prediction is from the mean, but it does not indicate how accurate the predicted structure models are.
The second ranking is based on TM-score8, which ranges between 0 and 1. A TM-score >0.5 usually indicates a model with correctly predicted topology25. According to the assessment by Dr. Zhang (https://zhanglab.ccmb.med.umich.edu/casp14), Yang-Server ranked in the top 5 (top 2 after removing method variants form the same laboratory), with an average TM-score of 0.67. Figure 2a (a zoomed version is available in Supplementary Fig. 1) shows the average TM-score of five unique server groups on targets of different categories (58 TBM, 15 FM/TBM, 23 FM and 96 in total; see Supplementary Table 3 for more details). A few examples from CASP14 are presented in Fig. 2b,c. The first example is T1052, which was divided into three individual domains in the official evaluation. Figure 2b shows that trRosetta performed well on these domains, with TM-scores of 0.942, 0.796 and 0.796 on domains D1, D2 and D3, respectively. In particular, our model for the third domain has the highest accuracy among all submitted server models. Another example is T1054 (Fig. 2c), which was classified as a single-domain target in the official evaluation. As shown in the figure, it is in fact a two-domain-like target, and the orientation between the two domains is correctly predicted by our method, with a TM-score of 0.837.

a, The average TM-score of five representative server groups on a total of 96 CASP14 domains (58 TBM, 15 FM/TBM and 23 FM). The group Yang-Server is from our laboratory, which is trRosetta based. b and c, The native structures and predicted structure models by Yang-Server for CASP14 targets T1052 (b) and T1054 (c). T1052 is divided into three domains, and T1054 is a single-domain target in the official evaluation. For each domain, the native structure and the predicted model are shown in gray and rainbow cartoons, respectively. The TM-scores for T1052’s domains D1, D2 and D3 and T1054-D1 are 0.942, 0.796, 0.796 and 0.837, respectively.
Benefit of including homologous templates
Below, we discuss the improvement of using homologous templates in trRosetta based on an independent dataset collected from the CAMEO experiment (from June 13, 2020 to September 5, 2020). According to the classification in CAMEO, this dataset consists of 161 targets, including 31 easy, 99 medium and 31 hard targets (Supplementary Table 4). HHsearch was used to detect templates from a library that was constructed before June 13, 2020. On the basis of the outputs from HHsearch, we define a template as homologous to the query if the following conditions are satisfied: probability >60%, E-value <0.001 and coverage >30%. With these criteria, homologous templates were detected for 143 targets. For the remaining 18 targets (8 medium and 10 hard), we also tried to include the top template in trRosetta. It turned out that there was no significant difference in the model quality between using and not using templates for these 18 targets. However, for the 143 targets that have homologous templates, the incorporation of templates improves the accuracy of both predicted contacts and structure models. Specifically, the average precision of the top L predicted contacts (sequence separation ≥12) and the average TM-score of the predicted models are shown in Fig. 3a,b, respectively. It shows that the inclusion of homologous templates is beneficial for targets in all degrees of difficulties, and the improvement on the easy targets is more significant. Indeed, when templates are used, trRosetta generates models with higher TM-score for 30/31 easy, 87/91 medium and 16/21 hard targets, according to a head-to-head comparison. Figure 3c presents the trRosetta models for the CAMEO target 6LPA_A predicted without and with templates. By including homologous templates, the TM-score of the predicted model for this target increased from 0.358 to 0.936.

a, The comparison for top L long and medium contact precision between using and not using templates in trRosetta on 143 CAMEO targets. b, The TM-score comparison between trRosetta’s modeling with and without templates on 143 CAMEO targets. c, The structure models predicted by trRosetta without template and with template for a CAMEO target 6LPA_A. The native structure and the predicted models are shown in gray and rainbow cartoons, respectively. With the inclusion of homologous templates, the TM-score of the predicted model increased from 0.358 to 0.936.
Experimental design
This protocol contains two procedure sections. Procedure 1 describes how to use the online service of trRosetta, and Procedure 2 presents detailed guidance on installing and running trRosetta locally.
MSA generation
The accuracy of the predicted distance and orientations depends on the quality of the input MSA. For the trRosetta server, as introduced in Development of the protocol, multiple MSAs were generated by searching HHblits13 against the sequence database uniclust30_2018_08, at different cutoffs of e-value (0.001, 1) and coverage (50%, 75%). Note that this setting is independent of sequence length. The MSA used for further 2D geometry prediction is selected by the average probability of top predicted distances. As for the standalone version, users can generate MSAs similarly. For most targets, it is enough to generate one MSA with default options in HHblits. However, when no significant hits are returned, generating multiple MSAs with different tools and databases is recommended. For example, it is also worth searching the metagenome sequence databases with hmmsearch26 to enrich the MSA generation27,28.
Prediction of inter-residue 2D geometries
The inter-residue 2D geometries are predicted by a deep neural network. The input to this network includes features extracted from the input MSA and optional features from homologous templates. Unlike most other deep learning–based contact/distance methods, no other input (e.g., contact predictions by third-party software) is required for the network. The current prediction is a consensus of five individual network models, making it very robust. Because this step is independent of the subsequent step of structure realization, it is also feasible to use other methods to predict the 2D geometries. Users can either further optimize the network adopted by trRosetta or design other deep learning methods for the 2D geometry prediction. Improved prediction of geometries can definitely lead to more accurate structure prediction. We continue to improve our method by developing new network topologies and training strategies.
3D structure prediction
The 3D structure prediction process in trRosetta is based on energy minimization with constraints derived from the predicted inter-residue distance and orientations. However, no steps of fragment assembly are used in trRosetta, due to the following observations. The first is that fragment assembly is very slow. The second is that lower modeling accuracy was obtained in our initial test of a contact-assisted fragment assembly protocol (which can be seen as well from Table 1 for the AB module in the Robetta server). In fact, as shown in our previous benchmark, structure prediction in trRosetta is mostly driven by the predicted restraints6. By implementing direct energy minimization, trRosetta is ~1,000 times faster than the conventional Rosetta (internal estimation). A two-step procedure is adopted in trRosetta as follows. First, 30 coarse-grained models (that contain only backbone atoms and side-chain centers) are generated on the basis of constrained energy minimization with the predicted inter-residue 2D geometries. The low-energy models are then relaxed to produce the final full-atom models. This process is very fast and efficient. The corresponding scripts were released in 2020. As shown in the CASP14 Abstracts, many participating groups built their methods on the basis of a similar procedure.
Confidence score of the predicted structure models
In our earlier research, the average probability of predicted top contacts and the average pairwise TM-score between the top 10 non-constrained models correlate well with the accuracy of the final models6. With the network update and the inclusion of templates, the correlation between the first term (i.e., the average probability) and TM-score decreases. To give a reliable confidence estimation for the final model, the probability is extended from contact to distance, in which more residue pairs are considered. Linear regression is then applied to estimate the TM-score for the predicted structure models. Figure 4a,b shows the relationship between the real TM-score and the estimated TM-score for the trRosetta models built without/with templates on the 161/143 CAMEO targets mentioned above. The Person’s correlation coefficients of the data shown in Fig. 4a,b are 0.85 and 0.73, respectively.

a and b, The relationship between the real TM-score and the estimated TM-score of the models built with de novo prediction (a) or using templates (b). c, The sequence length–running time relationship based on 3,505 job submissions between 1 and 30 December, 2020. Note that the maximum length for a target protein is 1,000. d and e, The predicted structure models for proteins from two Pfam families, PF03148 (d) and PF03756 (e), without known structures. These models are also available at the Pfam database.
Examples of structure prediction
Large-scale applications of the trRosetta algorithm are possible because of its advantage in both speed and accuracy (see Fig. 4c for speed estimation). Recently, the trRosetta algorithm was applied to predict the structures of proteins in the Pfam database. The predicted models are publicly available at the Pfam and InterPro databases16. In Fig. 4d,e, we show the predicted structure models for two Pfam families that do not have experimental structures yet. The first is for the Pfam family Tektin (Fig. 4d, PF03148). According to the Pfam annotation, Tektin consists of several alpha-helical regions that are predicted to form coiled coils. We built de novo structural models for this family by using the MSA from Pfam. The predicted structure model shown in Fig. 4d is consistent with the description in Pfam. The estimated TM-score for the predicted model is 0.75, which demonstrates that the model is of high accuracy. The second example is for the Pfam family AfsA (Fig. 4e, PF03756). This family consists of key enzymes in A-factor biosynthesis. According to the Pfam annotation, the structure for this family has a hotdog fold. The predicted de novo model (Fig. 4e, with estimated TM-score >0.8) does belong to the hotdog fold according to the results by a fast search against the PDB database with the mTM-align server29. We also used the template-based modeling server Phyre2 to build structures for this protein. The top-predicted model by Phyre2 has a TM-score of 0.55 with our de novo model, indicating that this target is of medium difficulty.
Limitations and future development
There are a few limitations in trRosetta. First, it is a great challenge to determine the structure of disordered proteins that lack stable structures. Similar to other structure prediction algorithms, trRosetta does not work well for disordered proteins. Another limitation is the requirement for the existence of a few sequence homologs to build a meaningful MSA. For proteins that do not have any sequence homologs in current sequence databases, the predicted structure models are usually of low accuracy. For example, for the target T1064 from CASP14 (the ORF8 protein of severe acute respiratory syndrome coronavirus 2), only eight (resp. 1) homologous sequences could be identified at pairwise sequence identity 0.9 (resp. 0.5). This makes it very challenging to predict accurate models for this target by trRosetta and other methods, including AlphaFold2 and RoseTTAFold. However, we believe that this problem can be solved gradually by increasing sequence data. Searching against the current metagenome databases can also partly address this issue. The last limitation is that the server is only for monomer structure prediction. We are extending our approach for predicting protein-protein complex structure.
Materials
Equipment for Procedure 1
-
Computer: a personal computer with Internet access and a web browser
-
Data: the amino acid sequence or a pre-generated MSA for a target protein of interest
Equipment for Procedure 2
-
A personal computer (or a computer cluster) with Linux system (CentOS, RedHat and Ubuntu are supported); a GPU, although not required, may be faster for running the neural network with graphics processing unit (GPU) cards.
Required software and database for Procedure 2
To run trRosetta locally, users need to install the following third-party software and databases first.
-
Python3 (available at https://www.python.org/downloads; already installed in most Linux systems)
-
Tensorflow (available at https://pypi.org/project/tensorflow, version 1.13 or 1.14)
-
PyRosetta3 (available at https://www.pyrosetta.org/downloads/legacy-pyrosetta3-download)
-
Perl5 (available at https://www.perl.org; already installed in most Linux systems)
-
HHsuite (available at https://github.com/soedinglab/HHsuite)
-
HHsuite sequence profile database (available at http://wwwuser.gwdg.de/~compbiol/uniclust)
-
HHsuite PDB profile database (optional; it is required only if structural templates are needed; available at http://wwwuser.gwdg.de/~compbiol/data/hhsuite/databases/hhsuite_dbs/)
-
PDB structure databases (optional; they are required only if structural templates are needed; available at https://yanglab.nankai.edu.cn/trRosetta/download/)
-
Pre-trained network models (available at https://yanglab.nankai.edu.cn/trRosetta/benchmark/)
When these are in place, download the trRosetta package at https://yanglab.nankai.edu.cn/trRosetta/download after a simple registration.
Procedure 1
Sequence submission
Timing 2 min
-
1
Go to the trRosetta server homepage (https://yanglab.nankai.edu.cn/trRosetta).
-
2
Copy and paste your target sequence in FASTA format or an MSA in the section ‘Provide the protein data (mandatory)’ (label 1 in Fig. 5). You can also upload the data file by clicking on the ‘Choose File’ button (label 2 in Fig. 5). Then specify the input type of your protein data (label 3 in Fig. 5).
Fig. 5: The trRosetta homepage for job submission. 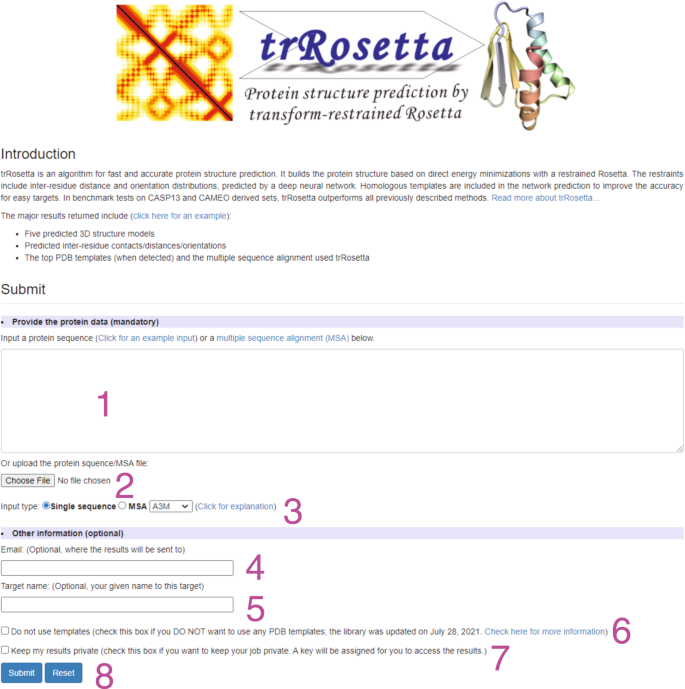
To submit a job, users should input the amino acid sequence or an MSA of the target protein by using label 1 or 2. The input format (single sequence or MSA) can be specified by label 3. Users can provide an email address and target name for tracking the modeling status with labels 4 and 5. When homologous templates are identified in PDB, they are automatically included in the modeling to improve accuracy. However, users can turn this function off by selecting the option ‘Do not use templates’ (label 6). By default, the job results are available to the public. Please select the option ‘Keep my results private’ (label 7) to protect the results, by which a key will be assigned to access the modeling results. The job can be submitted by clicking on the ‘Submit’ button (label 8).
Caution
The trRosetta server builds models for proteins with length between 10 and 1,000 residues. Short proteins are known as short peptides, and they usually do not have stable structures unless binding with other proteins. It is thus less meaningful to predict their structures independently. The maximum length is 1,000 mainly because of the requirement for extensive computing resources for big proteins.
-
3
(Optional) Provide your email address (label 4 in Fig. 5). A notification email will be mailed to the specified email account upon job completion.
-
4
(Optional) Provide your target name (label 5 in Fig. 5). The given name will be shown on the result page. Otherwise, the target will be named ‘your_protein’ by default.
Critical step
Providing a target name is recommended to differentiate between different jobs, especially when the users have multiple submissions. This name will be provided in both the email notification and the result page, by which the users can easily find their own submissions.
-
5
Specify whether to use templates when homologous templates are available for your target (label 6 in Fig. 5). If you do not want to use any PDB templates for some special purpose, such as performing a benchmark test of the de novo prediction, please check the box ‘Do not use templates’. By default, homologous templates (when detected) will be used in the modeling.
-
6
Specify whether to keep your results private (label 7 in Fig. 5). By default, the modeling results are available to the public. If you want to keep your job private, please check the box ‘Keep my results private’. A key will be assigned right after your submission to access the results.
-
7
To submit the job, please click on the ‘Submit’ button (label 8 in Fig. 5). A confirmation of the submission will be mailed to the user if an email address was specified in Step 3.

Job monitoring
Timing depends on protein size (~1 h for a protein with ~300 amino acids)
-
8
Check the web page displaying the job ID and the URL links for tracking the job status and the modeling results upon submission. If the user chooses to keep the results private in Step 6, there will be two accessible links. Check the results by either clicking the first encrypted link with the assigned password, or visit the result page directly by clicking on the second link. There will be only one link if the ‘Keep my results private’ box in Step 6 was not checked.
Critical step
If you forget your password, you can email us with the job ID. The password will be sent to you manually. To avoid this issue, we recommend bookmarking the result page right after your submission.
-
9
The URL link in Step 8 points to a new job-monitoring page that is reloaded every minute. This page shows the job status, with the current stage highlighted in red color, and an estimated time for completion. The estimated time is based on Fig. 4c, which displays the relationship between the sequence length and the running time for all jobs submitted to the server in December 2020. It usually takes ~1 h to fold a protein with 300 amino acids. The prediction process is divided into eight steps from queuing in our job management system to the final stage of job completion. Either keep the page open or bookmark this page to check the results later. Once the job is done, this page will automatically display all the modeling results. At the same time, a notification email with instructions for accessing the result page will be sent to the user if an email address was provided in Step 3.
Analyzing the results
Timing 5 min
-
10
Upon job completion, a tarball file including the key modeling results is provided for download at the top of the result page (label 1 in Fig. 6). Save the results locally, because the prediction results will be removed in 1 month to save computer space.
Fig. 6: The result page for an example target (PDB ID: 6X61). 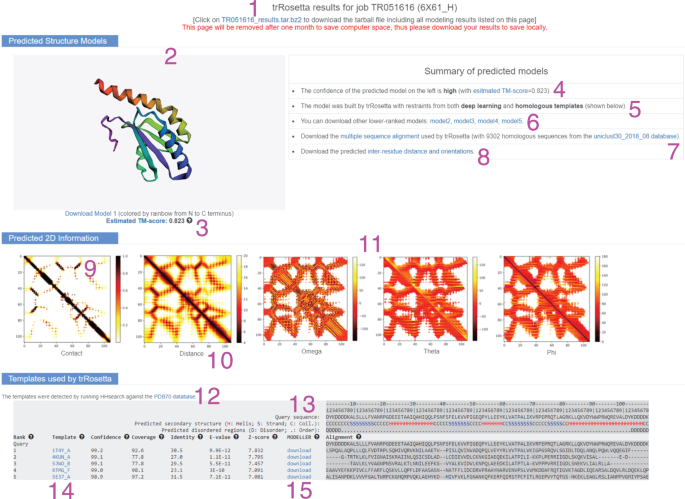
This page is divided into three sections. The first section visualizes the predicted top structure model in a rainbow cartoon. A brief summary is also given, including the confidence score of the model, the modeling method (de novo or templates used), links for downloading lower-ranked models, MSA and predicted inter-residue distance and orientations (the definitions are available in Supplementary Fig. 2). The second section shows the images of the predicted contact/distance and orientation maps. The last section lists the templates used in the modeling. When no templates are used, this section shows only the predicted 1D information (secondary structure and disorder).
-
11
View the ‘Predicted Structure Models’ section.
-
On the left-hand side of this section (label 2 in Fig. 6), the top-scoring model is visualized in a rainbow cartoon (from the N to the C terminus) by using the software 3Dmol30. Users can download this structure by clicking on the link provided under the visualized structure.
-
An estimated TM-score of this model is also provided (label 3 in Fig. 6). On the right-hand side, there is a summary of predicted models.
-
The confidence level (i.e., very low, low, medium, high or very high; label 4 in Fig. 6), which is based on the estimated TM-score, and the way that the models are built (i.e., either de novo or with the use of templates; label 5 in Fig. 6) are displayed.
-
In addition, other lower-ranked models (label 6 in Fig. 6), the multiple sequence alignment (label 7 in Fig. 6) and predicted inter-residue distance and orientations (label 8 in Fig. 6) can be downloaded separately.
-
-
12
View the ‘Predicted 2D Information’ section.
-
This section visualizes the predicted 2D geometries, including the binary contacts (label 9 in Fig. 6), real distances (label 10 in Fig. 6) and orientations (ω, θ and φ; label 11 in Fig. 6). Detailed explanations for the 2D geometries can be found in Supplementary Fig. 2.
-
The contact map presents the contacting probability for all residue pairs. The binary contact is a simplified representation of the real distance. Two residues are in contact if the distance between their C-β atoms (C-α for glycine) is <8 Å.
-
The distance map lists the predicted distance (between 4 and 20 Å) for all residue pairs.
-
The ranges for the orientations ω, θ and φ are (−180°, 180°), (−180°, 180°) and (0°, 180°), respectively. Note that the orientation maps usually show similar patterns with the distance map because they are limited only to those residue pairs with distance <20 Å.
-
-
13
View the predicted 1D information. A three-state secondary structure prediction predicted by PSSpred31 is displayed under the target sequence, where ‘H’ stands for alpha α-helix, ‘S’ stands for β-strand and ‘C’ stands for coil. Disorder prediction by DISOPRED32 is also provided, which consists of two states: disorder (D) and order (.). If the model is based on de novo prediction, the above-mentioned results will be displayed as a separation section (‘Predicted 1D information’). Otherwise, it will be included on the top of the section ‘Templates used by trRosetta’ (label 13 in Fig. 6).
-
14
View the ‘Templates used by trRosetta’ section. This section exists only if homologous templates are detected. The database used for template detection is shown on the top (label 12 in Fig. 6) A template is defined as ‘homologous’ if the probability (denoted by the ‘Confidence’ column in this section)is >0.6, the E-value is <0.001 and the coverage is >30%. For each template, there is a link to its entry in the PDB library (label 14 in Fig. 6). Other detailed results such as alignment coverage, sequence identity, Z-score and alignment are also displayed. In addition, homology models generated by MODELLER33 using the query-template alignments are available for download in this section (label 15 in Fig. 6).

Procedure 2
MSA generation
Timing 7 min
-
1
Prepare your target sequence in FASTA format (denoted by ‘seq.fasta’). The path of the FASTA file is denoted by $data_dir. Create a working directory and change the current directory to it. Then copy the sequence file to this directory.
» mkdir -p example » cd example » cp $data_dir/seq.fasta.
-
2
Run HHblits to generate an MSA (denoted by ‘seq.a3m’) for your target sequence.
»python $tr_dir/generate_msa.py -i seq.fasta -o seq.a3m -hhbin $hhsuite_dir/bin -hhdb $hhdb_dir/$hhdb
Here $tr_dir, $hhsuite_dir refer to the paths of the trRosetta and the HHsuite packages, respectively. $hhdb_dir is the path of the corresponding HHsuite database, and $hhdb is the database name. Two optional arguments are provided in this script, i.e., ‘-evalue’ for statistical significance cutoff (default: 0.001) and ‘-cpu’ for the number of CPUs to use (default: 2).
(Optional) Template detection
Timing 2 min
-
3
Run HHsearch to detect homologous templates.
» python $tr_dir/search_templates.py -i seq.a3m -o temp.npz –hhbin $hhsuite_dir/bin -hhdb $hhdb_dir/$hhdb -pdb_db $pdb_dir
The output template information is saved in a file in NPZ format (denoted by ‘temp.npz’). Here $pdb_dir is the path of the single-chain PDB database, and other variables are the same as those described in Step 2. Note that homologous templates are defined as those with HHsearch probability >60%, E-value <0.001 and coverage >30%. If no templates satisfy this condition, a warning message will be reported by the script. In this case, please proceed to the next step of de novo prediction.
Inter-residue geometry prediction
Timing 8 min (de novo), 13 min (with templates)
-
4
Predict the inter-residue distance and orientations.
» python $tr_dir/predict.py -i seq.a3m -o seq.npz -mdir $m_dir
The default mode is de novo prediction, which takes only an MSA file as input (denoted by ‘seq.a3m’) and produces an NPZ file (denoted by ‘seq.npz’) containing the predicted distance and orientations. Here, $m_dir refers to the directory of the pre-trained model.
In addition, when homologous templates are detected in Step 3, they can be incorporated into the network by using the option ‘-temp_npz’.
» python $tr_dir/predict.py -i seq.a3m -o seq.npz -mdir $m_dir -temp_npz temp.npz
Three more optional arguments are available, including ‘-cont’ for saving predicted contacts in CASP format, ‘-gpu’ to specify the GPU card to use (default: −1; i.e., does not use GPU) and ‘-cpu’ for specifying the number of CPU cores to use (default: 2).
Structure prediction
Timing 25 min
-
5
Generate structure models. The script ‘trRosetta.py’ takes the sequence file and the file of the predicted distance and orientation as inputs and produces one model (denoted by ‘model.pdb’) in a single run.
»python $tr_dir/trRosetta.py -npz seq.npz -fasta seq.fasta -o model.pdb
Note that this command generates only one model with default arguments. More optional arguments for this script are explained in Box 1. In most cases, this default running is enough when the predicted distance and orientations are in high confidence (e.g, with an average probability of top-predicted distances higher than 0.3, which can be calculated by the script top_prob.py). However, when the confidence is lower, it may be helpful to run this script multiple times to generate multiple models with different options and select the top models on the basis of the energy scores (the last score of the line starting with ‘pose’ in the output structure file). To this end, a script named ‘run_trRosetta.py’ is provided to generate multiple models.
» python $tr_dir/run_trRosetta.py -npz seq.npz -fasta seq.fasta
Three more options can be customized by the users, including ‘-n’ for the number of output models (default: 1), ‘-cpu’ for the number of CPU cores to be used in parallel (default: 2) and ‘-orient’ for using orientation restraints or not (default: True). The predicted structure models will be named as model1.pdb, model2.pdb, etc., depending on the value specified for the option ‘-n’.
Result analysis
Timing 5 min
-
6
Convert the predicted distance distribution into real-valued distance and visualize the predicted contact and distance maps.
» python $tr_dir/npz_2_dist.py seq.npz seq
Here, ‘seq’ is the prefix of the output files. When the native structure of the query is available, the script ‘pdb2npz.py’ can be used to calculate and visualize the inter-residue distance and orientations from the input of a PDB structure file. Users can compare the predicted and the native inter-residue geometries to check the difference manually.
» python $tr_dir/pdb2npz.py -f native.pdb
-
7
Check the confidence of the top-predicted model. After running the scripts in Step 5, the estimated TM-score for the top-predicted model is available in the file ‘cscore.txt’.
Timing
Procedure 1
-
Steps 1–7, sequence submission: 2 min
-
Steps 8 and 9, job monitoring: depends on protein size (it takes ~1 h for a protein with ~300 amino acids)
-
Steps 10–14, analyzing results: 5 min
Procedure 2
-
Steps 1 and 2, MSA generation: ~7 min for a protein with ~300 amino acids
-
Step 3, template detection: ~2 min for a protein with ~300 amino acids
-
Step 4, inter-residue geometry prediction: ~8 min (de novo) and ~13 min (with templates) for a protein with ~300 amino acids
-
Step 5, structure prediction: ~25 min for a protein with ~300 amino acids
-
Steps 6 and 7, result analysis: 5 min
Anticipated results
Procedure 1
The trRosetta server provides prediction results in two forms: a tarball file for download and a web page displaying the modeling results. The tarball file includes five structure models and other major results listed on the result page. The result page consists of the following sections as illustrated in Fig. 6:
-
1
Five predicted structure models. The first model is visualized, and its estimated TM-score is provided.
-
2
Predicted 2D information, including the inter-residue distance and orientations.
-
3
Predicted 1D information, including the secondary structure and disordered residues.
-
4
Templates used by trRosetta (when applicable), including the PDB ID, confidence, coverage, sequence identity, query-template alignment and the corresponding MODELLER model.
Procedure 2
The trRosetta standalone version mainly provides the following 2D and 3D prediction results:
-
1
Predicted inter-residue geometries in NPZ format.
-
2
Predicted structure models in PDB format.
A few related results, such as visualization of the predicted distance and contact maps, and the confidence estimation for the predicted model are also available.
Data availability
The example input and output files can be downloaded from https://yanglab.nankai.edu.cn/trRosetta.
Code availability
The trRosetta server and the standalone package are freely available at https://yanglab.nankai.edu.cn/trRosetta.
References
Moult, J., Fidelis, K., Kryshtafovych, A., Schwede, T. & Tramontano, A. Critical assessment of methods of protein structure prediction (CASP)-Round XII. Proteins 86, 7–15 (2018).
Kryshtafovych, A., Schwede, T., Topf, M., Fidelis, K. & Moult, J. Critical assessment of methods of protein structure prediction (CASP)-Round XIII. Proteins 87, 1011–1020 (2019).
Wang, S., Sun, S., Li, Z., Zhang, R. & Xu, J. Accurate de novo prediction of protein contact map by ultra-deep learning model. PLoS Comput. Biol. 13, e1005324 (2017).
Schaarschmidt, J., Monastyrskyy, B., Kryshtafovych, A. & Bonvin, A. Assessment of contact predictions in CASP12: co-evolution and deep learning coming of age. Proteins 86, 51–66 (2018).
Xu, J. Distance-based protein folding powered by deep learning. Proc. Natl Acad. Sci. USA 116, 16856 (2019).
Yang, J. et al. Improved protein structure prediction using predicted interresidue orientations. Proc. Natl Acad. Sci. USA 117, 1496–1503 (2020).
Senior, A. W. et al. Improved protein structure prediction using potentials from deep learning. Nature 577, 706–710 (2020).
Zhang, Y. & Skolnick, J. Scoring function for automated assessment of protein structure template quality. Proteins 57, 702–710 (2004).
Zemla, A. LGA: a method for finding 3D similarities in protein structures. Nucleic Acids Res. 31, 3370–3374 (2003).
Callaway, E. ‘It will change everything’: DeepMind’s AI makes gigantic leap in solving protein structures. Nature 588, 203–204 (2020).
Jumper, J. et al. Highly accurate protein structure prediction with AlphaFold. Nature 596, 583–589 (2021).
Baek, M. et al. Accurate prediction of protein structures and interactions using a three-track neural network. Science 373, 871–876 (2021).
Remmert, M., Biegert, A., Hauser, A. & Söding, J. HHblits: lightning-fast iterative protein sequence searching by HMM-HMM alignment. Nat. Methods 9, 173–175 (2012).
Söding, J. Protein homology detection by HMM–HMM comparison. Bioinformatics 21, 951–960 (2004).
Rohl, C. A., Strauss, C. E., Misura, K. M. & Baker, D. Protein structure prediction using Rosetta. Methods Enzymol. 383, 66–93 (2004).
Mistry, J. et al. Pfam: the protein families database in 2021. Nucleic Acids Res. 49, D412–D419 (2021).
Gao, S. H. et al. Res2Net: a new multi-scale backbone architecture. IEEE Trans. Pattern Anal. Mach. Intell. 43, 652–662 (2021).
Berman, H. M. et al. The Protein Data Bank. Nucleic Acids Res. 28, 235–242 (2000).
Pleiner, T. et al. Structural basis for membrane insertion by the human ER membrane protein complex. Science 369, 433–436 (2020).
O’Donnell, J. P. et al. The architecture of EMC reveals a path for membrane protein insertion. Elife 9, e57887 (2020).
Mashtalir, N. et al. A structural model of the endogenous human BAF complex informs disease mechanisms. Cell 183, 802–817.e24 (2020).
Banerjee, A. K. et al. SARS-CoV-2 disrupts splicing, translation, and protein trafficking to suppress host defenses. Cell 183, 1325–1339.e21 (2020).
Gordon, D. E. et al. Comparative host-coronavirus protein interaction networks reveal pan-viral disease mechanisms. Science 370, eabe9403 (2020).
Anishchenko, I., Chidyausiku, T. M., Ovchinnikov, S., Pellock, S. J. & Baker, D. De novo protein design by deep network hallucination. Preprint at https://doi.org/10.1101/2020.07.22.211482 (2020).
Xu, J. & Zhang, Y. How significant is a protein structure similarity with TM-score = 0.5? Bioinformatics 26, 889–895 (2010).
Eddy, S. R. Profile hidden Markov models. Bioinformatics 14, 755–763 (1998).
Ovchinnikov, S. et al. Protein structure determination using metagenome sequence data. Science 355, 294–298 (2017).
Wu, Q. et al. Protein contact prediction using metagenome sequence data and residual neural networks. Bioinformatics 36, 41–48 (2020).
Dong, R., Pan, S., Peng, Z., Zhang, Y. & Yang, J. mTM-align: a server for fast protein structure database search and multiple protein structure alignment. Nucleic Acids Res. 46, W380–W386 (2018).
Rego, N. & Koes, D. 3Dmol.js: molecular visualization with WebGL. Bioinformatics 31, 1322–1324 (2014).
Yang, J. et al. The I-TASSER Suite: protein structure and function prediction. Nat. Methods 12, 7–8 (2015).
Ward, J. J., McGuffin, L. J., Bryson, K., Buxton, B. F. & Jones, D. T. The DISOPRED server for the prediction of protein disorder. Bioinformatics 20, 2138–2139 (2004).
Webb, B. & Sali, A. Protein structure modeling with MODELLER. in Protein Structure Prediction (ed. Kihara, D.) 1–15 (Springer, 2014).
Ju, F. et al. CopulaNet: learning residue co-evolution directly from multiple sequence alignment for protein structure prediction. Nat. Commun. 12, 2535 (2021).
Wang, Z., Eickholt, J. & Cheng, J. MULTICOM: a multi-level combination approach to protein structure prediction and its assessments in CASP8. Bioinformatics 26, 882–888 (2010).
Kim, D. E., Chivian, D. & Baker, D. Protein structure prediction and analysis using the Robetta server. Nucleic Acids Res. 32, W526–W531 (2004).
Mao, W., Ding, W., Xing, Y. & Gong, H. AmoebaContact and GDFold as a pipeline for rapid de novo protein structure prediction. Nat. Mach. Intell. 2, 25–33 (2020).
Zheng, L. et al. Combining deep learning enhanced hybrid potential energy for template-based modelling. CASP14 Abstracts https://predictioncenter.org/casp14/doc/CASP14_Abstracts.pdf (2020).
Greener, J. G., Kandathil, S. M. & Jones, D. T. Deep learning extends de novo protein modelling coverage of genomes using iteratively predicted structural constraints. Nat. Commun. 10, 3977 (2019).
Xu, D. & Zhang, Y. Ab initio protein structure assembly using continuous structure fragments and optimized knowledge-based force field. Proteins 80, 1715–1735 (2012).
Jin, S. et al. AWSEM-Suite: a protein structure prediction server based on template-guided, coevolutionary-enhanced optimized folding landscapes. Nucleic Acids Res. 48(W1), W25–W30 (2020).
Ko, J., Park, H., Heo, L. & Seok, C. GalaxyWEB server for protein structure prediction and refinement. Nucleic Acids Res. 40, W294–W297 (2012).
Källberg, M. et al. Template-based protein structure modeling using the RaptorX web server. Nat. Protoc. 7, 1511–1522 (2012).
Yang, Y., Faraggi, E., Zhao, H. & Zhou, Y. Improving protein fold recognition and template-based modeling by employing probabilistic-based matching between predicted one-dimensional structural properties of query and corresponding native properties of templates. Bioinformatics 27, 2076–2082 (2011).
Kelley, L. A. & Sternberg, M. J. E. Protein structure prediction on the Web: a case study using the Phyre server. Nat. Protoc. 4, 363–371 (2009).
Zhang, Y. I-TASSER server for protein 3D structure prediction. BMC Bioinformatics 9, 40 (2008).
Wu, S. & Zhang, Y. LOMETS: a local meta-threading-server for protein structure prediction. Nucleic Acids Res. 35, 3375–3382 (2007).
Söding, J., Biegert, A. & Lupas, A. N. The HHpred interactive server for protein homology detection and structure prediction. Nucleic Acids Res. 33, W244–W248 (2005).
Guex, N. & Peitsch, M. C. SWISS-MODEL and the Swiss-PdbViewer: an environment for comparative protein modeling. Electrophoresis 18, 2714–2723 (1997).
Yan, Y., Tao, H., He, J. & Huang, S.-Y. The HDOCK server for integrated protein–protein docking. Nat. Protoc. 15, 1829–1852 (2020).
Acknowledgements
This work was supported by the National Natural Science Foundation of China (NSFC 11871290 and 61873185), Fok Ying-Tong Education Foundation (161003) and KLMDASR.
Author information
Authors and Affiliations
Contributions
J.Y. conceived and supervised the project. Z.D., H.S., W.W., L.Y., H.W., Z.P. and J.Y. designed and performed the experiments. Z.D., J.Y., I.A. and D.B. wrote the manuscript. All authors revised the manuscript.
Corresponding author
Ethics declarations
Competing interests
The authors declare no competing interests.
Additional information
Peer review information Nature Protocols thanks Julia Leman and the other, anonymous, reviewer(s) for their contribution to the peer review of this work.
Publisher’s note Springer Nature remains neutral with regard to jurisdictional claims in published maps and institutional affiliations.
Related links
Key reference using this protocol
Yang, J. et al. Proc. Natl Acad. Sci. USA 117, 1496–1503 (2020): https://www.pnas.org/content/117/3/1496
Supplementary information
Supplementary Information
Supplementary Tables 1–4 and Supplementary Figs. 1 and 2.
Rights and permissions
About this article

Cite this article
Du, Z., Su, H., Wang, W. et al. The trRosetta server for fast and accurate protein structure prediction. Nat Protoc 16, 5634–5651 (2021). https://doi.org/10.1038/s41596-021-00628-9
Received:
Accepted:
Published:
Issue Date:
DOI: https://doi.org/10.1038/s41596-021-00628-9
This article is cited by
-
Computational analysis of affinity dynamics between the variants of SARS-CoV-2 spike protein (RBD) and human ACE-2 receptor
Virology Journal (2024)
-
An immunoinformatics and structural vaccinology approach to design a novel and potent multi-epitope base vaccine targeting Zika virus
BMC Chemistry (2024)
-
Salmonella manipulates macrophage migration via SteC-mediated myosin light chain activation to penetrate the gut-vascular barrier
The EMBO Journal (2024)
-
Development and use of machine learning algorithms in vaccine target selection
npj Vaccines (2024)
-
Tertiary structure and conformational dynamics of the anti-amyloidogenic chaperone DNAJB6b at atomistic resolution
Nature Communications (2024)
Comments
By submitting a comment you agree to abide by our Terms and Community Guidelines. If you find something abusive or that does not comply with our terms or guidelines please flag it as inappropriate.
