
Abstract
Human epithelial organoids—3D spheroids derived from adult tissue stem cells—enable investigation of epithelial physiology and disease and host interactions with microorganisms, viruses and bioactive molecules. One challenge in using organoids is the difficulty in accessing the apical, or luminal, surface of the epithelium, which is enclosed within the organoid interior. This protocol describes a method we previously developed to control human and mouse organoid polarity in suspension culture such that the apical surface faces outward to the medium (apical-out organoids). Our protocol establishes apical-out polarity rapidly (24–48 h), preserves epithelial integrity, maintains secretory and absorptive functions and allows regulation of differentiation. Here, we provide a detailed description of the organoid polarity reversal method, compatible characterization assays and an example of an application of the technology—specifically the impact of host–microbe interactions on epithelial function. Control of organoid polarity expands the possibilities of organoid use in gastrointestinal and respiratory health and disease research.
Introduction
3D epithelial organoids derived from adult human tissue stem cells have become an important model to study normal and pathological states of the mucosa. They preserve a number of critical functions of the epithelium, including barrier integrity, polarized secretion or absorption, innate immune responses and the presence of multi-lineage differentiation1,2. Epithelial organoids also allow growth, serial passage and cryopreservation and thus represent a robust tool to propagate multiple primary human tissues3,4. The technology is particularly applicable to experimental problems that probe multiple cell types and functions of the epithelium and situations where species specificity limits the use of animal models. For example, human gastrointestinal (GI) organoids (also called ‘enteroids’ for small intestinal organoids, ‘colonoids’ for colon organoids and ‘gastroids’ for gastric organoids) can serve as important platforms to investigate epithelial physiology5,6,7,8, sites of invasion and cell tropism for viral9,10 and bacterial pathogens11,12 and epithelial responses during host–pathogen interactions12,13,14, as well as to conduct drug screening and toxicity assays15,16,17,18.
In the technique first described by Sato et al.19,20 to generate intestinal epithelial organoids, crypts from mouse19 and human20 intestinal tissue are isolated by EDTA treatment combined with mechanical disruption and embedded within a 3D extracellular matrix (ECM) protein scaffold (e.g., Cultrex Basement Membrane Extract (BME) or BD Matrigel). They are then cultured with appropriate growth factors that selectively expand and sustain Lgr5+ stem cells and their progeny to yield enteroids. Enteroids differentiate into the various intestinal epithelial cell types, form normal apical junctional complexes and have epithelial polarity, with the apical, or luminal, surface enclosed within the spheroid (apical-in) and the basolateral surface facing the outside of the spheroids interacting with the ECM (basolateral-out).
Many applications require access to the apical or luminal surface of the spheroid, because this is the mucosal surface that normally interfaces with the external environment and thus absorbs nutrients, interacts with GI microbes and uptakes drugs or toxins. The apical surface also secretes mucins, antimicrobial peptides and enzymes that regulate interactions between gut luminal contents and the epithelium.
We therefore developed a method of suspension culture that reverses human and mouse enteroid polarity such that the apical surface faces outward (apical-out)21. We have successfully applied this method for GI epithelial organoids from all segments of the small intestine, gastroids derived from the stomach antrum and colonoids derived from the colon and proved their utility for studying infectious diseases and host–pathogen interactions21. In this protocol, we describe further details and troubleshooting workflows to facilitate generation of apical-out GI organoids starting from ECM-embedded organoid cultures.
After organoid modeling of the intestinal epithelium became feasible, epithelial organoids from other tissues have been successfully cultured and maintained22. The emergence of the coronavirus disease 2019 pandemic thus prompted us to adapt our method to generate apical-out organoids to address the pressing need to model severe acute respiratory syndrome coronavirus 2 (SARS-CoV-2) infection and therapy of the distal human lung. In a previous study23, we modified our protocol to produce apical-out lung organoids, studied their susceptibility to SARS-CoV-2 and identified club secretory cells as a novel SARS-CoV-2 target cell population. Other groups have reported successful generation of apical-out organoids derived from human liver24 and porcine intestine25. This demonstrates the wider applicability of this protocol beyond the applications that we describe here for GI organoids.
Comparisons with other methods and limitations of the protocol
To access the apical surface of the epithelium, most laboratories first grow basolateral-out organoids embedded in ECM scaffold and then breach the organoid barrier through one of several methods: (i) microinjection to deliver experimental agents into the center of the spheroid14,26,27, (ii) shearing and mechanical disruption of spheroids to expose the apical surface28,29,30,31 or (iii) dissociation of 3D organoids and re-seeding cells onto cell culture inserts to generate 2D monolayers32,33. Our method causes organoids to reverse their polarity such that the apical surface faces the organoid exterior. To form apical-out organoids, we first grow basolateral-out organoids in BME, then release intact organoids from the ECM scaffold and transfer them to suspension culture. We previously showed in GI epithelial organoids, specifically enteroids, that removal of the ECM interferes with the ECM–β1-integrin signaling required to maintain basolateral-out polarity, thereby inducing a morphogenetic eversion of the GI organoid epithelium as a whole unit21.
Each method of accessing the apical organoid surface has its advantages and limitations and should be selected according to research needs. For instance, microinjection into the center of the organoids preserves its 3D structure within the ECM and thus does not cause major changes in the polarity or differentiation of mature organoids26. Recent technological developments have enabled high-throughput organoid microinjection by using custom robotics34; however, building and using these tools requires advanced engineering knowledge, specialized equipment and trained personnel, and is time intensive. One challenge associated with organoid microinjection is delivering controlled amounts of an experimental agent to organoid cells, because of difficulties in precisely injecting small volumes, differences in organoid size and the presence of luminal contents (such as secretions, extruded cells and debris) that may cause uneven distribution of injected material. In addition, organoids must be microinjected sequentially, and thus experimental exposures are not synchronized. The microinjection needle itself may confound findings, because the puncture in the organoid wall allows leakage of the injected agents and luminal contents into the basolateral space, and the mechanical trauma may induce wound-healing responses. Even in ideal situations, only a fraction of the organoids can be successfully used for microinjection experiments because of size variability and accessibility (depth in the ECM). Overall, interpretation of measurements from organoid microinjection experiments must account for multiple confounding variables such as heterogeneous exposure concentrations and durations, as well as impacts of disrupting the organoid wall.
To technically simplify and improve the efficiency of the delivery of experimental agents into the lumen of basolateral-out organoids, some laboratories shear the organoids through mechanical disruption by pipetting, incubating with the desired experimental material and then re-embedding the organoids in ECM, allowing them to heal and regrow after exposure to the experimental agent28,29,30,31. Although technically easier and more synchronized than microinjection, the disadvantage of this method is the larger amount of mechanical injury at the time of inoculation and the exposure of both apical and basolateral surfaces to the experimental agent.
Our method of generating apical-out organoids in suspension culture has several advantages over these two methods. First, our method allows for synchronized change of polarity and maintenance of intact barrier function. Second, because there is no ECM hydrogel scaffold to affect diffusion, suspended apical-out organoids can be synchronously exposed to homogeneous concentrations of experimental agents regardless of organoid size. Furthermore, apical-out organoids release secretions such as mucus and extrude cells outward into the culture medium, which both can be either left as part of an intact mucosal barrier or removed for more rapid access to the epithelial surface. Another advantage of suspended organoid culture is simple division into multiple wells after a synchronous exposure for further testing of different experimental conditions. In addition, the same well can be sampled at multiple time points for time-course experiments. Multiple wells of apical-out organoids in suspension culture can be easily combined to scale up an experiment or to reduce culture growth time and reagent amounts. A shortcoming of organoid suspension culture is that media changes are more time consuming, because organoids must be removed from their wells, pelleted by centrifugation and then resuspended in fresh media before being transferred back into their wells. A second drawback is that, compared to basolateral-out organoids, apical-out organoids exhibit slower proliferation and accelerated differentiation21, probably because of the impaired access of internally sequestered basolateral receptors to growth factors in the surrounding media. Thus, apical-out organoids are not useful as maintenance cultures for passaging.
A third method used to access the apical organoid surface is production of a polarized monolayer by seeding dissociated organoid cells onto permeable supports of cell culture inserts32. One of the most important attributes of the organoid-derived monolayer model is that it enables more control over experimental parameters. Both the apical and basolateral surfaces of an organoid-derived monolayer can be independently accessed, and molecules that transcytose or diffuse from either side can be sampled. This contrasts with ECM-embedded basolateral-out and suspended apical-out organoids, which have only either the basolateral or apical surface readily accessible. To improve our method, we describe a modification that enables investigation of both apical and basolateral surfaces within a single culture. By including a low percentage of ECM in the medium of a suspension culture, both apical-out and basolateral-out organoids are generated and can be synchronously exposed to the same experimental agent. Note that this does not replace the utility of the 2D monolayer in accessing both apical and basolateral surfaces of an epithelial monolayer or sampling transcytosed molecules. Below, we show examples of some assays that can be used to visualize loss of barrier function or the apical uptake of molecules in apical-out enteroids, which can complement but not replace the more established methods used with 2D monolayers.
One disadvantage of 2D monolayers is that cultures take several days or even weeks to mature. Around 2–5 d are required to reach full confluency35,36; however, this can take up to 2 weeks depending on seeding density37,38. Moreover, differentiation of the monolayer can require up to 5 d to 1 week of additional culture with the differentiation medium35,37. In contrast, most apical-out organoids develop proper polarity in <2 d. Finally, apical-out organoids can be easily imaged by high-resolution live-cell (example in Supplementary Video 1) and confocal (examples in Figs. 1 and 2) microscopy, whereas monolayers on cell culture inserts pose limitations to imaging. In 2D monolayers, the cell culture inserts are often optically opaque, making real-time observation of the monolayers challenging. Even when using optically clear cell culture inserts, monitoring the maturity and polarity of the monolayers is challenging because of difficulty in visual inspection, especially across the apicobasal cell axis. Apical-out organoids in suspension, in contrast, can be monitored directly on tissue culture inverted microscopes and examined before and during experiments. For high-resolution imaging, suspended organoids can be placed in optical viewing chambers (Step 14B and C).

a, Schematic of the protocol to generate apical-out organoids in suspension. b, Example of organoid with basolateral-out polarity embedded in BME (top panels) or apical-out polarity in suspension (bottom panels) depicted by a graphic illustration (left), modulation contrast microscopy (middle) or 3D confocal microscopy reconstructions (right). Enteroids embedded in BME have basolateral-out polarity with an internal lumen and apical microvilli (mv) facing inward, whereas enteroids in suspension evert so that apical microvilli face outward. Samples are counterstained with DAPI (Thermo Fisher Scientific, cat. no. D3571; RRID: AB_2307445) and Alexa Fluor 660 phalloidin (F-actin; ThermoFisher, cat. no. A22285), both diluted 1:500 for visualization of the nuclei and actin cytoskeleton, respectively. Scale bars, 10 µm. b, Confocal images from ref. 21.

a, b, d and e, 3D-confocal immunofluorescence imaging of colonoids (a and b) and gastroids (d and e) embedded in BME (a and d) or in suspension (b and e) to show cell polarity by the localization of the microvilli (mv; F-actin, white, Alexa Fluor 660 phalloidin; ThermoFisher, cat. no. A22285), apical junction protein ZO-1 (ZO-1; green, antibody; Thermo Fisher Scientific, cat. no. 33-9100; RRID: AB_2533147) and basolateral protein β-catenin (β-catenin; red, antibody; Santa Cruz Biotechnology, cat. no. sc-7199; RRID: AB_634603). c, Differentiated human colonoids in suspension culture generate goblet cells (MUC2; green, antibody; SCBT, cat. no. sc-15334; RRID: AB_2146667). f, Differentiated human gastroids in suspension culture generate surface mucus cells (MUC5AC; green, antibody; Leica Biosystems, cat. no. NCL-MUC-5AC; RRID: AB_442113). g, Differentiated human enteroids in suspension culture generate various intestinal epithelial cell types. Markers for Paneth cells (lysozyme; green, antibody; Dako, cat. no. A0099; RRID: AB_2341230), goblet cells (MUC2; green, antibody; SCBT, cat. no. sc-15334; RRID: AB_2146667), enteroendocrine cells (chromogranin A (CHGA); green, antibody; Immunostar, cat. no. 20085; RRID: AB_572227) and enterocytes (villin; green, antibody; SCBT, cat. no. sc-58897; RRID: AB_2304475) are shown after suspension culture for 5 d. Samples are counterstained with DAPI (Thermo Fisher Scientific, cat. no. D3571; RRID: AB_2307445) and Alexa Fluor 660 phalloidin (F-actin; ThermoFisher, cat. no. A22285), both diluted 1:500 for visualization of the nuclei and actin cytoskeleton, respectively. All antibodies were diluted 1:100, except antibodies against MUC2 and villin, which were diluted 1:200. Scale bars, 10 µm. Figure adapted from ref. 21.
Overview of procedure for polarity reversal
The procedure to establish apical-out GI epithelial organoids begins with BME-embedded basolateral-out gastroids, small intestinal enteroids or colonoids derived from human20 or mouse19 GI epithelial crypts. To reverse GI organoid polarity, intact spheroids are first released from the BME by incubation in ice-cold EDTA, which chelates cations, resulting in depolymerization of the matrix proteins. BME-free organoids are then washed free of EDTA, resuspended in culture media and placed in ultra-low-attachment plates to prevent organoid attachment (Fig. 1a). Disrupting ECM interactions with basolateral β-1 integrin receptors triggers a coordinated movement of the epithelium like a morphogenetic rearrangement, resulting in eversion of the GI organoid polarity without alterations to individual cells21. As early as 1 d after being placed in suspension culture, GI organoids evert to exhibit apical-out polarity (Fig. 1b). An example of a gastroid undergoing eversion into apical-out polarity in the first 12 h of suspension culture is shown in Supplementary Video 1. We have previously shown that apical-out enteroids maintain normal polarized distribution of molecular markers, have functional tight junctions and exhibit similar transcriptional expression of differentiation markers when compared with basolateral-out enteroids embedded in BME21. Immunostaining of apical junction complex protein ZO-1 and basolateral membrane–associated protein β-catenin demonstrates that colonoids and gastroids in suspension have reversed polarity such that the apical surface faces outward (Fig. 2). Suspended apical-out GI organoids can be differentiated to contain different types of secretory and absorptive cells (Fig. 2c,f,g).
Applications
The apical-out organoid model recapitulates properties and functions of the human epithelium and, with the advantage of improved access to the apical surface, will advance our understanding of physiology, disease pathogenesis and host–microbe interactions. Furthermore, the model may be useful for evaluating therapeutics because apical-out organoids exhibit multi-lineage differentiation, preserve barrier function and absorptive and secretory properties and can be derived from specific patients for personalized medicine approaches. We have previously demonstrated that the polarity-reversal protocol is effective for human enteroids, human gastroids, human colonoids and murine enteroids21, and can be adapted to epithelial organoids derived from different tissues, such as lung23. The apical-out organoid model is compatible with many types of downstream analyses, including imaging, flow cytometry and other common molecular biology techniques21. We recommend that each user establishes the timing and efficiency of polarity reversal in their organoid lines. For applications requiring the sampling or recovery of compounds transcytosing or diffusing across a monolayer, it is preferable to use the 2D monolayer system in which both apical and basolateral compartments are accessible.
In the procedure, we describe how to generate suspension cultures of apical-out GI organoids and downstream assays with which to characterize them (Step 14). We show that basolateral-out organoids can be maintained in suspension culture by adding soluble BME into the culture medium of GI organoids (option A). We explain how organoids can be immobilized for evaluation using high-resolution live imaging (option B) or how organoids can be fixed and stained for visualization of specific markers by confocal microscopy (option C). We also show an example of how the model can be applied to study infectious diseases, specifically by using apical-out organoids to examine infection by Salmonella enterica serovar Typhimurium (S. Typhimurum; option D). We also describe how to evaluate epithelial functions such as barrier integrity and nutrient absorption (options E and F).
Maintaining basolateral-out organoids in suspension
Certain experimental situations may benefit from applying a given perturbation and comparing effects upon organoid exposure via the apical versus basolateral surfaces. We have shown that organoid culture in low concentrations of BME in liquid suspension prevents reversal of polarity (Fig. 3a,b)21,39. Here, we extended these findings by demonstrating that basolateral-out organoids can be maintained in suspension culture for longer periods by adding soluble BME into the culture medium of GI organoids (Fig. 3c and Step 14A). This enables experiments using basolateral-out organoids with the advantages of suspension culture, including compatibility with certain imaging modalities, and increased flexibility in experimental handling.

Organoids were analyzed by confocal microscopy and quantified for percentage of basolateral-out, apical-out or mixed-polarity enteroids. a, Time course of enteroid polarity reversal after being transferred to suspension culture. Data from 900 organoids in three different experiments. b, Dose-dependent inhibition of enteroid polarity reversal by soluble BME after 3 d in suspension culture. Data from 303 organoids in three different experiments. c, Basolateral-out polarity is stable over time for colonoids in suspension culture in medium containing 20% (vol/vol) BME. Data from 479 organoids in three different experiments. Bar graphs show the mean ± s.d. of three independent experiments. a and b adapted from ref. 21.
Live organoid imaging
Kinetic examination of dynamic cellular and subcellular events at high resolution is crucial to understanding epithelial cell biology and epithelium–microbe interactions. High-resolution and high-magnification imaging of ECM-embedded organoids can be difficult, because organoids are not embedded in a single plane, and focal range may not reach all the organoids in the scaffold. In the absence of a 3D scaffold, suspended apical-out organoids can be readily mounted in optically clear microscopy viewing chambers for high-resolution visualization and time-lapse studies. Monitoring individual organoids over time requires their immobilization. We previously described immobilization of enteroids by adhesion atop a thin layer of BME21. However, attachment to BME inhibits apical-out polarization of the portion of the organoid that remains in contact with the matrix proteins. Here, we describe an improved protocol, in which live apical-out organoids are immobilized between glass coverslips without adhesive agents. We provide an example showing how live microscopy can elucidate behavior of an individual organoid (Supplementary Video 1).
Modeling infectious diseases
Epithelial surfaces are the first line of defense against infection, as well as an important site of co-evolution and communication between our body and the microbial world. Polarized epithelial cells form a tight but dynamic barrier and have apical surfaces that prevent microbial attachment, secrete antimicrobial compounds and can rapidly respond to unwanted microbial contact and subsequent damage. To understand how viruses and bacteria infect or breach the epithelium, it is necessary to develop primary human epithelial tissue models that allow easy access to the apical epithelial surface.
Apical-out organoids allow infectious agents to be added into the culture medium to easily access the intact apical surface and reach sites of infection. For instance, we explored the preferred site of infection of S. Typhimurium and Listeria monocytogenes by using both suspended apical-out and suspended basolateral-out enteroids and identified polarity-dependent preferences. L. monocytogenes shows preferential infection at the basolateral surface and, in apical-out enteroids, invades through sites of cell extrusion where epithelial polarity is disrupted to expose E-cadherin as a receptor for entry21,40. Conversely, S. Typhimurium shows preferential entry through the apical enteroid surface by inducing cytoskeletal rearrangements, or ‘ruffles’, that promote bacterial uptake41 (Fig. 4). Recently, we used apical-out colonoids to demonstrate association of enteroaggregative Escherichia coli with colonic mucins42, and we are currently using apical-out GI organoids to explore multiple types of interactions with other pathogens: human gastroids for the study of the stomach bacterium Helicobacter pylori and its injection of the virulence factor CagA, colonoids for the study of Yersinia enterocolitica invasion, ileal enteroids for S. enterica serovar Typhi invasion and jejunal and ileal enteroids for rotavirus infection.

a, 3D confocal reconstructions of a basolateral-out enteroid (left) and apical-out enteroid (right) infected with S. Typhimurium-mCherry (red) for 1 h. b, Number of intracellular bacteria per enteroid after 1 h of infection with S. Typhimurium-mCherry. Data represented are mean ± s.d.; n = 60 enteroids in three independent experiments; ****P < 0.0001 (Mann-Whitney U test). c, S. Typhimurium-mCherry (red) at different stages of invasion of apical-out enteroids. Nuclei are stained with DAPI (blue; Thermo Fisher Scientific, cat. no. D3571; RRID: AB_2307445), and the actin cytoskeleton is stained with Alexa Fluor 660 phalloidin (F-actin, white; ThermoFisher, cat. no. A22285), both diluted 1:500. Scale bars, 10 µm. Figure adapted from ref. 21.
The ongoing SARS-CoV-2 pandemic has raised a crucial need for novel models of viral pathogenesis and therapeutic agents. We recently exploited apical-out human distal lung organoids to visualize and characterize sites of SARS-CoV-2 infection in alveolar and bronchiolar organoids including novel club cell targeting23. Our apical-out GI organoid protocol has also been used to study SARS-CoV-2 infection of the GI epithelium10,43.
Epithelial functional assays
Barrier integrity
A key function of the epithelium is to provide a barrier that separates the external environment from the underlying tissue, thus preventing harmful contents of the luminal space from entering the body, or loss of tissue fluids to the outside environment. Disruption of epithelial barrier function is associated with many pathological states including infectious and inflammatory diseases44,45,46. A common way to evaluate epithelial barrier function both in vitro and in vivo is by tracking the ability of FITC-labeled dextran to cross epithelial surfaces21,40. To evaluate and quantify epithelial barrier function of apical-out enteroids in suspension, we report a more detailed protocol (Fig. 5) of the FITC-dextran diffusion assay we previously described21. Briefly, suspended apical-out enteroids are incubated in a solution containing FITC-dextran and then examined by differential interference contrast (DIC) and confocal fluorescence microscopy. Enteroids that have intact epithelial barrier function exclude FITC-dextran, whereas enteroids with disrupted epithelial barrier function allow FITC-dextran to diffuse into the intercellular spaces and center of enteroids. We have used this assay to document that S. Typhimurium infection of apical-out intestinal enteroids causes barrier disruption21 (Fig. 5b,c).

a, Schematic of the protocol for the apical-out enteroid dextran diffusion assay. During or after experimental treatments, suspended enteroids are incubated in medium containing 4-kDa FITC-dextran, mounted on to a slide and immediately imaged live by using confocal microscopy. b, S. Typhimurium infection disrupts epithelial barrier integrity in apical-out differentiated enteroids. The dextran diffusion assay was used to evaluate uninfected (control, top) apical-out enteroids or apical-out enteroids infected with S. Typhimurium-mCherry (red) for 1 h (bottom). Enteroids were imaged by using differential interference contrast (DIC) (left) and confocal fluorescence (right) microscopy. Scale bars, 50 µm. c, Quantification of uninfected (Control) or S. Typhimurium–infected (Infected) enteroids that exclude FITC-dextran and thus have intact barrier integrity. Data represented are mean ± s.d.; n = 5 experiments with enteroids from two different donors. For each experiment, 22–48 enteroids were analyzed for a total of 369 enteroids; **P < 0.01 (Mann-Whitney U test). b and c adapted from ref. 21.
Polarized nutrient absorption: fatty acid uptake
The intestinal epithelium is responsible for absorbing nutrients from the gut lumen. Enterocytes use specialized receptors and transporters to mediate uptake of specific molecules at the apical surface. Nutrient uptake has been characterized using animal models and immortalized cell lines. For example, both in vitro and in vivo studies have examined fatty acid epithelial uptake by using fluorescent fatty acid analogs, which can be traced using fluorescence microscopy or fluorescence readers47,48. Fatty acid uptake can be studied and quantified in apical-out enteroids by monitoring fluorescent fatty acid analog uptake from the surrounding medium21. In this protocol, which is demonstrated using fluorescently labeled dodecanoic acid C1-BODIPY-C12, fatty acid uptake is detected by fluorescence microscopy (Fig. 6). Absorbed fatty acids are visualized as intracellular fluorescent foci, and subcellular localization of fatty acid trafficking can be monitored. Alternative methods to determine uptake of fluorescent fatty acid analogs include the use of fluorescence plate readers or fluorescence-activated cell scanners to measure intracellular fluorescence49.

a, Representation of the apical-out enteroid fatty acid uptake assay. Apical-out enteroids in suspension are exposed to a fluorescent fatty acid analog. After incubation, fatty acid analog uptake can be evaluated using confocal microscopy or other fluorescence detection techniques. b, An example of an apical-out enteroid imaged by confocal microscopy after incubation with fatty acid analog C1-BODIPY-C12 (green) for 30 min. As expected, fatty acid analog uptake is visible as intracellular fluorescent foci (lipid droplets) localized to the basal regions of the cell. Nuclei are stained with DAPI (blue; Thermo Fisher Scientific, cat. no. D3571; RRID: AB_2307445), and the actin cytoskeleton is stained with Alexa Fluor 660 phalloidin (F-actin, white; ThermoFisher, cat. no. A22285), both diluted 1:500. Scale bar, 20 µm.
Expertise required to implement the protocol
This protocol requires that researchers are proficient in culturing and passaging epithelial organoids in BME or Matrigel19,20,23. Some portions of this protocol require access to and expertise in confocal immunofluorescence microscopy and live-cell imaging techniques.
Materials
Biological materials
-
Enteroids, gastroids or colonoids derived from GI tissue that were grown in ECM as described in Sato et al.20 (for human) or Sato et al.19 (for murine)
Caution
Any experiments involving material derived from animals must conform to relevant institutional and national regulations. Use of human material also requires patient consent. For our studies, de-identified human tissue samples were procured by the Stanford Tissue Bank with patient consent and approval by the Stanford University Institutional Review Board. Samples were obtained from normal margins of surgical resections on a rolling basis without targeted or planned enrollment. The Stanford Tissue Bank does not discriminate by sex or ethnicity in its collection practices. Children are not included in the tissues acquired by the Stanford Tissue Bank, because this operates within Stanford Hospital, which services adult patients. Murine enteroids were derived from duodenal tissue from C57BL/6J mice that were ≥5 weeks of age (The Jackson Laboratory). All animal experiments were performed in accordance with National Institutes of Health guidelines and with approval from the Institutional Animal Care and Use Committee of Stanford University.
Reagents
Apical-out GI organoids in suspension culture
-
DMEM, high glucose, pyruvate (ThermoFisher, cat. no. 11995065)
-
PBS, pH 7.4 (ThermoFisher, cat. no. 10010-023)
-
UltraPure 0.5 M EDTA, pH 8.0 (ThermoFisher, cat. no. 15575020)
-
Advanced DMEM/F12 (ThermoFisher, cat. no. 12634028)
-
HEPES (ThermoFisher, cat. no. 15630080)
-
Glutamax (ThermoFisher, cat. no. 35050061)
-
N-Acetylcysteine (Sigma-Aldrich, cat. no. A7250)
-
B-27 (without vitamin A) (ThermoFisher, cat. no. 12587001)
-
A83-01 (Tocris, cat. no. 2939)
-
Gastrin (Sigma-Aldrich, cat. no. G9145)
-
Epidermal growth factor (Peprotech, cat. no. AF-100-15)
-
Noggin (Peprotech, cat. no. 120-10C)
-
Y27632 (Peprotech, cat. no. 1293823)
-
DAPT (N-[N-(3,5-difluorophenacetyl-l-alanyl)]-S-phenylglycine t-butyl ester, γ-secretase inhibitor IX) (Sigma-Aldrich, cat. no. 565770)
-
(Optional) penicillin-streptomycin (Gibco, cat. no. 15140148)
-
FGF-10 (Peprotech, cat. no. 100-26); only for gastroids
Sample preparation for immunofluorescence imaging
-
Paraformaldehyde (Sigma-Aldrich, cat. no. 441244)
Caution
Paraformaldehyde can be toxic upon inhalation, ingestion or contact with the skin. It should be handled using appropriate safety measures.
-
Monobasic sodium phosphate (Baker, cat. no. 3818)
-
Dibasic sodium phosphate (Fisher Scientific, cat. no. S374)
-
BSA (Fisher Scientific, cat. no. BP-1600)
-
Saponin (Sigma-Aldrich, cat. no. S7900)
-
Triton X-100 (Sigma-Aldrich, cat. no. X-100)
Caution
Triton X-100 is hazardous. Avoid contact with skin and eyes.
-
Sodium azide (Sigma-Aldrich, cat. no. 13412)
Caution
The electron transport chain inhibitor sodium azide can be acutely toxic even at low doses. Personal protective equipment should be worn at all times while handling this reagent; wear gloves and protective clothing. Sodium azide requires extra caution because it changes rapidly into a toxic gas when mixed with water or acids.
-
Anti-fade mounting medium, Vectashield (Vector Laboratories, cat. no. H-1000)
-
High-vacuum grease (Dow Corning)
Primary antibodies: differentiation markers
-
Anti-lysozyme: Paneth cell marker; antibody from Dako, cat. no. A0099; RRID: AB_2341230
-
Anti-MUC2: intestinal and colon mucin found in goblet cells; antibody from SCBT, cat. no. sc-15334; RRID: AB_2146667
-
Anti-chromogranin A: enteroendocrine cell marker; antibody from Immunostar, cat. no. 20085; RRID: AB_572227
-
Anti-villin: marker of brush border microvilli in enterocytes; antibody from SCBT, cat. no. sc-58897; RRID: AB_2304475
-
Anti-MUC5AC: mucin in gastric surface mucus cells in the antrum; antibody from Leica Biosystems, cat. no. NCL-MUC-5AC; RRID: AB_442113
Primary antibodies: cytoskeleton, nuclei and markers to assess cell polarity
-
Phalloidin: molecule that binds polymerized actin microfilaments, conjugated to Alexa Fluor fluorophore 660 (Thermo Fisher Scientific, cat. no. A22285) or other fluorophores
-
DAPI: DNA stain to visualize nuclei (Thermo Fisher Scientific, cat. no. D3571; RRID: AB_2307445)
Caution
DAPI is dangerous if touched. Always wear gloves when working with substances containing DNA-intercalating agents such as DAPI.
-
Anti-zonula occludens-1 (ZO-1): tight junction protein; antibody from Thermo Fisher Scientific, cat. no. 33-9100; RRID: AB_2533147
-
Anti-β-catenin: component of the adherens junctions; marker for basolateral localization; antibody from Santa Cruz Biotechnology, cat. no. sc-7199; RRID: AB_634603
Secondary antibodies against species-specific primary antibodies, conjugated to Alexa Fluor fluorophores (ThermoFisher)
-
Chicken anti-rabbit IgG (H+L) cross-adsorbed secondary antibody, Alexa Fluor 488, cat. no. A21441; RRID: AB_2535859
-
Chicken anti-rabbit IgG (H+L) cross-adsorbed secondary antibody, Alexa Fluor 594, cat. no. A21442; RRID: AB_2535860
-
Chicken anti-mouse IgG (H+L) cross-adsorbed secondary antibody, Alexa Fluor 594, cat. no. A21200; RRID: AB_2535786
Enteroid infection: S. Typhimurium
-
S. Typhimurium strain SL134450
Caution
S. enterica is a human pathogen. Standard biosafety level 2 practices and precautions should be in place. Consult with the appropriate institutional biosafety review board for the appropriate containment protocols, including for disposal of material after use and safety procedures.
-
Luria broth (Sigma-Aldrich, cat. no. L3522-250G)
-
Advanced DMEM/F12 (ThermoFisher, cat. no. 12634028)
Evaluating epithelial barrier integrity
-
FITC-dextran, 4 kDa (Sigma-Aldrich, cat. no. 46944)
-
UltraPure 0.5 M EDTA, pH 8.0 (ThermoFisher, cat. no. 15575020)
-
PBS, pH 7.4 (ThermoFisher, cat. no. 10010023)
Measuring fatty acid uptake
-
BODIPY 500/510 C1, C12 (C1-BODIPY-C12; ThermoFisher, cat. no. D3823)
-
BSA, fatty acid free (Sigma-Aldrich, cat. no. A8806)
-
DMEM, high glucose, no glutamine, no phenol red (ThermoFisher, cat. no. 31053028)
Reagent setup
EDTA solution
Dilute the EDTA stock solution to 5 mM in PBS. Store at 4 °C for ≤2 months.
Enteroid differentiation medium
Add the following components into advanced DMEM/F12. Store at 4 °C for ≤2 weeks.
Reagent | Stock concentration | Stock solvent | Final concentration |
|---|---|---|---|
Glutamax | 100× | n/a | 1× |
HEPES | 1 M | n/a | 1 mM |
Epidermal growth factor | 500 µg/ml | PBS | 50 ng/ml |
Noggin | 100 µg/ml | PBS | 100 ng/ml |
Gastrin | 100 µM | PBS | 10 nM |
A83-01 | 5 mM | DMSO | 500 nM |
Y27632 | 10 mM | DMSO | 10 µM |
DAPT | 5 mM | DMSO | 5 µM |
N-Acetylcysteine | 500 mM | PBS | 1 mM |
B27 | 50× | n/a | 1× |
BME
Allow BME matrix to thaw at 4 °C overnight. Distribute aliquots into microcentrifuge tubes and store at −20 °C for ≤3 months. Before use, thaw an aliquot at 4 °C for ≥4 h or until the sample is no longer frozen.
Paraformaldehyde fixative solution
Make a stock solution of 0.5 M dibasic sodium phosphate in water and store at room temperature (20 °C) for ≤3 months. Make a stock solution of 1 M monobasic sodium phosphate in water and store at room temperature for ≤3 months. Make a stock solution of 8% (wt/vol) paraformaldehyde by dissolving paraformaldehyde in water at pH 10–11 and then adjusting down to pH 7.4 and store at 4 °C for ≤1 month. For complete paraformaldehyde fixation solution, dilute the stock solutions in water to a final concentration of 2% (wt/vol) paraformaldehyde, 60 mM dibasic sodium phosphate and 14 mM monobasic sodium phosphate. Store complete paraformaldehyde fixation solution at 4 °C for ≤1 month.
Blocking/permeabilization buffer
In PBS, dissolve BSA to a final concentration of 3% (wt/vol) and saponin to a final concentration of 1% (wt/vol). As a preservative, add sodium azide to a final concentration of 0.02% (wt/vol). For some primary antibodies that require detergent treatment for proper antigen detection, add Triton X-100 to a final concentration of 1% (vol/vol). Filter-sterilize and store at 4 °C for ≤3 months.
FITC-dextran stock solution
Make a 50-mg/ml stock solution in water. Divide into aliquots and store at −20°C for ≤3 months.
C1-BODIPY-C12 stock solution
Make a 2.5 mM stock solution in DMSO. Divide into aliquots and store at −20 °C for ≤3 months.
Fatty acid–free BSA stock solution
Make a 500 µM stock solution in water. Store at 4 °C for ≤1 month.
Vacuum grease applicator
Remove the plunger of a 10-ml slip tip syringe. Load 3–5 ml of vacuum grease into the back of the syringe. Replace the plunger in the syringe and push vacuum grease to the syringe tip. Gently apply pressure to the plunger to spot vacuum grease onto a slide.
Equipment
Common
-
15-ml conical tubes (Olympus, cat. no. 28-103)
-
Ultra-low-attachment 24-well plate (Corning Costar, cat. no. 3473)
-
Rotating platform, Orbitron Rotator 1 (Boekel, model 260200)
-
Inverted microscope (Olympus, model CK2)
-
1.5-ml microcentrifuge tubes (E&K, cat. no. 280150)
-
1.5-ml microcentrifuge LoBind tubes (Eppendorf, cat. no. 925000090)
-
Microscope slides, Fisherbrand Superfrost (Fisher Scientific, cat. no.12-550-123)
-
Nunc Lab-Tek 1 well glass chamber slide (ThermoFisher, cat. no. 154453PK)
-
Coverslips, no. 1 22 × 60 mm (VWR, cat. no. 48393-070)
-
Round coverslips, 12-mm diameter (VWR, cat. no. 76305-514)
-
PAP pen, ImmEdge (Vector Laboratories, cat. no. H-4000)
Critical
The ink from PAP pens from some vendors may cause autofluorescence during imaging.
-
10-ml slip tip syringe (BD, cat. no. 301604)
Microscopy and image processing
-
LSM 700 confocal microscope (Carl Zeiss)
-
TE2000E microscope for time-lapse imaging (Nikon)
-
Dissecting microscope
-
Zen 2009 software (Carl Zeiss)
-
OpenLab 5.5.2 software (Improvision)
-
Volocity Image Analysis software (Improvision)
-
FIJI software (ImageJ)
Procedure
Apical-out GI epithelial organoids in suspension culture
Timing 1–7 d, 1.5 h hands-on
Critical
See Figs. 1 and 2 for a diagram of the procedure and examples of the morphology of different GI organoids before and after the polarity-reversal process. Supplementary Video 1 shows a time-lapse movie of an organoid reversing polarity followed by staining to show apical-out markers by confocal microscopy.
Critical
Before starting the procedure, GI epithelial organoids should be derived and grown as described previously for mouse19 or human20 tissue. Further details on how to embed organoids within BME or Matrigel and grow them in growth media are also available elsewhere51. GI organoids are best harvested for polarity reversal when they consist of simple epithelial spheroids (‘bubble-like‘ cysts) not older than 10 d in culture from the last passage (for human enteroids). Older or differentiated GI organoids with complex morphologies (i.e., convoluted lumens or evaginations (budding structures)) often cannot survive being transferred to suspension culture, and the polarity-reversal process may result in significant cell death. Dense cultures (>200 organoids per well) are ideal for the polarity-reversal protocol.
-
1
Aspirate medium from each 24-well plate containing an average of 200 organoids using a vacuum aspirator.
-
2
Use a pipette tip to dislodge matrix-embedded GI organoids from the bottom of each well.
-
3
Add 500 µl of ice-cold 5 mM EDTA/PBS to each 24-well plate. In each well, pipette up and down with a P1000 pipette a few times to break up the BME. Transfer the solution from up to four wells into a 15-ml conical tube containing 10–12 ml of ice-cold 5 mM EDTA/PBS.
Critical step
Adding too many wells of GI organoids into a single conical tube can result in incomplete BME removal (Fig. 7). Residual BME can inhibit GI organoid polarity reversal or cause spheroid aggregation. If processing more wells, use multiple 15-ml conical tubes or a 50-ml conical tube.
-
4
Incubate the conical tubes on a rotating platform at 4 °C for 1 h.
Fig. 7: Solutions to two common problems with the polarity-reversal protocol. 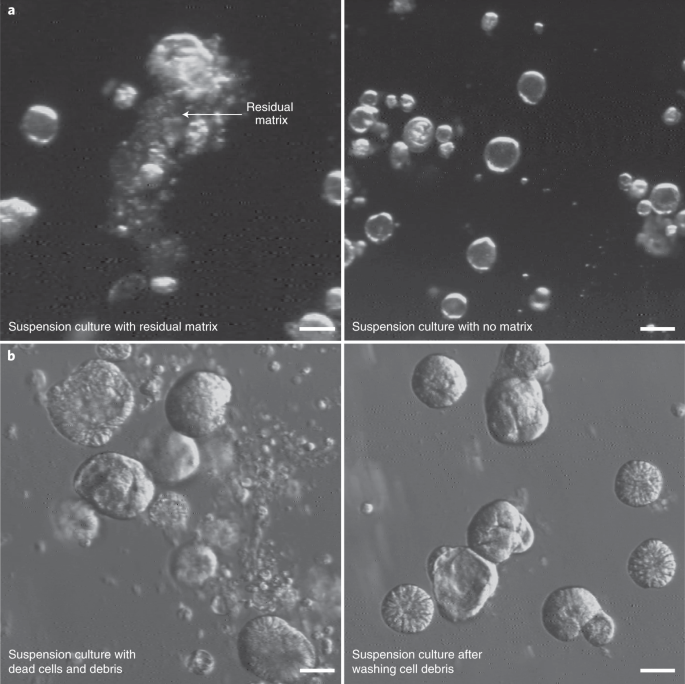
a, Residual matrix inhibits organoid polarity reversal and causes aggregation. The left panel (4× magnification, darkfield) shows a suspension culture of gastroids where the BME matrix was not fully removed by EDTA treatment. These organoids will retain basolateral-out or mixed-polarity orientation. The right panel shows a suspension culture of gastroids after complete removal of the matrix. b, Cell debris present after polarity reversal can be removed. Apical-out gastroids (4× magnification, modulation contrast) after 1 d in suspension culture may be surrounded by dead cells and cell debris (left). These can be removed by washing and exchanging the culture medium (right). Scale bars: 100 µm (a), 50 µm (b).
Critical step
Shorter incubation times may result in incomplete BME removal, and longer incubations may result in loss of GI organoid viability. In addition, GI organoids can be damaged during the removal of the BME if pipetted too harshly or incubated with high EDTA concentrations.
-
5
Pellet GI organoids in the 15-ml conical tubes by centrifuging in a swinging bucket rotor at 300g for 3 min at 4 °C.
-
6
Using a vacuum aspirator, aspirate the 5 mM EDTA/PBS. Be careful not to aspirate the pellet.
-
7
Wash the pellet by adding 5 ml of DMEM to each 15-ml conical tube.
-
8
Pellet GI organoids in the 15-ml conical tubes by centrifuging in a swinging bucket rotor at 300g for 3 min at 4 °C.
-
9
Using a vacuum aspirator, aspirate the DMEM. Be careful not to aspirate the pellet.
-
10
Resuspend GI organoids in the desired medium. For instance, enteroids can be resuspended in enteroid differentiation medium. Resuspend organoids by pipetting up and down with a P1000 pipette.
Critical step
Check the culture density on an inverted light microscope. If the GI organoid suspension culture is too dense, spheroids may aggregate and/or fuse before polarity reversal is complete. This may need to be empirically tested and adjusted for cultures with different densities. If GI organoids are aggregating, use a P1000 pipette to pipette up and down to separate organoids. Gentle force is necessary, but be cautious not to introduce bubbles or damage GI organoid integrity. As a guide, each original well can be split into three wells of a 24-well plate. If larger volumes are needed, two or three wells can be combined into a single chamber of a six-well plate.
-
11
Transfer 400 µl of the organoid suspension into each well of a 24-well ultra-low-attachment plate.
Critical step
Ultra-low-attachment plates have a coating that prevents organoid attachment to the well surface. This is necessary because organoid attachment inhibits polarity reversal.
-
12
Incubate suspension cultures for 1–7 d at 37 °C in a 5% CO2 incubator. Polarity reversal should occur after 1 d of suspension culture (Fig. 3a and Supplementary Video 1).
Critical step
GI organoid cell differentiation can typically be observed after 3–5 d (Fig. 2g); however, incubation time must be optimized by users for different types of differentiation media, organoid type and donor source. We advise all users to perform their own characterization of apical-out organoids when first establishing the technique, introducing new GI lines or working with new reagents. Techniques such as qRT-PCR and single-cell RNA sequencing (scRNA-seq) can be used to determine the expression levels of genes associated with specific states of differentiation, while immunoassays (such as immunoblots and ELISAs) and immunofluorescence microscopy can be used to determine protein expression and localization. See Anticipated results and Figs. 2 and 3 with examples of how to identify the different cell types and the efficiency of polarity reversal, respectively. Finally, it is important to note that after GI organoid polarity reversal, dead cells, mucus and cell debris will be released into the medium. Cell debris can be removed by pelleting, washing and resuspending organoids as described above (Steps 8–10). Dead cells during polarity reversal can come from multiple sources. They may be extruded from viable GI organoids, expelled from the spheroid interiors during the eversion process or released from dying GI organoids (Fig. 7b).
-
13
Change the medium every 3 d. Use a P1000 pipette to transfer GI organoids into a 1.5-ml microcentrifuge tube or 15-ml conical tube. Multiple wells can be combined if cultured under the same conditions. Pellet GI organoids in the 15-ml conical tube by centrifuging in a swinging bucket rotor at 300g for 3 min. Aspirate spent medium and resuspend apical-out organoids in the same volume of fresh medium.

Downstream assays
Timing Variable
-
14
To culture basolateral-out organoids in suspension culture, follow option A. For live-imaging and confocal microscopy of immobilized apical-out organoids, follow option B. To prepare suspended apical-out organoids for immunofluorescence imaging, follow option C. To infect enteroids with Salmonella, follow option D. To evaluate barrier integrity, follow option E. To measure fatty acid uptake, follow option F.
-
(A)
Basolateral-out organoids in suspension culture
Timing 1.5 h hands-on
Critical
-
(i)
Harvest organoids by releasing them from the ECM as described above (Steps 1–6).
-
(ii)
After washing organoids (as described in Steps 7–9), dilute BME to 20% (vol/vol) in the appropriate organoid medium on ice.
Critical
If the medium is not cold enough during the BME dilution step, the BME will gel in clumps instead of forming a homogeneous suspension.
-
(iii)
Resuspend the organoids in the 20% (vol/vol) BME/medium solution and transfer 400 µl of the organoid suspension into each well of a 24-well ultra-low-attachment plate.
-
(iv)
Incubate suspension cultures at 37 °C in a 5% CO2 incubator. Basolateral-out organoids can be maintained in 20% (vol/vol) BME (Fig. 3b,c) for the same number of days as the apical-out organoids in suspension without BME for parallel experimental evaluation. For incubations longer than 4 d, we recommend changing the medium with 20% (vol/vol) BME every 3 d (Step 13).
-
(i)
-
(B)
Live-imaging of immobilized apical-out organoids
Timing 10 min to immobilize the organoids
Critical
See Supplementary Video 1 for an example of a gastroid in the process of polarity eversion using time-lapse DIC microscopy and then analyzed by confocal microscopy.
-
(i)
Prepare the inverted microscope within an environmental control chamber with DIC optics. We use a Nikon TE2000E equipped with dry 40× or oil immersion 60× objectives.
-
(ii)
Equilibrate the environmental chamber to 37 °C with 5% CO2 gas.
-
(iii)
Turn on the camera and connect to appropriate software. We use a Hamamatsu high-resolution ORCA-285 digital microscope camera controlled with OpenLab 5.5.2 software.
-
(iv)
Transfer suspended organoids from a well of an ultra-low-attachment 24-well plate into a 1.5-ml conical microcentrifuge tube.
-
(v)
Pellet organoids in a 1.5-ml microcentrifuge tube and remove most of the medium, leaving 15 µl of medium in the tube.
-
(vi)
For short recordings (<1 h), make an imaging chamber by using two coverslips separated by small drops of vacuum grease to avoid crushing the organoids. For longer recordings, proceed to the next step:
-
Use a 24 mm × 40 mm clean coverslip as the bottom of the chamber. Using vacuum grease loaded into a 10-ml syringe, spot vacuum grease in four spots around the center of the coverslip to serve as spacers.
-
Resuspend the organoid pellet in 15 µl of residual medium and pipette onto the center of the coverslip between the spacers.
-
Place a smaller 22 mm × 22 mm coverslip on top of the vacuum grease spacers.
-
While monitoring the chamber by using a dissecting microscope, use forceps to gently lower the top coverslip until it touches the drop of medium with the organoids. Continue pressing the top coverslip down gently until the organoids are gently immobilized between the two coverslips, but not deformed and crushed. Note that organoids should ideally be similar in size so that the top coverslip does not shear or flatten the larger organoids.
-
If required, add additional medium between the coverslips by adding a drop to one side of the chamber. Remove excess medium or flow fresh medium through the chamber by gentle suction with a disposable tissue-style wipe used as a wick from one side of the chamber.
Critical
This setup works well only for short recordings, because the medium will evaporate and concentrate in the samples.
-
-
(vii)
For longer recordings (>1 h):
-
In the center of a chambered coverglass, add vacuum grease loaded into a 10-ml syringe. Spot vacuum grease in four spots around the center of the chamber to serve as spacers.
-
Resuspend the organoid pellet in 15 µl of residual medium and pipette onto the center of the chamber between the spacers.
-
Place a round coverslip on top of the vacuum grease spacers.
-
While monitoring the chamber using a dissecting microscope, use forceps to gently lower the round coverslip until it touches the drop of medium with the organoids. Continue pressing the top coverslip down gently until the organoids are gently immobilized, but not deformed and crushed. Note that organoids should ideally be similar in size so that the coverslip does not shear or flatten the larger organoids.
Critical
It is important to avoid damaging the organoids by crushing them.
-
Fill the chamber with medium and place the plastic cover onto the chamber.
-
-
(i)
-
(C)
Preparing suspended organoids for confocal immunofluorescence imaging
Timing 9 h, 1 h hands-on
Critical
Fixation and staining steps can be performed in conical microcentrifuge tubes. If there is organoid loss because of adhesion of organoids to the plastic tube walls, we recommend using LoBind microcentrifuge tubes to maximize sample recovery.
-
(i)
Transfer suspended organoids from each well of an ultra-low-attachment well plate into a 1.5-ml conical microcentrifuge tube.
-
(ii)
Pellet organoids at 300g for 1 min, remove the supernatant and fix by adding 300 µl of paraformaldehyde fixative solution. If necessary, pipette up and down gently to dislodge the pellet.
-
(iii)
Incubate organoids in paraformaldehyde fixative solution for 30 min at room temperature.
-
(iv)
Pellet organoids at 300g for 1 min and use a pipette to gently remove the paraformaldehyde fixative solution and wash with PBS.
Pause point
Fixed samples can be stored in PBS at 4 °C for ≤1 week.
-
(v)
Pellet organoids at 300g for 1 min, remove PBS and proceed with the desired immunostaining protocol in the same tube:
-
Prepare the primary antibody staining solution. Dilute primary antibodies at appropriate concentrations (must be optimized for each antibody, typically between 1:50 and 1:200 dilution) in blocking/permeabilization buffer. For one sample in a microcentrifuge tube, 100 µl of antibody solution is typically sufficient.
-
Resuspend fixed organoids in 100 µl of primary antibody staining solution in a microcentrifuge tube.
-
Incubate organoids in a microcentrifuge tube at room temperature for ≥4 h.
-
Pellet organoids by centrifuging at 300g for 1 min in a microcentrifuge. Use a pipette to gently remove the primary antibody solution.
-
Wash with PBS. Add 300 µl of PBS to each sample, then pellet organoids by centrifuging at 300g for 1 min in a microcentrifuge and remove the supernatant.
-
Prepare the secondary antibody staining solution. Dilute secondary antibodies together with DAPI, and/or phalloidin as desired, at appropriate concentrations in blocking/permeabilization buffer (typically 1:500 for secondary antibodies). For one sample in a microcentrifuge tube, 100 µl of antibody solution is typically sufficient.
-
Resuspend organoids in 100 µl of secondary antibody staining solution in a microcentrifuge tube.
-
Incubate organoids in a microcentrifuge tube at room temperature for ≥4 h.
-
Pellet organoids by centrifuging at 300g for 1 min in a microcentrifuge. Use a pipette to gently remove the secondary antibody solution.
-
Wash with PBS. Add 300 µl of PBS to each sample and then pellet organoids by centrifuging at 300g for 1 min in a microcentrifuge.
-
-
(vi)
On a glass microscope slide, use a PAP pen to draw a ‘well’ for the sample. Allow the PAP pen ink to dry.
-
(vii)
After the last wash of the staining protocol, remove the wash solution. Do not allow stained organoids to dry out.
-
(viii)
Resuspend organoids in 10 µl of Vectashield and transfer the organoid mixture to the center of the PAP pen well on the slide. If organoids are not evenly distributed, use a pipette tip to stir the organoids in the Vectashield on the slide. Alternatively, organoids can be resuspended in 10 µl of PBS and transferred to the PAP pen well on the slide, and then Vectashield can be added on top of the sample after removing excess PBS.
-
(ix)
Using vacuum grease loaded into a 10-ml syringe, spot vacuum grease at the slide corners to serve as spacers. Place a 22 × 60 mm coverslip on top of the slide. Use forceps to gently press the corners of the coverslip until the coverslip touches the mounting medium.
Critical step
If the coverslip is pressed too close to the microscope slide, larger organoids may be sheared or flattened.
-
(x)
Image using a confocal microscope or store the slides horizontally at −20 °C for ≤1 week before imaging. For generating overview images of a whole organoid, we recommend using a confocal microscope with a 20× objective. For visualization of specific cell–microbe interactions or subcellular structures like microvilli, we recommend using oil immersion 40× or 63× objectives.
-
(i)
-
(D)
Enteroid Salmonella infection
Timing >2 d
Critical
See Fig. 4 for a representative image of how infected organoids can be visualized and quantified using apical-out enteroids.
Critical
This procedure describes infection with Salmonella; however, alternative pathogens can be used. Two other example applications in which infection of apical-out enteroids were used include visualization of L. monocytogenes invading, replicating and exiting human ileal enteroids21 and infection of human apical-out lung organoids with SARS-CoV-223.
Caution
Appropriate laboratory containment and biosafety protocols should be followed, depending on the biosafety level of the bacteria or virus being studied. For example, biosafety level 2 should be used for Salmonella.
-
(i)
Grow S. Typhimurium strain SL1344 in Luria broth overnight at 37 °C, shaking on a benchtop incubator at 200 rpm.
-
(ii)
Subculture the bacteria by diluting 1:20 into Luria broth with 300 mM NaCl.
-
(iii)
Grow the subculture at 37 °C in a CO2 incubator for 2–3 h.
-
(iv)
Pellet bacteria by centrifuging at 6,000g for 3 min. Use a pipette to gently remove the supernatant. Resuspend the bacterial pellet to desired bacterial density in advanced DMEM/F12 medium without antibiotics.
-
(v)
Pellet apical-out enteroids (produced using Steps 1–13) by centrifuging at 300g for 1 min. Use a pipette to gently remove the supernatant.
-
(vi)
Resuspend enteroids in bacteria-containing medium to initiate infection.
-
(vii)
Incubate the bacteria and enteroid culture at 37 °C in a CO2 incubator for the desired time. S. Typhimurium invasion of apical-out enteroid cells can be observed after 1 h of infection.
-
(viii)
Examine infected enteroids by imaging (by following option B or C) or other molecular biology techniques such as flow cytometry or qRT-PCR. Invading or attached S. Typhimurium can be quantified by manual counting of bacteria in confocal Z stacks (Fig. 4b).
-
(i)
-
(E)
Evaluating barrier integrity
Timing 1–2 h
Critical
See Fig. 5 for a diagram of the workflow of this part of the procedure and an example of an experiment evaluating the differences in epithelial membrane integrity of infected versus uninfected enteroids.
-
(i)
Collect suspended apical-out enteroids from a well of a 24-well plate and transfer into a microcentrifuge tube. A well can be divided to be used for more than one treatment condition.
-
(ii)
Pellet enteroids in a microcentrifuge tube by centrifuging at 300g for 1 min. Use a pipette to gently remove the medium.
-
(iii)
Resuspend enteroids and distribute them into separate wells containing (i) the experimental treatment (medium + experimental treatment), (ii) negative control (medium only) and (iii) positive control (EDTA in PBS; see below).
-
(iv)
Incubate for the desired time.
Critical step
We recommend treating each well/treatment condition of organoids one at a time because they must be imaged immediately after the treatment.
-
(v)
For a positive control of disrupted barrier integrity, treat enteroids with EDTA by resuspending enteroids in 200 µl of 2 mM EDTA in PBS on ice for 15 min. For a negative control, proceed to the next step.
Critical step
Enteroids incubated with EDTA must remain on ice to avoid enteroid cell death. It is important to remove EDTA solution before imaging (as described in the next step) to avoid EDTA toxicity.
-
(vi)
Pellet enteroids by centrifuging at 300g for 1 min and then remove the supernatant.
-
(vii)
Wash with DMEM by adding 300 µl of DMEM to each sample and then pellet enteroids by centrifuging at 300g for 1 min. Remove the supernatant.
-
(viii)
Resuspend enteroids in a solution of 4-kDa FITC-dextran (2 mg/ml) diluted in DMEM without phenol red (to avoid phenol red interference with fluorescence measurements).
-
(ix)
Allow enteroids to settle by gravity into a pellet in the microcentrifuge tube (~5 min) and then gently remove the FITC-dextran solution by using a pipette, leaving ~10 µl in the bottom of the tube.
-
(x)
On a glass microscope slide, use a PAP pen to draw a circle ~2 cm in diameter to create a ‘well’. Allow the PAP pen ink to dry.
-
(xi)
Using a P20 pipette, resuspend the enteroids in the remaining FITC-dextran solution and transfer to the middle of the PAP pen well.
-
(xii)
Using vacuum grease loaded into a 10-ml syringe, spot vacuum grease at the slide corners as adhesives. Place a coverslip on top of the slide. Use forceps to gently press the corners of the coverslip until the coverslip touches the medium and immobilizes the enteroids.
Critical
If the coverslip is pressed too close to the microscope slide, larger enteroids may be sheared, thereby disrupting barrier function.
-
(xiii)
Immediately image live using a confocal microscope. Collect DIC and fluorescence images with a 20× or 40× oil objective.
Critical
If the enteroids are left too long on the imaging platform, they may lose epithelial barrier integrity. Prepare each sample immediately before imaging.
-
(xiv)
Overlay fluorescence and DIC images and quantify. We use FIJI/ImageJ or Volocity image analysis software.
-
(xv)
Calculate the percentage of enteroids with intact barrier integrity by dividing the number of enteroids that excluded FITC-dextran by the total number of enteroids.
-
(i)
-
(F)
Measuring fatty acid uptake
Timing 1–2 h
Critical
See Fig. 6 for a diagram of the uptake of fatty acids into intestinal epithelial cells and a representative confocal microscopy image of an apical-out enteroid after uptake of labelled fatty acids.
-
(i)
Prepare the fluorescent fatty acid analog solution:
-
In DMEM without phenol red, dilute C1-BODIPY-C12 to a final concentration of 5 µM and fatty acid–free BSA, which acts as a carrier protein, to a final concentration of 5 µM into DMEM without phenol red.
-
Mix well by pipetting up and down.
-
Incubate the solution at room temperature in the dark for 10 min.
-
-
(ii)
Collect apical-out enteroids in suspension from a well of a 24-well plate and transfer into a microcentrifuge tube. Each well can be used for one experimental condition.
-
(iii)
Pellet enteroids by centrifuging at 300g for 1 min. Use a pipette to gently remove the medium.
-
(iv)
Wash by adding 300 µl of DMEM without phenol red to each sample, pellet enteroids by centrifuging at 300g for 1 min in a microcentrifuge and then remove the supernatant.
Critical step
It is important to wash cells with DMEM without phenol red (phenol red is fluorescent at certain wavelengths and may increase the background fluorescence and interfere in measurements).
-
(v)
Pellet enteroids by centrifuging at 300g for 1 min. Use a pipette to gently remove the medium.
-
(vi)
Resuspend the enteroids in 400 µl of the fluorescent fatty acid analog solution. Transfer the enteroids/fluorescent fatty acid analog solution into wells of a low-attachment 24-well plate.
-
(vii)
Incubate at 37 °C in a 5% CO2 incubator for 30 min.
-
(viii)
Fix, stain and image samples using confocal microscopy as described above in option C.
-
(ix)
Quantify C1-BODIPY-C12 uptake by measuring the intracellular green fluorescence signal. We use FIJI/ImageJ or Volocity image analysis software for fluorescence quantification.
-
(i)
-
(A)
Troubleshooting
Troubleshooting advice can be found in Table 1.
Timing
-
Steps 1–13, apical-out GI organoids in suspension culture: 1–7 d, 1.5 h hands-on
-
Step 14A, basolateral-out organoids in suspension culture: 1–7 d for enteroids, 1.5 h hands-on
-
Step 14B, live imaging of immobilized apical-out organoids: 10 min to immobilize organoids plus the imaging time, 1 h hands-on
-
Step 14C, preparing suspended apical-out organoids for fluorescence imaging: 9 h, 1 h hands-on
-
Step 14D, enteroid Salmonella infection: >2 d
-
Step 14E, evaluating barrier integrity: 1–2 h
-
Step 14F, measuring fatty acid uptake: 1–2 h
Anticipated results
The protocol described here is robust, generates reproducible results and can be applied to different adult tissue stem cell–derived epithelial organoids. We have used this method with multiple lines of GI organoids (from both human and mouse origin)21,39,42. We have also successfully used Steps 1–13 to obtain apical-out lung organoids, modifying the procedure slightly23. We anticipate that this protocol can be adapted to other epithelial tissues, because other groups have reported successful generation of apical-out epithelial polarity in organoids derived from other tissues24,25. One limitation is that the differentiation of GI-embedded organoids compromises viability during polarity reversal; thus, only undifferentiated GI organoids should be used with this protocol.
For Gl organoids, evaluating the success of the apical-out reversal protocol can be achieved by both brightfield microscopy and immunofluorescence microscopy. With experience, morphological changes can be quickly identified under an inverted phase contrast microscope (Fig. 1b). Basolateral-out GI organoids are typically cysts that are ‘bubble-like’ in appearance, because they are comprised of a single epithelial cell layer and have a distinguishable lumen (Fig. 1b, top). In contrast, apical-out GI organoids, visible as early as 1 d after transfer to suspension culture, have a more solid morphology because there is no longer a lumen (Fig. 1b, bottom). To confirm polarity reversal by confocal microscopy, rapid staining of fixed organoids with fluorescently labeled phalloidin (which stains F-actin) will show the apical F-actin–rich brush border microvilli as dense phalloidin staining on the organoid’s external surface, rather than facing the lumen (Figs. 1b and 2). In addition, antibodies against proteins that have polarized distribution and can serve as polarity markers (e.g., the tight-junction associated protein ZO-1 or adherens junction protein β-catenin) can stain apical junctions and basolateral membranes, respectively. These markers can be helpful in determining whether the epithelium has proper apico-basal polarity and has the expected organization of cell–cell junctions (Fig. 2a,b,d,e). Differentiation of apical-out enteroids can also be evaluated kinetically. After transfer to suspension culture, enteroids can be sampled from a single well at various time points and evaluated for differentiation markers, for example, by qRT-PCR or immunofluorescence microscopy21. Differentiation markers for intestinal epithelial cells, lysozyme (Paneth cells), MUC2 (goblet cells), chromogranin A (enteroendocrine cells) and villin (enterocytes) (Fig. 2g) are visible by immunofluorescence microscopy after 5 d in suspension culture. These markers are also useful for confirming proper organoid polarization. For instance, intracellular mucins should be localized in granules apically in relation to the nucleus (Fig. 2c,f), and goblet cells secrete mucins apically (see MUC2 in a goblet cell in Fig. 2c,g).
This protocol describes how to infect enteroids with Salmonella as an example (Fig. 4), but similar methodology has been applied to multiple other pathogens21,25,42 including SARS-CoV-210,23. We also show an example of how the FITC-dextran diffusion assay is used to evaluate apical-out enteroid epithelial barrier integrity by using confocal microscopy after a bacterial infection (Fig. 5). The fluorescent FITC-dextran remains excluded from the organoid interior and intercellular spaces of apical-out organoids with intact barrier integrity, whereas fluorescence can be visualized in the interior of organoids with disrupted barrier integrity. This can also be adapted to other organoid types and to test the effects of other agents on barrier function. We also describe an assay to evaluate polarized nutrient absorption by enterocytes. In this method, fluorescently labeled fatty acids are absorbed at the apical membrane of enteroid cells from the surrounding medium, and intracellular fluorescent signal visualized by fluorescence microscopy indicates successful fatty acid uptake (Fig. 6). This assay can be also adapted to study uptake of various fluorescently labeled compounds into organoid cells.
Data availability
All data generated or analyzed during this study are included in this published article and in our primary research article21. No datasets were generated or analyzed during the current study. Source data are provided with this paper. Additional source data underlying the figures are available from the corresponding author upon request.
References
Barker, N. Adult intestinal stem cells: critical drivers of epithelial homeostasis and regeneration. Nat. Rev. Mol. Cell Biol. 15, 19–33 (2014).
Sato, T. & Clevers, H. Growing self-organizing mini-guts from a single intestinal stem cell: mechanism and applications. Science 340, 1190–1194 (2013).
Huch, M. & Koo, B. K. Modeling mouse and human development using organoid cultures. Development 142, 3113–3125 (2015).
Clevers, H. Modeling development and disease with organoids. Cell 165, 1586–1597 (2016).
Han, X. et al. Lactobacillus rhamnosus GG prevents epithelial barrier dysfunction induced by interferon-gamma and fecal supernatants from irritable bowel syndrome patients in human intestinal enteroids and colonoids. Gut Microbes 10, 59–76 (2019).
Yin, Y., Jonge, H. R., Wu, X. & Yin, Y. Enteroids for nutritional studies. Mol. Nutr. Food Res. 63, e1801143 (2019).
Zachos, N. C. et al. Human enteroids/colonoids and intestinal organoids functionally recapitulate normal intestinal physiology and pathophysiology. J. Biol. Chem. 291, 3759–3766 (2016).
Pearce, S. C. et al. Intestinal enteroids recapitulate the effects of short-chain fatty acids on the intestinal epithelium. PLoS One 15, e0230231 (2020).
Saxena, K. et al. Human intestinal enteroids: a new model to study human rotavirus infection, host restriction, and pathophysiology. J. Virol. 90, 43–56 (2016).
Zang, R. et al. TMPRSS2 and TMPRSS4 promote SARS-CoV-2 infection of human small intestinal enterocytes. Sci. Immunol. 5, eabc3582 (2020).
Koestler, B. J. et al. Human intestinal enteroids as a model system of Shigella pathogenesis. Infect. Immun. 87, e00733-18 (2019).
Sierra, J. C. et al. Spermine oxidase mediates Helicobacter pylori-induced gastric inflammation, DNA damage, and carcinogenic signaling. Oncogene 39, 4465–4474 (2020).
Ranganathan, S. et al. Evaluating Shigella flexneri pathogenesis in the human enteroid model. Infect. Immun. 87, e00740-18 (2019).
Bartfeld, S. et al. In vitro expansion of human gastric epithelial stem cells and their responses to bacterial infection. Gastroenterology 148, 126–136 (2015).
Yoo, J.-H., Donowitz, M. & Yoo, J. H. Intestinal enteroids/organoids: a novel platform for drug discovery in inflammatory bowel diseases. World J. Gastroenterol. 25, 4125–4147 (2019).
Schütte, M. et al. Molecular dissection of colorectal cancer in pre-clinical models identifies biomarkers predicting sensitivity to EGFR inhibitors. Nat. Commun. 8, 14262 (2017).
Van De Wetering, M. et al. Prospective derivation of a living organoid biobank of colorectal cancer patients. Cell 161, 933–945 (2015).
Bigorgne, A. E. et al. TTC7A mutations disrupt intestinal epithelial apicobasal polarity. J. Clin. Invest. 124, 328–337 (2014).
Sato, T. et al. Single Lgr5 stem cells build crypt–villus structures in vitro without a mesenchymal niche. Nature 459, 262–265 (2009).
Sato, T. et al. Long-term expansion of epithelial organoids from human colon, adenoma, adenocarcinoma, and Barrett’s epithelium. Gastroenterology 141, 1762–1772 (2011).
Co, J. Y. et al. Controlling epithelial polarity: a human enteroid model for host-pathogen interactions. Cell Rep. 26, 2509–2520 (2019).
Fujii, M. & Sato, T. Somatic cell-derived organoids as prototypes of human epithelial tissues and diseases. Nat. Mater. 20, 156–169 (2021).
Salahudeen, A. A. et al. Progenitor identification and SARS-CoV-2 infection in human distal lung organoids. Nature 588, 670–675 (2020).
Krüger, M. et al. Cellulose nanofibril hydrogel promotes hepatic differentiation of human liver organoids. Adv. Healthc. Mater. 9, e1901658 (2020).
Li, Y. et al. Next-generation porcine intestinal organoids: an apical-out organoid model for swine enteric virus infection and immune response investigations. J. Virol. 94, e0100620 (2020).
Wilson, S. S., Tocchi, A., Holly, M. K., Parks, W. C. & Smith, J. G. A small intestinal organoid model of non-invasive enteric pathogen-epithelial cell interactions. Mucosal Immunol. 8, 352–361 (2014).
Bartfeld, S. & Clevers, H. Organoids as model for infectious diseases: culture of human and murine stomach organoids and microinjection of Helicobacter pylori. J. Vis. Exp. 105, 53359 (2015).
Buti, L. et al. CagA–ASPP2 complex mediates loss of cell polarity and favors H. Pylori colonization of human gastric organoids. Proc. Natl Acad. Sci. USA 117, 2645–2655 (2020).
Jattan, J. et al. Using primary murine intestinal enteroids to study dietary TAG absorption, lipoprotein synthesis, and the role of apoC-III in the intestine. J. Lipid Res. 58, 853–865 (2017).
Wilson, S. S. et al. Alpha-defensin-dependent enhancement of enteric viral infection. PLoS Pathog. 13, e1006446 (2017).
Lamers, M. M. et al. SARS-CoV-2 productively infects human gut enterocytes. Science 369, 50–54 (2020).
VanDussen, K. L. et al. Development of an enhanced human gastrointestinal epithelial culture system to facilitate patient-based assays. Gut 64, 911–920 (2015).
Moon, C., Vandussen, K. L., Miyoshi, H. & Stappenbeck, T. S. Development of a primary mouse intestinal epithelial cell monolayer culture system to evaluate factors that modulate IgA transcytosis. Mucosal Immunol. 7, 818–828 (2014).
Williamson, I. A. et al. A high-throughput organoid microinjection platform to study gastrointestinal microbiota and luminal physiology. Cell. Mol. Gastroenterol. Hepatol. 6, 301–319 (2018).
Fasciano, A. C., Blutt, S. E., Estes, M. K. & Mecsas, J. Induced differentiation of m cell-like cells in human stem cell-derived ileal enteroid monolayers. J. Vis. Exp. (149), e59894 (2019).
Ding, S. et al. Retinoic acid and lymphotoxin signaling promote differentiation of human intestinal M cells. Gastroenterology 159, 214–226.e1 (2020).
Kumar, P. et al. Enterotoxigenic Escherichia coli–blood group A interactions intensify diarrheal severity. J. Clin. Invest. 128, 3298–3311 (2018).
In, J. et al. Enterohemorrhagic Escherichia coli reduces mucus and intermicrovillar bridges in human stem cell-derived colonoids. Cell. Mol. Gastroenterol. Hepatol. 2, 48–62.e3 (2016).
Wosen, J. E. et al. Human intestinal enteroids model MHC-II in the gut epithelium. Front. Immunol. 10, 1970 (2019).
Pentecost, M., Kumaran, J., Ghosh, P. & Amieva, M. R. Listeria monocytogenes internalin B activates junctional endocytosis to accelerate intestinal invasion. PLoS Pathog. 6, e1000900 (2010).
Galán, J. E. Salmonella interactions with host cells: type III secretion at work. Annu. Rev. Cell Dev. Biol. 17, 53–86 (2001).
Rajan, A. et al. Enteroaggregative E. coli adherence to human heparan sulfate proteoglycans drives segment and host specific responses to infection. PLOS Pathog. 16, e1008851 (2020).
Giobbe, G. G. et al. SARS-CoV-2 infection and replication in human fetal and pediatric gastric organoids. Preprint at bioRxiv https://doi.org/10.1101/2020.06.24.167049 (2020).
Suzuki, T. Regulation of intestinal epithelial permeability by tight junctions. Cell. Mol. Life Sci. 70, 631–659 (2013).
Oshima, T. & Miwa, H. Gastrointestinal mucosal barrier function and diseases. J. Gastroenterol. 51, 768–778 (2016).
Marchiando, A. M., Graham, W. V. & Turner, J. R. Epithelial barriers in homeostasis and disease. Annu. Rev. Pathol. 5, 119–144 (2010).
Pagano, R. E. & Sleight, R. G. Defining lipid transport pathways in animal cells. Science 229, 1051–1057 (1985).
Wang, T. Y., Liu, M., Portincasa, P. & Wang, D. Q. H. New insights into the molecular mechanism of intestinal fatty acid absorption. Eur. J. Clin. Invest. 43, 1203–1223 (2013).
Dubikovskaya, E., Chudnovskiy, R., Karateev, G., Park, H. M. & Stahl, A. Measurement of long-chain fatty acid uptake into adipocytes. Methods Enzymol. 538, 107–134 (2014).
Drecktrah, D. et al. Dynamic behavior of Salmonella-induced membrane tubules in epithelial cells. Traffic 9, 2117–2129 (2008).
Miyoshi, H. & Stappenbeck, T. S. In vitro expansion and genetic modification of gastrointestinal stem cells in spheroid culture. Nat. Protoc. 8, 2471–2482 (2013).
Acknowledgements
We thank R. Cooper for reagent preparation and the laboratory of C. Kuo for support in deriving GI organoids. This study was supported by the Stanford Child Health Research Institute Postdoctoral Award (to J.Y.C.), NIH T32AI007328-29 (support to J.Y.C.), Novo Nordisk Foundation Challenge Programme (to M.R.A and M.M.-C.), NIH U19AI116484-01 (to M.R.A. and D.M.M.), Bill and Melinda Gates Foundation/Stanford CHSI Pilot Grant (to M.R.A. and D.M.M) and OPP1113682 (to M.R.A).
Author information
Authors and Affiliations
Contributions
J.Y.C. and M.M.-C developed the protocol for the apical-out GI organoids and the referenced apical-out lung organoids, respectively, and performed the experiments. J.Y.C., M.M.-C., D.M.M. and M.R.A. conceived the study and prepared the manuscript.
Corresponding author
Ethics declarations
Competing interests
The authors declare no competing interests.
Additional information
Peer review information Nature Protocols thanks the anonymous reviewers for their contribution to the peer review of this work.
Publisher’s note Springer Nature remains neutral with regard to jurisdictional claims in published maps and institutional affiliations.
Related links
Key references using this protocol
Co, J. Y. et al. Cell Rep. 26, 2509–2520 (2019): https://doi.org/10.1016/j.celrep.2019.01.108
Salahudeen, A. A. et al. Nature 588, 670–675 (2020): https://doi.org/10.1038/s41586-020-3014-1
Supplementary information
41596_2021_607_MOESM1_ESM.mov
Supplementary Video 1 Human gastroid polarity reversal. Time-lapse DIC microscopy movie of a gastroid immediately after removal from BME shows that the process of polarity reversal occurs by morphogenetic eversion. The same gastroid was fixed, stained and imaged by 3D confocal microscopy to confirm apical-out polarity (F-actin–rich microvilli (arrow) face outward). Nuclei are stained with DAPI (blue; ThermoFisher Scientific, cat. no. D3571; RRID: AB_2307445), and the actin cytoskeleton is stained with AlexaFluor 660 phalloidin (F-actin, white; ThermoFisher, cat. no. A22285), both diluted 1:500. Scale bar, 10 µm.
Source data
Source Data Fig. 3
Raw data Fig. 3.
Source Data Fig. 4
Raw data Fig. 4b.
Source Data Fig. 5
Raw data Fig. 5c.
Rights and permissions
About this article

Cite this article
Co, J.Y., Margalef-Català, M., Monack, D.M. et al. Controlling the polarity of human gastrointestinal organoids to investigate epithelial biology and infectious diseases. Nat Protoc 16, 5171–5192 (2021). https://doi.org/10.1038/s41596-021-00607-0
Received:
Accepted:
Published:
Issue Date:
DOI: https://doi.org/10.1038/s41596-021-00607-0
This article is cited by
-
The population context is a driver of the heterogeneous response of epithelial cells to interferons
Molecular Systems Biology (2024)
-
Probing milk extracellular vesicles for intestinal delivery of RNA therapies
Journal of Nanobiotechnology (2023)
-
Use of mouse primary epidermal organoids for USA300 infection modeling and drug screening
Cell Death & Disease (2023)
-
Mechanosensitive extrusion of Enterovirus A71-infected cells from colonic organoids
Nature Microbiology (2023)
-
Human pancreatic ductal organoids with controlled polarity provide a novel ex vivo tool to study epithelial cell physiology
Cellular and Molecular Life Sciences (2023)
Comments
By submitting a comment you agree to abide by our Terms and Community Guidelines. If you find something abusive or that does not comply with our terms or guidelines please flag it as inappropriate.
