
Abstract
Affinity purification coupled with mass spectrometry (AP–MS) and proximity-dependent biotinylation identification (BioID) methods have made substantial contributions to interaction proteomics studies. Whereas AP−MS results in the identification of proteins that are in a stable complex, BioID labels and identifies proteins that are in close proximity to the bait, resulting in overlapping yet distinct protein identifications. Integration of AP–MS and BioID data has been shown to comprehensively characterize a protein’s molecular context, but interactome analysis using both methods in parallel is still labor and resource intense with respect to cell line generation and protein purification. Therefore, we developed the Multiple Approaches Combined (MAC)-tag workflow, which allows for both AP–MS and BioID analysis with a single construct and with almost identical protein purification and mass spectrometry (MS) identification procedures. We have applied the MAC-tag workflow to a selection of subcellular markers to provide a global view of the cellular protein interactome landscape. This localization database is accessible via our online platform (http://proteomics.fi) to predict the cellular localization of a protein of interest (POI) depending on its identified interactors. In this protocol, we present the detailed three-stage procedure for the MAC-tag workflow: (1) cell line generation for the MAC-tagged POI; (2) parallel AP–MS and BioID protein purification followed by MS analysis; and (3) protein interaction data analysis, data filtration and visualization with our localization visualization platform. The entire procedure can be completed within 25 d.
Introduction
Almost all biological processes are mediated through protein–protein interactions (PPIs); hence, the accurate identification and annotation of PPIs is of great importance in systems biology. Three methods commonly used for the systematic identification of PPIs are yeast two-hybrid (Y2H) assays, AP–MS and proximity-dependent BioID. The Y2H assay is an in vivo genetic method to screen for binary PPIs1. It is an affordable method that requires minimal equipment and can be carried out in most laboratories2,3,4. The main drawbacks of the Y2H are the possibility of a high number of false-positive and false-negative interactions. In contrast, AP depends on use of antibodies or, more commonly, on the expression of a bait protein with an affinity tag in cells. Once the bait protein interacts with its binding partners, the protein complex forms and can be purified from the cell lysate using a matrix that specifically recognizes the affinity tag. AP–MS allows the identification of protein interactions under the near physiological conditions within a cell. The key advantages of this approach are that it can be applied to large-scale studies and that it shows high intra- and inter-laboratory reproducibility5. However, weak and transient interactions (such as enzyme–substrate interactions) that do not form stable protein complexes are often difficult to capture using AP–MS owing to their highly dynamic nature. Moreover, the protein complexes might be insoluble in standard lysis buffer used in AP–MS. In 2012, BioID emerged as a complementary and alternative approach to Y2H and AP–MS6. It involves the expression of a bait protein fused with the promiscuous biotin ligase (BirA*), which is an R118G mutant of wild-type Escherichia coli biotin ligase. BirA* uses biotin and ATP as substrates to generate a highly reactive biotinyl-5′-AMP intermediate that, in turn, labels primary amines on nearby proteins by forming an amide bond between biotin and available lysine side chains. The short half-life of the reactive biotinyl-5′-AMP limits the effective labeling radius to ~10 nm7. The biotinylated proteins bind to immobilized streptavidin beads during purification and are eluted from beads with excess biotin for MS analysis. The major advantage of BioID compared to AP–MS is that it can be used to capture weak and/or transient PPIs such as enzyme–substrate interactions—for example, kinases and phosphatases with their substrates8,9. However, it is important to note that the proteins identified by BioID might not be direct binders but merely proximate proteins.
Integration of AP–MS and BioID has been shown to be able to comprehensively characterize a protein’s molecular context8,10,11,12 but has previously required several expression vectors, multiple cloning steps and generation of individual cell lines for both approaches, becoming a very laborious task. We recently developed the MAC-tag workflow, which integrates both AP–MS and BioID analysis within a single construct and allows for protein purification and identification procedures that are largely identical13. We have applied the MAC-tag workflow to a set of 20 subcellular markers, thereby creating a subcellular view of the protein interaction landscape. This web-based platform (which we termed ‘MS-microscopy’) can be used as a reference grid to predict the cellular localization of a POI based on its identified interaction partners (http://proteomics.fi). In this protocol, we provide the detailed step-by-step procedures for cloning proteins of interest into the MAC-tac plasmid, creating clonal cell lines, AP–MS and BioID-MS identification of PPIs and localization assignment using the MS-microscopy platform.
Development of the protocol
AP–MS and BioID are being used with increasing popularity in interaction proteomics studies, and many of these studies make use of overexpressed tagged bait proteins, for example via transient transfection or viral transduction14,15,16. However, high protein overexpression and large cell-to-cell variation of expression levels might introduce artifactual interactors to the bait protein and thus lead to false-positive results. To avoid such effects, several large-scale interaction proteomic studies employ the Flp-In T-REx 293 cell line5,8,17,18,19, which allows rapid generation of isogenic and inducible stable cell clones with only a single copy of a transgene in their genome20. Although advantageous in many aspects, this strategy is relatively laborious when one aims to perform interactome analysis using complementarily both AP–MS and BioID, owing to the requirement to generate separate cell lines for each approach.
To overcome these challenges, an earlier method combined the FLAG affinity tag with BirA* for parallel AP–MS and BioID purification21. Although the time for the cloning and generation of the cell lines was greatly reduced, different binding matrixes and separate protocols are required for purification of the bait protein for either AP–MS or BioID. This not only makes the affinity purification procedure more complicated but also makes data filtering (eg, statistical filtering) and data processing (eg, data integration) much more challenging. We therefore sought to develop an approach that enables AP–MS and BioID using a single construct, in a single cell line, and use the same matrix and highly similar procedures for the two purification strategies. This has cumulated in the introduction of the MAC-tag, which contains a twin-strep affinity tag and BirA* in one construct, requires generation of only one isogenic cell line and allows one-step protein purification by Strep-Tactin matrix22 for both AP–MS and BioID pipelines.
We tested the developed MAC-tag workflow on 20 bona fide subcellular localization marker proteins and found that our approach accelerates the complete workflow, from cloning to cell line generation and protein interactome identification. Meanwhile, we used the signatures of interacting and proximal proteins for every cellular compartment to build a reference molecular context repository, which we termed the MS-microscopy platform (http://proteomics.fi). The MS-microscopy platform considers the identification and abundance of interactors and provides localization assignment at the molecular level for a POI. Notably, it is very sensitive in detecting alterations and can be used as an additional tool for investigating proteins with disease-related mutations that result in abnormal cellular distribution and localization23,24,25.
At the time of our Nature Protocols manuscript preparation, the Gingras group released a preprint describing a proximity biotinylation map in HEK293 cells26. They applied the BioID approach to 192 bait proteins from 32 different subcellular regions and generated 35,902 unique high-confidence interactions to predict the subcellular localization of 4,145 prey proteins. We used their interaction profiles of 182 bait proteins (excluding ten bait proteins that were used in constructing the original version of our MS-microscopy platform) to verify the comprehensiveness of our MS-microscopy platform. The results showed that, in 46.7% (85/182) of bait proteins, the MS-microscopy platform assigned localizations that matched to the verified localization of the bait protein. The remaining 97 bait proteins were mainly localized in the following areas from their studies: cell junction, centrosome, plasma membrane, actin cytoskeleton, intermediate filament, microtubule cytoskeleton and nucleoplasm26. To expand the coverage of our MS-microscopy platform, we decided to incorporate their PPI data26 into our database. Nevertheless, a large portion of these 182 baits have multiple localization by bioinformatics prediction and literature review (Protein Atlas, PubMed, Uniprot and CellWhere as reference). To make sure the selected bait proteins have the exclusive subcellular localizations, we compared the localization information of the baits26 with information obtained from the Protein Atlas (https://www.proteinatlas.org), PubMed (https://www.ncbi.nlm.nih.gov/pubmed/), UniProt (https://www.uniprot.org/) and CellWhere (https://www.sys-myo.com/cellwhere/) databases. In total, we selected 43 bait proteins to expand our MS-microscopy reference database: centrosome (4), chromatin (1), endoplasmic reticulum (4), endosome (2), Golgi (2), lysosome (1), microtubule (4), mitochondrion (1), nuclear envelope (1), nucleolus (3), peroxisome (3), plasma membrane (4), actin filament (4), cell junction (2), focal adhesion (2), intermediate filament (3) and nucleoplasm (2) (Supplementary Table 1). The complete database now contains PPI information for 19 cellular compartments and three sub-organelle regions of mitochondria. We applied the upgraded version of MS-microscopy on the remaining 139 bait proteins from the study by Go et al.26 and detected correct localization of 114 bait proteins (82%, 114/139) (Supplementary Table 2).
Additionally, we updated our MS-microscopy platform (http://proteomics.fi) to be more user friendly and effective in data analysis. It consists of four main modules: data input, SAINT analysis, data filtering and MS-microscopy visualization. These modules work independently to provide the input for the following modules or for other analyzing tools to facilitate the data analysis process.
Overview of the procedure
The procedure of our protocol is composed of three main parts (Fig. 1). The first part describes the cloning of a Gateway compatible sequence of the gene of interest into the MAC-tag destination vector (Steps 1−20), Flp-In T-REx 293 cell transfection, selection of stable cell line of the POI (Steps 21−46) and preparing cell pellets for purification (Steps 47−51). The second section of the protocol describes parallel AP and BioID protein purification with Strep-Tactin beads (Steps 52−60). Eluted proteins are digested to peptides (Steps 61−78) for MS analysis. The third part describes the MS method (Steps 79−81), data analysis (Steps 82−86), data filtering (Steps 87−91) and data visualization on the cellular level and sub-organelle level using the MS-microscopy platform (Steps 92−94).

Steps 1−51: via Gateway, cloning a PCR product of the gene of interest is MAC-tag tagged to generate an expression vector. Flp-In T-REx 293 cells are co-transfected with the MAC-tag tagged expression vector and pOG44 vector. Forty-eight hours after transfection, cells are transferred to a culture flask, and the next day selection medium is changed to select the positive clones. The stable cell line is expanded, and tetracycline is added for 24 h. For biotinylation labeling, extra biotin is added with tetracycline. Cells are washed and pipetted off the dishes with PBS-EDTA. Steps 52−78: cells with tetracycline treatment are used for AP–MS purification, whereas cells treated with tetracycline and biotin are used for BioID purification. For AP–MS, mild lysis buffer is used, and for BioID harsh lysis buffer, sonication and benzonase treatment are needed, before protein purification with Strep-Tactin column. Purifying proteins are eluted and then reduced, alkylated and digested to peptides, de-salted and vacuum dried. Steps 79−94: the reconstituted peptides are loaded from an autosampler for direct LC–MS/MS analysis. The RAW files generated by MS are uploaded into Proteome Discoverer for protein identification. The results are exported for SAINT scoring and CRAPome filtering. The PPIs obtained from previous filtering steps are subjected to the MS-microscopy platform to indicate the possible location of the POI. The output of the MS-microscopy can be visualized by polar plot and heat map.
Advantages of the approach
In contrast to another parallel AP–MS and BioID approach that uses the combined FLAG-BirA* tag10,21, our MAC-tag needs one binding matrix, Strep-Tactin, for both purification strategies. The binding affinity between the twin-strep-tagged POI and the Strep-Tactin (dissociation constant, ~10 nM)27,28 is about ten times higher than that of FLAG-tagged proteins with corresponding affinity matrixes (dissociation constant, 100 nM)29. Furthermore, the Strep-Tactin resin obtains a much higher protein binding capacity (mg of adsorbed protein per ml of resin, 3−9 mg/ml)27 comparing to the same amount of FLAG beads (0.6−1 mg/ml)30. This means that it is more efficient in extraction of the recombinant proteins and allows the lysate to be applied to packed resin in gravity flow columns, instead of a prolonged incubation (2−3 h) and rotation of lysate with beads.
There are methods26,31 that use statistic approaches to annotate prey localization based on the known localization information of bait protein or interacting proteins. Taking this a step further, we developed the MS-microscopy platform to predict the localization of the bait based on the quantitative information of its preys. Thus, it is possible to provide cellular localization and distribution information not only to wild-type protein but also to the mutated form.
Limitations
The MAC-tag workflow has limitations that should be considered during experimental design. First, the MAC-tag is of relatively large size because of BirA*, which is a 35.4-kDa protein6. Fusion of such a large tag with the POI can result in impaired protein localization and function. Even though we have not observed this complication based on our experience working with MAC-tag, it has been reported that, for example, not all of BirA*-tagged lamina-associated polypeptide 2β can localize to the nuclear envelope32. Additionally, BioID has very slow kinetics, which necessitates labeling with extra biotin for 16−18 h to produce sufficient biotinylated material for proteomic analysis6. Along with its large size and low activity, BirA* contains a DNA binding domain, which can complicate the analysis of chromatin-associated bait proteins33. Therefore, alternative versions of BioID, such as BioID2 from Aquifex aeolicus (26.6 kDa)34 and miniTurbo ID (28 kDa)35, have smaller sizes with improved labeling efficiency. However, they tend to be very sensitive and are able to use the trace amounts of biotin found in normal cell culture media. We expect that, if the BirA* in our MAC-tag would be replaced with BioiD2 or miniTurbo ID, proximal proteins would also be biotinylated without the addition of exogenous biotin. As a result, proximal proteins would be purified using the AP–MS pipeline and incorrectly annotated as direct binding partners of the bait protein. It is possible that free biotin in fetal bovine serum (FBS) and culture media can be depleted with streptactin sepharose36 to prevent constitutive biotinylation. This will be helpful for future extension of the MAC-tag approach to BioID2 and miniTurboID for improved temporal resolution. However, biotin deficiency in culture condition could lead to potential abnormalities of the cells37. Moreover, miniTurboID-tag expression is very low, or the tag is very unstable35,38.
Another limitation lies in the current status of the MS-microscopy database. The MS-microscopy platform is sensitive enough to provide global localization information of the POI. However, the interactome mapped by the platform currently reflects interactions that occur over a 24-h period, during which the cell will progress through stages of the cell cycle. It is necessary to apply complementary reference information for organelles that appear in specific stages of the cell cycle—for example, for primary cilia that can be promoted by serum starvation, the BioID-generated distinct interactome of the primary cilium can be applied.39. Similar strategies might be applied to other complex structures. As part of our ongoing improvement of the MS-microscopy platform, we will continue to update the reference database to comprehensively cover different organelles and sub-organelle regions.
Level of expertise needed to implement the protocol
The protocol detailed here provides enough information to allow other biologists, biochemists and scientists to repeat the whole workflow. However, there are various types of mass spectrometers in different labs and core facilities. To keep the instrument running at peak performance, an MS expert should be consulted to help with setting up instrumentation and subsequent data analysis.
Experimental design
Cloning the MAC-fusion construct
The experimental design begins with obtaining the entry clone for the gene of interest. The international ORFeome Collaboration provides sequence-validated, full-length human protein coding sequence clones in Gateway compatible vectors. These vectors can be obtained from several commercial vendors (information can be found at http://www.orfeomecollaboration.org). Alternatively, you can create the entry clone containing the gene of interest by using two-step PCR, TOPO cloning and restriction cloning. The location of the MAC-tag (N- or C-terminal) relative to the POI should avoid the terminus containing signal sequences that are removed in the mature protein, and post-translation modification sites that could be blocked by tag.
Generating cell lines
Stable cell lines generated from Flp-In T-REx 293 cells are suitable for most projects, especially for uncharacterized proteins. However, the cell line should be chosen based on the activity of the POI and purpose of the experiment to represent the targeting system, express the necessary cofactors and respond to signaling specific to the cellular pathway in question. Considering that certain cell lines (eg, Flp-In 3T3 cell line) tend to downregulate the cytomegalovirus (CMV) promoter40, a MAC-tag plasmid containing the EF1a promotor is also available from the corresponding author upon request. In most cases, a cell line expressing MAC-tagged green fluorescent protein (GFP) (or the empty MAC-tag) can serve as a negative control for discriminating true interactors of the POI from nonspecific proteins. Depending on the biological question, it might also be advisable to include compartment-specific controls, such as a cell line expressing MAC-GPF with a nuclear localization sequence, MAC-GFP with a myristoylated membrane targeting sequence or MAC-GFP with nuclear export sequence.
Controls and data analysis
Multiple biological and/or technical replicates are required to ensure more precise and comprehensive assessment of biologically relevant interaction. We recommend performing at least three biological replicates41 or two biological replicates with two technical replicates for each5, depending on the availability of instrument time. For quality control and data filtering, multiple negative control analysis (we recommend using eight or more replicates) should be used. Additionally, the PPI data that have been generated with other affinity purification or proximity labeling workflows than the MAC-tag workflow can be subjected to our MS-microscopy platform to obtain the localization information of POI9.
Materials
Biological materials
Flp-In T-REx 293 cells (Thermo Fisher Scientific, cat. no. R78007. RRID: CVCL_U427)
Critical
The Flp-In T-REx cell lines, developed by Life Technologies, contain a single integrated Flp recombination target site or/and expresses the Tet repressor. Several Flp-In T-REx cell lines are commercially available from Thermo Fisher. We chose the Flp-In T-REx 293 cell line in this protocol to generate the isogenic, tetracycline-inducible stable cell line of the gene of interest by co-transfecting the MAC-tagged gene of interest destination vector and the Flp recombinase expression plasmid, pOG44.
Caution
The cell lines used in research should be regularly checked to ensure that they are authentic and not infected with mycoplasma.
Reagents
-
LB broth (Life Technologies, cat. no. 10855021)
-
LB agar (Life Technologies, cat. no. 22700025)
-
Ampicillin (ICN, cat. no. 190148)
-
Kanamycin (Sigma-Aldrich, cat. no. K4000)
-
Gateway BP Clonase Enzyme Mix (Life Technologies, cat. no. 11789021)
-
Gateway LR Clonase Enzyme Mix (Life Technologies, cat. no. 11791043)
-
S.O.C. Medium (Life Technologies, cat. no. 15544034)
-
Glycerol (VWR, cat. no. 24388.295)
-
PBS (Life Technologies, cat. no. 14190169)
-
DMEM (Life Technologies, cat. no. 41965062)
-
Fetal bovine serum (FBS; Life Technologies, cat. no. 10270106)
-
Glutamax (Life Technologies, cat. no. 35050061)
-
Penicillin–streptomycin (Life Technologies, cat. no. 15140130)
-
Sodium pyruvate (Life Technologies, cat. no. 11360070)
-
HELIX-IN Transfection Reagent (OZ Biosciences, cat. no. HX10500)
-
FuGENE 6 Transfection Reagent (Promega, cat. no. E2691)
-
Hygromycin B (Life Technologies, cat. no. 10687010)
-
Paraformaldehyde solution (PFA; 4% (vol/vol); Thermo Fisher Scientific, cat. no. AAJ19943K2)
Caution
PFA is toxic. Use personal protective equipment (PPE). Buffers should be handled in a fume hood owing to the risk of toxic emissions.
-
Dulbecco’s phosphate-buffered saline (DPBS; Lonza, cat. no. 17-512F)
-
Trypsin-EDTA (0.25% (wt/vol); Thermo Fisher Scientific, cat. no. 25200056)
-
Bovine serum albumin solution (BSA; 30% in DPBS (vol/vol); Sigma-Aldrich, cat. no. A9576-50ML)
-
Laemmli sample buffer 2× (Bio-Rad, cat. no. 161-0737)
-
Precision Plus Protein Dual Color Standards (Bio-Rad, cat. no. 1610374)
-
Mini-PROTEAN TGX precast gels (Any kD precast with 10-comb; Bio-Rad, cat. no. 4569033)
-
Nitrocellulose membrane (Precut, 0.2 µm; Bio-Rad, cat. no. 1620146)
-
Blot Absorbent Filter Paper (Precut; Bio-Rad, cat. no. 1703966)
-
10× Tris/CAPS Buffer for Semi-Dry Blotting (Bio-Rad, cat. no. 1610778)
-
DAPI, 4’,6-diamidino-2-phenylindole, dihydrochloride (Thermo Fisher Scientific, cat. no. 62248)
-
Tris-Buffered Saline with Tween 20 (TBST; Bio-Rad, cat. no. BUF028)
-
Sequencing-Grade Trypsin (Promega, cat. no. V5113)
-
Dimethyl sulfoxide (DMSO; Sigma-Aldrich, cat. no. 472301-100ML)
Caution
DMSO is known to facilitate the entry of organic molecules into tissues. Handle reagents containing DMSO using equipment and practices appropriate for the hazards posed by such materials.
-
Magnesium chloride (MgCl2; 1 M; Sigma-Aldrich, cat. no. M1028)
-
Calcium chloride (CaCl2; 1 M; Sigma-Aldrich, cat. no. 21115)
-
Liquid nitrogen
Caution
Liquid nitrogen causes burns; use eye and skin protection.
-
HEPES buffer pH8.0 (ITW, cat. no. A69060250)
-
Strep-Tactin Sepharose 50% (vol/vol) suspension (IBA Life Sciences, cat. no. 2-1201-010)
-
Bio-Spin Chromatography Columns (Bio-Rad, cat. no. 732-6008)
-
Ethylenediaminetetraacetic acid disodium salt (EDTA; Chemsupply, cat. no. 9326410003617)
-
Phenylmethanesulfonyl fluoride (PMSF; Sigma-Aldrich, cat. no. P7626)
Caution
PMSF powder is hazardous. Use eye and skin protection when preparing PMSF solutions.
-
4-(2-aminoethyl)-benzenesulfonyl fluoride (Sigma-Aldrich, cat. no. A8456)
-
Protease inhibitor cocktail (Sigma-Aldrich, cat. no. P8340)
-
Sodium chloride (NaCl; ≥99.8% purity; Sigma-Aldrich, cat. no. 31434-5KG-R)
-
Sodium fluoride (NaF; ≥99% purity; Sigma-Aldrich, cat. no. S7920-500G)
Caution
NaF powder is hazardous. Use skin and eye protection when preparing NaF solutions.
-
Methanol (CH3OH; Sigma-Aldrich, cat. no. 1.06018)
Caution
Methanol is toxic. Use PPE. Buffers should be prepared in a fume hood owing to the risk of toxic emissions.
-
DL-dithiothreitol (DTT; Sigma-Aldrich, cat. no. D9779)
Caution
DTT is toxic. Use PPE. Buffers should be prepared in a fume hood owing to the risk of toxic emissions.
-
N-dodecyl-β-d-maltoside (DDM; Sigma-Aldrich, cat. no. D4641-5G)
-
Igepal CA-630 (Sigma-Aldrich, cat. no. I8896-50ML)
-
Sodium dodecyl sulfate (SDS; Sigma-Aldrich, cat. no. L5750)
-
Benzonase Nuclease (Santa Cruz Biotechnology; cat. no. sc-202391)
-
Tetracycline hydrochloride (Sigma-Aldrich, cat. no. T3383-25G)
-
Biotin (Thermo Fisher Scientific, cat. no. 29129)
-
Ethanol (ETAX Aa, 99.5% purity; Altia oy)
-
n-Dodecyl-β-d-maltoside (Thermo Fisher Scientific, cat. no. 89903)
-
Tris-EDTA Buffer Solution (TE Buffer; Sigma-Aldrich, ref. 93283)
-
Igepal CA-630 (Sigma-Aldrich, cat. no. I8896)
Caution
IGEPAL CA-630 is toxic. Use skin and eye protection when handling it.
-
Tris (2-carboxyethyl) phosphine hydrochloride (TCEP; Sigma-Aldrich, cat. no. C4706-2G)
-
Pierce 660-nm Protein Assay Kit (Thermo Fisher Scientific, cat. no. 22662)
-
Formic acid (FA, LC–MS Ultra, >98% purity; Sigma-Aldrich, cat. no. 14265-1ML)
Caution
FA is corrosive. Use PPE. Buffers should be prepared in a fume hood owing to the risk of toxic emissions.
-
Water, Optima LC/MS-grade 4L (Thermo Fisher Scientific, cat. no. FSBW6-4)
-
Acetonitrile, Optima LC/MS-grade (Thermo Fisher Scientific, cat. no. FSBA955-4)
-
Trifluoroacetic acid (TFA; sequencing grade, 10× 1 ml; Thermo Fisher Scientific, cat. no. PIE28904)
Caution
TFA is corrosive. Use appropriate PPE. Buffers should be prepared in a fume hood owing to the risk of toxic emissions.
Critical
The 1-ml ampules allow buffers to be freshly prepared and minimize accumulation of contaminants in TFA that can interfere with the analysis.
-
Ethanol solution (70% (vol/vol); Thermo Fisher Scientific, cat. no. BP82014)
-
Hydrochloric acid (HCl; 1 M; Merck, cat. no. 1090572500)
Caution
HCl is corrosive. Use PPE. Buffers should be prepared in a fume hood owing to the risk of toxic emissions.
-
Sodium hydroxide solution (NaOH; 1 M; Merck, cat. no. 1091372500)
Caution
NaOH is corrosive. Use skin and eye protection when handling it.
-
Ammonium bicarbonate (NH4HCO3; Sigma-Aldrich, cat. no. A6141)
Caution
NH4HCO3 solution is hazardous. Use skin, eye and nose protection when preparing NH4HCO3 solutions.
-
Iodoacetamide (IAA; Sigma-Aldrich, cat. no. I1149-25G)
-
Agarose I (Molecular Biology Grade) (Thermo Fisher Scientific, cat. no. 17850)
-
Tris Acetate-EDTA buffer 10 × (TAE; Sigma-Aldrich, cat. no. T9650)
-
Ethidium bromide solution (EtBr; 0.625 mg/ml; Thermo Fisher Scientific, cat. no. 17896)
Caution
EtBr is toxic. Use PPE. Buffers should be prepared in a fume hood owing to the risk of toxic emissions.
-
Deoxynucleotide (dNTP) Solution Mix (NEB, cat. no. N0447L)
-
NucleoSpin Plasmid EasyPure (Macheney-Nagel, cat. no. 740727.250)
-
1kb DNA Ladder (NEB, cat. no. N3232L)
-
PmeI (NEB, cat. no. R0560L)
-
CutSmart Buffer (BioLabs, cat. no. B72045S)
-
Phusion High-Fidelity DNA Polymerases (NEB, cat. no. M0530L)
-
ECL Western Blotting Detection Reagent (GE Healthcare, cat. no. RPN2209)
-
Antifade Mounting Medium (VECTASHIELD, cat. no. H-1000)
-
Pierce HeLa Protein Digest Standard (Thermo Fisher Scientific, cat. no. 88328)
Critical
We routinely use protein digest standard to ensure optimal performance of instruments.
-
Pierce LTQ ESI Positive Ion Calibration Solution (Thermo Fisher Scientific, cat. no. 88323)
Critical
We routinely use Calibration Solution to calibrate the QExactive mass spectrometer.
-
Rely+On Virkon (Lanxess, cat. no. 5 ×10-g package)
Antibodies
-
Anti-HA Tag Antibody (BioLegend, cat. no. PRB-101C; RRID: AB_2565437)
-
Goat anti-mouse IgG (H+L) Highly Cross-Adsorbed Secondary Antibody (Alexa Fluor Plus 488 Thermo Fisher Scientific, cat. no. A32723; RRID: AB_2633275)
-
Streptavidin, Alexa Fluor 594 conjugate (Thermo Fisher Scientific, cat. no. S11227; RRID: AB_2833236)
-
Streptavidin, HRP conjugate (Thermo Fisher Scientific, cat. no. N100; RRID: AB_2833235)
-
Anti-Alpha Tubulin Monoclonal Antibody (Abcam, cat. no. ab184613; RRID: AB_2688039)
-
Goat anti-mouse IgG H&L (HRP) (Abcam, cat. no. 97023; RRID: AB_10679675)
Plasmids and primers
-
pOG44 Flp-Recombinase Expression Vector (Life Technologies, cat. no. V600520)
-
Gateway pDONR221 (Thermo Fisher Scientific, cat. 12536017)
-
MAC-tag-N destination vector (Addgene, plasmid no. 108078; RRID: Addgene_108078)
-
MAC-tag-C destination vector (Addgene, plasmid no. 108077; RRID: Addgene_108077)
-
MAC-GFP (Addgene, plasmid no. 139636; RRID: Addgene_139636)
-
Entry clone for the gene of interest (see ‘Experimental design’ section)
Critical
All entry clone DNA should be verified by sequencing. The authors recently made a collection of MAC-tagged Covid-19 plasmids available for the community to help fight the ongoing coronavirus pandemic. These include all 29 SARS-CoV-2 ORFs and 5 known host receptors (https://www.addgene.org/browse/article/28211772/; plasmid ID numbers: 158352–158386).
-
Primers for amplification of the gene of interest (see ‘Reagent setup’ section)
-
Universal attB1 adapter primer: 5’-GGGG ACA AGT TTG TAC AAA AAA GCA GGC T-3’
-
Universal attB2 adapter primer: 5’-GGGG AC CAC TTT GTA CAA GAA AGC TGG GT-3’
Equipment
-
1.5-ml tubes (Eppendorf, cat. no. 0030125150)
-
2-ml tubes (Eppendorf, cat. no. 0030120094)
-
15-ml screw-cap tubes (Falcon, cat. no. 352095)
-
50-ml screw-cap tubes (Falcon, cat. no. 352070)
-
14-ml snap-cap tubes (Falcon, cat. no. 352059)
-
Sterile pipettes (2, 5, 10, 25 and 50 ml; Corning, cat. nos. 4486, 4487, 4488, 4489 and 4490)
-
Pipette controller (Biohit Sartorius, cat. no. 14018436)
-
Nanodrop (Thermo Fisher Scientific, NanoDrop 2000 Spectrophotometer, model no. 0925)
-
Vortex mixer (Scientific Industries, Vortex-Genie 2, model no. G560E)
-
Cell culture hood (KOJAIR, BioWizard Standard Std-130, Class II, model no. 024586)
-
Cell culture incubator (set at 37 °C and 5% CO2)
-
Cell culture dishes (150 mm; Corning, cat. no. 430599)
-
Cell culture flask (550 ml; Greiner Bio-one, 175 cm2, cat. no. 660160)
-
Centrifuge (Eppendorf, Centrifuge 5804R, model no. 5805)
-
Heating block (Eppendorf, Thermomixer comfort, model no. 5355)
-
Sonicator water bath (BRANSON, Ultrasonic Cleaner B-52)
-
PCR machine (Eppendorf Mastercycler Nexus Gradient, cat. no. 6331)
-
Water bath (Grant, cat. no. W14)
-
Sterile cryogenic storage vials (ie, cryovials)
-
Liquid nitrogen storage container
-
A big tray that can fit a layer of ice and five 15-cm dishes
-
Bio-Spin Chromatography Columns (Bio Rad, cat. no. 732-6008, bed height 3.7 cm, overall length 5 cm, bed volume 1.2 ml)
-
E/C Protective End Cap (Bio Rad, cat. no. 731-1660)
-
Optifit Pipette Wide Bore Tip (Sartorius, cat. no. 791020)
-
Column racks (Rockbourne Scientific)
-
Eppendorf LoBind tube (2 ml, Eppendorf, cat. no. Z666513)
-
MicroSpin Column (The Nest Group, cat. no. SEMSS18V)
-
Q Exactive Hybrid Quadrupole-Orbitrap Mass Spectrometer (Thermo Fisher Scientific, cat. no. IQLAAEGAAPFALGMAZR)
Critical
Mass spectrometers with high-mass-accuracy analyzers are preferred over the use of low-mass-accuracy analyzers, such as ion traps, for both MS and MS/MS. High mass accuracy can improve the reliability of peptide sequence identification in Orbitrap Fusion instruments.
-
C18 column: 4.6-mm internal diameter × 50- or 100-mm-long reversed-phase C18 end-capped HPLC column (Chromolith Speed Rod; Merck, cat. nos. 1514500001 and 1021290001)
-
EASY-nLC 1000 liquid chromatograph (Thermo Fisher Scientific, cat. no. LC120)
Critical
A high resolving power of the liquid chromatography (LC) setup is critical for separating the complex peptide preparations.
-
Windows PC (Windows 7, 32 GB of RAM, 16 cores and a 1-TB hard drive)
-
Autosampler vials for MS (Thermo Fisher Scientific, cat. no. THC160134)
-
pH paper (Merck, pH-indicator paper pH 1-14, cat.no. 1.10962.0003)
-
Centrifugal vacuum evaporator (Eppendorf, Concentrator Plus, cat. no. 53050000100)
-
Inverted microscope (Nikon Eclipse Ts2 Inverted Microscope, M700E)
-
Fluorescence microscope (Leica, Leica TCS SP8 STED)
-
Image system for agarose gel (Syngene Bio Imaging, InGenius)
-
Image system for western blot (Fuji, cat. no. LAS-3000)
-
Horizontal electrophoresis (Bio-Rad, cat. no. 1704467EDU)
-
Sub-Cell GT Cell (Bio-Rad, cat. no. 170-4401)
-
Semi-dry transfer cell (Bio-Rad, cat. no. 1703940)
-
Power supply system (Carl Roth, cat. no. EV202)
-
Orbit Shaker (IKA, cat. no. KS250)
-
Polylysine-coated glass-bottom dishes (Cellvis, cat. no. D29-10-0-N)
Software
-
A web browser with Internet access
-
Software for LC−MS/MS data analysis. There are varieties of software available to interpret the large-scale data acquired from high-resolution mass spectrometers, which ranges from commercial software to open-source algorithms in varying stages of development (including MASCOT, SEQUEST, Maxquant and Protein Pilot). Here we use the SEQUEST algorithm supported by Proteome Discoverer (version 1.4; https://omictools.com/proteome-discoverer-tool).
-
An image processing package, Fiji (https://imagej.net/Fiji)
-
Software for assigning confidence scores, Significance Analysis of INTeractome (SAINT) (http://saint-apms.sourceforge.net/)
-
Contaminant Repository for Affinity Purification, CRAPome (http://crapome.org/)
-
The database of protein sequence and functional information, UniProt (https://www.uniprot.org/)
-
Microsoft Office package for data visualization and .txt file editing (https://www.microsoft.com/en-us/microsoft-365)
-
The database of antibodies based protein profiling in cells, Protein Atlas (https://www.proteinatlas.org/)
-
The database of protein subcellular localizations (https://sys-myo.com/cellwhere/)
Reagent setup
Primers for amplification of the gene of interest
The attB1 and attB2 sequences have to be added to the PCR forward and reverse primers, respectively, resulting in primer sequences as shown below:
-attB1Forward: 5’- AA AAA GCA GGC TCC ACC (10–20 bp template sequence specific bases)-3′
-attB2Reverse: 5’- A GAA AGC TGG GTC (10–20 bp template sequence specific bases)-3′
Critical
A minimal Kozak sequence (ACC) should be added to the forward primer
Critical
Design the reverse primer to remove the native stop codon when the ORF is connected to a C-terminal MAC-tag.
Agar plates
For 1% (wt/vol) LB agar, add 1 g of agar to 100 ml of LB broth. Boil well in a microwave with the lid loose. Swirl between each boiling. Continue until particles of agar are completely dissolved. Place bottle in a water bath at 46 °C and incubate for 15 min. When 1% agar/LB has reached 46 °C, add ampicillin (Amp, 50−100 μg/ml final) or kanamycin (Kana, 30 μg/ml final). Immediately swirl to mix. Pour onto plates in laminar flow and make sure the LB solution covers the surface with a quick swirl of the plate (15 ml per plate). Leave with lid off in laminar to dry while cooling and setting. Store at 4 °C and use within 1 month.
Complete cell culture medium
Cell culture medium is 450 ml of DMEM supplemented with 10% (vol/vol) FBS (50 ml), 100× Glumax (5 ml) and 100× penicillin–streptomycin (5 ml). Store at 4 °C for up to 6 months
Critical
The Flp-In T-REx 293 cell line can be maintained in culture medium containing zeocin (100 μg/ml) and blasticidin (5 μg/ml). However, cells expand slowly when grown in medium supplemented with zeocin and blasticidin. When recovering a frozen cell line, we recommend using these antibiotics after cells have attached to the culture flask and been in culture for 4–5 d.
Hygromycin B selection medium
It is recommended to test the sensitivity of the original Flp-In T-REx 293 cell line to hygromycin B to determine the hygromycin B concentration that should be used for selection after transfection. We generally use 100 μg/ml of hygromycin B to select for the integration of the MAC-tag expression vector. Medium containing hygromycin B should be prepared freshly before use.
IF blocking buffer
To prepare 1.5% (wt/vol) BSA in DPBS, dilute 1 ml of 30% (wt/vol) BSA in DPBS to 20 ml with 1× DPBS. Store at 4 °C for up to 1 month.
Triton X-100, 0.1% (vol/vol)
Warm the Triton X-100 in a water bath at 40 °C. Take 500 μl of warm Triton X-100 and add to 500 ml of distilled water on a plate stirrer. Stir continuously for 1 h at room temperature (RT) or until all Triton X-100 is dissolved. Store at RT (15−25°C) for up to 1 month.
WB blocking buffer
To prepare 3% (wt/vol) BSA in TBST, dilute 10 ml of 30% (wt/vol) BSA in TBST to 100 ml with 1× TBST. Store at 4 °C for up to 1 month.
ECL solution
Mix 1 ml of solution A with 1 ml of solution B. Evenly spread this mix on the membrane and incubate for 2 min. The solution should be prepared freshly before use.
Freezing medium
Freezing medium is cell culture medium with 20% (vol/vol) FBS and 10% (vol/vol) DMSO. Add 1 ml of FBS and 1 ml of DMSO into 8 ml of complete culture medium. Freeze medium should be prepared freshly before use.
Tetracycline, 2 mg/ml (wt/vol)
To prepare 1 ml of 2 mg/ml tetracycline, dissolve 2 mg of tetracycline in 1 ml of 70% (vol/vol) ethanol
Critical
Store at −20 °C protected from light for up to 2 months and aliquot into small volumes to avoid multiple freeze–thaw cycles.
Biotin, 200 mM, pH 8.0
To prepare 1 ml of 200 mM biotin solution, dissolve 0.04886 g of biotin powder in 1 ml of 100 mM HEPES (pH 8.0)
Critical
Aliquot into small volumes and store at −20 °C protected from light for up to 2 months.
AP–MS induction media
To prepare a 100-ml AP–MS induction media with a concentration of 8 mg/ml tetracycline, add 400 ml of tetracycline (2 mg/ml) into 100 ml of complete cell culture medium. Freshly prepare the solution just before use.
BioID induction media
To prepare 100 ml of BioID induction media with a concentration of 8 mg/ml tetracycline and 200 mM biotin, add 400 μl of tetracycline (2 mg/ml) and 100 μl of biotin stock (200 mM) into 100 ml of complete cell culture medium. Freshly prepare the solution just before use.
EDTA, 0.5 M, pH 8.0
To prepare 25 ml of 0.5 M EDTA, pH 8, dissolve 3.65 g of EDTA in water to a final volume of 25 ml, adjust the pH to 8.0 with KOH (otherwise, the EDTA will not dissolve), filter-sterilize or autoclave and store at 4 °C for up to 6 months.
PBS-EDTA, 1 mM
To prepare 500 ml of 1 mM PBS-EDTA, add 1 ml of 0.5 M EDTA to 500 ml of PBS. Store at 4 °C for up to 6 months
PBS-(MgCl2 + CaCl2), 0.1 mM
To prepare 0.1 mM PBS-(MgCl2 + CaCl2), add 100 μl of 1 M MgCl2 and 100 μl of 1M CaCl2 to 1 L of PBS. Store at 4 °C for up to 6 months
PMSF, 100 mM
To prepare 100 mM PMSF, dissolve 435 mg of PMSF in methanol to a final volume of 25 ml. Store at −20 °C for up to 3 months.
Na3VO4, 500 mM, pH 10
To prepare a 100-ml stock solution of 500 mM Na3VO4, add 9.2 g of Na3VO4 to 90 ml of water and dissolve by stirring. Once dissolved, bring the volume to 100 ml. Adjust the pH to 10 using 1 M NaOH or 1 M HCl. (At a pH of 10, the solution should be yellow.) Boil until the solution clears. Cool to RT. Readjust the pH to 10 and repeat as necessary until the solution remains clear at pH 10. Store in aliquots at −20 °C for up to 1 year.
NaCl, 3 M
To prepare 100 ml of 3 M NaCl, dissolve 17.5 g of NaCl in water to a final volume of 100 ml. Filter-sterilize and store at RT indefinitely.
Igepal CA-630, 20% (vol/vol)
Mix 20 ml of Igepal CA-630 with 80 ml of water by stirring and store at 4 °C indefinitely.
DTT, 1 M
To prepare 10 ml of DTT solution, dissolve 1.5 g of DTT in 8 ml of water. Adjust the total volume to 10 ml. The solution can be stored in aliquots at −20 °C for up to 1 year.
SDS, 20% (wt/vol)
To prepare 500 ml of 20% (wt/vol) SDS solution, dissolve 100 g of SDS in water to a final volume of 500 ml. Filter-sterilize and store at RT indefinitely.
HENN buffer
To prepare 1 L of HENN buffer, mix 2.0994 g of NaF, 30 ml of 3 M NaCl, 10 ml of 0.5 M EDTA (pH 8.0), 50 ml of 1 M HEPES (pH 8.0) and make up the final volume to 1 L with water. Filter-sterilize and store at 4 °C for up to 2 months.
AP–MS lysis buffer
To prepare 50 ml of AP–MS lysis buffer, mix 48 ml of HENN buffer, 1,250 µl of 20% (vol/vol) Igepal CA-630, 500 µl of 0.1 M PMSF, 150 µl of 500 mM Na3VO4, 50 µl of 1 M DTT and 50 µl of 1,000× protease inhibitor cocktail; the final composition is 0.5% (vol/vol) Igepal CA-630, 1 mM PMSF, 150 µl of 500 mM Na3VO4, 1 mM DTT and 1× protease inhibitor cocktail in HENN buffer. Prepare freshly before use and store on ice
Critical
The Igepal CA-630 is good for most lysis conditions. However, DDM performs slightly better for solubilizing and retaining the stability of membrane and hydrophobic proteins42. For these proteins, we recommend using DDM with a final concentration of 0.1–1 % (wt/vol), instead of Igepal CA-630.
BioID lysis buffer
To prepare 50 ml of BioID lysis buffer, mix 47.75 ml of HENN buffer, 250 µl of 20% (wt/vol) SDS, 1,250 µl of 20% (vol/vol) Igepal CA-630, 500 µl of 0.1 M PMSF, 150 µl of 500 mM Na3VO4, 50 µl of 1 M DTT and 50 µl of 1,000× protease inhibitor mix; the final composition is 0.1% (wt/vol) SDS, 0.5% (vol/vol) Igepal CA-630, 1 mM PMSF, 150 µl of 500 mM Na3VO4, 1 mM DTT and 1× protease inhibitor cocktail. Prepare freshly before use and store on ice
Critical
For membrane and hydrophobic proteins, we recommend using DDM with a final concentration of 0.1–1 % (wt/vol), instead of Igepal CA-630.
Pull-down wash buffer
To prepare 50 ml of wash buffer, mix 48 ml of HENN buffer, 1,250 µl of 20% (vol/vol) Igepal CA-630, 500 µl of 0.1 M PMSF, 150 µl of 500 mM Na3VO4, 50 µl of 1 M DTT and 50 µl of 1,000× protease inhibitor mix; the final composition is 0.5% (vol/vol) Igepel CA-630, 1 mM PMSF, 150 µl of 500 mM Na3VO4, 1 mM DTT and 1× protease inhibitor cocktail in HENN buffer. Prepare freshly before use and keep on ice.
Pull-down elution buffer
To prepare 10 ml of pull-down elution buffer, add 25 µl of 200 mM biotin stock solution into 10 ml of HENN buffer. Elution buffer should be prepared freshly just before use.
NH4HCO3, 200 mM
Add 0.16 g of NH4HCO3 to 10 ml of water. The solution can be stored at 4°C for up to 2 months.
TCEP, 50 mM
Add 0.143 g of TCEP into 10 ml of 200 mM of NH4HCO3, filter-sterilize and store at −20 °C for up to 1 year.
IAA, 100 mM
Add 0.184 g of IAA into 10 ml of water. Vortex to dissolve
Critical
IAA is unstable and light sensitive. To preserve activity of IAA, prepare the solutions immediately before use and perform the alkylation step in the dark.
C18 buffer A
Buffer A is 0.1% (vol/vol) TFA and 1% (vol/vol) acetonitrile (ACN) in water. The solution can be stored at RT for up to 1 month
Critical
All reagents must be HPLC or MS grade.
C18 wash buffer
C18 wash buffer is 0.1% (vol/vol) TFA and 5% (vol/vol) ACN in water. The solution can be stored at RT for up to 1 month
Critical
All reagents must be HPLC or MS grade.
C18 elution buffer
C18 elution buffer is 0.1% (vol/vol) TFA and 50% (vol/vol) ACN in water. The solution can be stored at RT for up to 1 month
Critical
All reagents must be HPLC or MS grade
Critical
The elution buffer used can be tailored to the downstream application. Acceptable buffer contains 0.1% (vol/vol) TFA and 50–70% (vol/vol) ACN. For ESI–MS analysis, replace TFA with 0.1% (vol/vol) FA for the best results.
LC buffer A
Buffer A is 0.1% (vol/vol) TFA, 1% (vol/vol) ACN and 1% (vol/vol) FA in water. The solution can be stored at RT for up to 1 month
Critical
All reagents must be HPLC or MS grade.
LC buffer B
Buffer B is 0.1% (vol/vol) TFA, 1% (vol/vol) water and 1% (vol/vol) FA in ACN. The solution can be stored at RT for up to 1 month
Critical
All reagents must be HPLC or MS grade.
Equipment setup
LC
Peptides are generally loaded onto a trap column using a microflow-loading pump at 5–15 μl/min with 0.1% (vol/vol) FA or TFA in water or 2% (vol/vol) ACN. Owing to usually low amounts of peptide material, nano-LC is preferred over microflow-LC for eluting peptides from a trapping column coupled with an analytical column. Typical gradients elute peptides over 60 or 90 min, ramping from 2 to 25–40% (vol/vol). LC buffer B in LC buffer A is introduced directly into the mass spectrometer using a nanospray source at typical flow rates of 300 nl/min.
Mass spectrometer
Suggested settings for a Thermo Scientific Q-Exactive mass spectrometer5,8 are detailed as follows:
Parameter | Setting |
|---|---|
Spray voltage | 2.5−3 V |
Capillary temperature | 275 °C |
Sheath Gas | 0 |
Full-scan MS range | 200–2,000 m/z |
S-Lens RF level | 60 |
Ion source | Nanospray Flex Ion Sources |
MS1 resolution | 70,000 |
AGC target | 1× 10⁶ |
Maximum injection time | 100 ms |
Scan range | 200–2,000 m/z |
Precursors selected for MS/MS | Top 10 per cycle |
MS/MS resolution | 175,000 |
MS/MS AGC target | 5 × 10⁴ |
Isolation window | 2.0 m/z |
Scan range | 200–2,000 m/z |
Fixed first mass | 120.0 m/z |
Spectrum data type | Centroid |
Dynamic exclusion | 30 s |
Procedure
Generation of MAC-tagged gene of interest using Gateway destination vectors
Timing ~ 2−3 d
Critical
Gateway vectors contain modified versions of the att recombination sites and allow rapid transfer of the desired DNA sequence into the expression vector. We describe here the two-step PCR method that is routinely used in our lab to generate the PCR product that contains attB sites. The PCR steps can be performed with any commercial high-fidelity DNA polymerase.
-
1
First PCR (Steps 1 and 2): Mix the following components in a 100-µl PCR tube:
Component
Volume (μl)
Final concentration
DNA templatea
1.5
—
attB1Forward (5 pmol/μl) (see Reagent Setup)
1.5
0.5 pmol/μl
attB2Reverse (5 pmol/μl) (see Reagent Setup)
1.5
0.5 pmol/μl
dNTP mix (2 mM each dATP, dCTP, dGTP, dTTP)
0.3
0.04 mM
5× Phusion HF or GC Buffer
3
1×
Phusion High-Fidelity DNA Polymerase (2.5 U/μl)
0.3
0.75 U
Double-distilled water
6.9
—
Final volume
15
Critical step
Adding 1% (vol/vol) DMSO to the PCR reaction can improve PCR results in cases where template is GC rich or a vector.
-
2
Incubate the samples in a thermal cycler using the following cycling conditions:
Cycle
Denature
Anneal
Extend
1
98 °C, 30 s
2−6
98 °C, 20 s
55 °C, 15 s
72 °C, 1 mina
7−21b
98 °C, 20 s
60 °C, 15 s
72 °C, 1 mina
22
72 °C, 1 min
Critical step
A water-only negative control reaction should be run to test for possible reagent contamination.
Pause point
The PCR product can be stored at −20 °C indefinitely.
-
3
Second PCR (Steps 3 and 4): Mix the following components in a 100-µl PCR tube:
Component
Volume (μl)
Final concentration
DNA template (products of step I PCR)
2
—
attB1 adapter primer (2.5 pmol/μl)
2
0.25 pmol/μl
attB2 adapter primer (2.5 pmol/μl)
2
0.25 pmol/μl
dNTP mix (2 mM each dATP, dCTP, dGTP, dTTP)
0.4
0.04 mM
5× Phusion HF or GC Buffer
4
1×
Phusion High-Fidelity DNA Polymerase (2.5 U/μl)
0.4
1U
Double-distilled watera
9.2
—
Final volume
20
-
4
Incubate the samples in a thermal cycler using the following cycling conditions:
Cycle
Denature
Anneal
Extend
1
98 °C, 30 s
2−6
98 °C, 20 s
55 °C, 15 s
72 °C, 1 mina
7−21b
98 °C, 20 s
60 °C, 15 s
72 °C, 1 mina
22
72 °C, 1 min
Pause point
The PCR product can be stored at −20 °C indefinitely.
-
5
Analyzing PCR products on agarose gel. After the second PCR reaction, visualize the amplified DNA fragment on a 1% (wt/vol) agarose gel with a final concentration of 0.05 µg/ml (wt/vol) of EtBr using agarose electrophoresis. See Fig. 2a for an example gel where we amplified LONP1 (BC000235) as described in Steps 1−5.
Fig. 2: Verification of clones expressing a MAC-tagged POI. 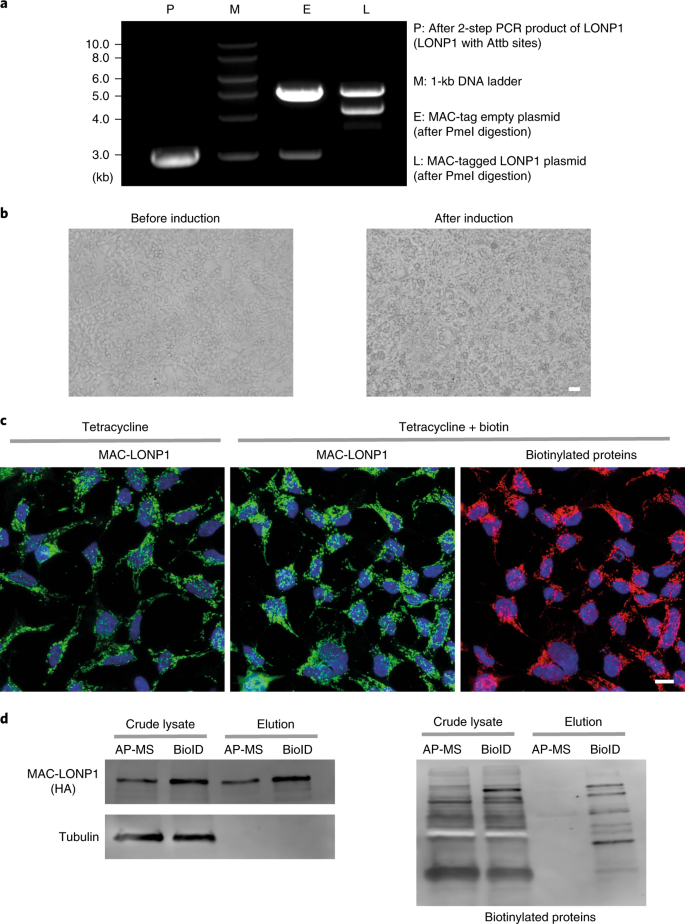
a, The PCR product and PmeI digested plasmids were run on an agarose gel to verify that the vector backbone and insert are of the expected size. DNA ladder: 1 kb. b, HEK293 cells expressing MAC-tagged LONP1 were visualized by fluorescence microscopy, at the time points of before induction (left) and 24 h after tetracycline induction (right). Scale bar, 20 μm. c, Stable expression of MAC-tagged LONP1 in HEK293 cells. The POI was visualized by immunofluorescence staining using anti-HA primary and Alexa Fluor 488 secondary antibodies (green), in vivo biotinylated interactors were labeled with Alexa Fluor 594 streptavidin (red) and DNA with DAPI (blue). Scale bar, 10 μm. d, MAC-tagged LONP1 detected by western blot analysis with anti-HA antibodies. Tubulin was detected only in crude lysate and was washed away in the purified samples. Biotinylated proteins, including both exogenous and endogenous proteins, were detected with HRP-streptavidin.
-
6
BP reaction. Set up the following reaction mixture:
Component
Volume (μl)
attB-PCR product (≥10 ng/µl; final amount, ~15-150 ng)
5
Donor vector pDONR 221 (150 ng/µl)
1
BP Clonase II enzyme mix (Thermo Fisher)
2
TE buffer, pH 8.0
2
Final volume
10
-
7
Incubate the mixture for at least 4 h at 25 °C. Depending on the reaction efficiency, the incubation time can be extended up to 24 h.
-
8
Transformation. Thaw OmniMAX competent E. coli cells on ice. Add 5 µl of each BP reaction into 25 µl of OmniMAX competent E.coli (Thermo Fisher Scientific, cat. no. C854003) and incubate on ice for 30 min. Heat-shock the cells by incubating at 42 °C for 45 s and immediately place the cells on ice for 2−3 min. Add 250 µl of S.O.C. Medium and incubate at 37 °C for 1 h with shaking at 250 r.p.m. Plate 150 µl of the transformation mixture onto a LB+Kana plate and incubate at 37 °C overnight.
Critical step
An efficient BP recombination reaction will produce more than 500 colonies if 50% of the BP reaction is transformed and plated.
-
9
Pick 1 colony into 14 ml-tubes containing 5 ml LB/Kana and grow in a shaking incubator (220−250 r.p.m.) at 37 °C for 16−20 h.
-
10
Prepare glycerol stocks from the overnight cultures as follows. Take 500 μl of the overnight culture to 500 μl of 50% (vol/vol) glycerol in a 2-ml tube, gently mix and store at −20 or −70 °C.
Pause point
The glycerol stocks can be stored indefinitely at −70 °C and for about 1 year at −20 °C.
-
11
Use the remaining overnight culture to isolate the plasmid DNA using a MiniPrep plasmid purification kit according to the manufacturer’s instructions.
Pause point
The plasmid preps can be stored at −20 °C indefinitely.
-
12
LR reaction (Steps 12 and 13): Set up the following reaction in a 1.5-ml microcentrifuge tube at RT.
Component
Volume (μl)
MAC-tag-N/C destination vector (150 ng/µl)a
1
Entry clone (300 ng/µl)a
1
LR Clonase II enzyme mix (Thermo Fisher)b
1
TE buffer, pH 8.0
2
Final volume
5
-
13
Incubate for at least 1 h at 25 °C. Depending on the reaction efficiency, the incubation time can be extended up to 24 h.
-
14
Transformation. Thaw OmniMAX competent E. coli cells on ice. Add all of the LR reaction (5 µl) to 25 µl of OmniMAX competent E.coli and incubate on ice for 30 min. Heat-shock the cells by incubating at 42 °C for 45 s and immediately place the cells on ice for 2−3 min. Add 250 µl of S.O.C. Medium and incubate at 37 °C for 1 h with shaking at 220 r.p.m. Plate 150 µl of transformation onto a LB+ampicillin plate and allow to grow at 37 °C for 12−16 h until colonies appear.
Critical step
An efficient LR recombination reaction will produce more than 1,000 colonies if half LR reaction is transformed and plated.
Pause point
The remaining (unplated) transformation can be stored at 4 °C for up to 4 d.
-
15
Pick 1 colony into 14-ml tubes containing 5 ml of LB/ampicillin and grow them in a shaking incubator (220−250 r.p.m.) at 37 °C for 16−20 h.
-
16
Prepare glycerol stocks from the overnight cultures as follows. Take 500 μl of the overnight culture and combine with 500 μl of 50% (vol/vol) glycerol in a 2-ml tube, gently mix and store at −20 or −70 °C.
Pause point
The glycerol stocks can be stored indefinitely at −70 °C and for about 1 year at −20 °C.
Pause point
The rest of the overnight culture can be pelleted and stored at −20 °C for up to 3 months.
-
17
Use the rest of the overnight culture to isolate the plasmid DNA using a MiniPrep plasmid purification kit according to the manufacturer’s instructions.
Pause point
The plasmid preps can be stored at −20 °C indefinitely.
-
18
Screen colonies with PmeI restriction digest (Steps 18−20): Digest the isolated plasmid DNA by setting up the following reaction mixture in a 1.5-ml tube.
Component
Volume (μl)
Final concentration
DNA plasmida
1
250 μg DNA
PmeI enzyme (20 U/μl)b
0.3
6 U
10× CutSmart buffer
1
1×
Double-distilled water
7.7
—
Final volume
10
-
19
Incubate the mixture at 37 °C for 1 h, either in a heating block or in an incubator.
-
20
Visualize the results of the restriction digestion by loading 10 μl of the reaction mixture on a 0.8−1.5% (wt/vol) agarose gel in 1× TAE with ethidium bromide (0.5−1 μg/ml). Because PmeI has two recognition sites on the MAC-tag destination vector that are approximate to the att sites, the correct vector after digestion should appear as two distinct fragments on an agarose gel. One band represents the backbone of MAC-tag about 5,000 base pairs, and the other band shows the insert of POI, the actual size depending on the POI. See Fig. 2a for an example gel where we used LONP1 (BC000235) to show the product after restriction digestion with PmeI (Fig. 2a).

Generation of stable inducible cell lines expressing the MAC-tagged POI
Timing ~12−15 d
-
21
On day 0, plate 3 × 10⁵ cells onto six-well plates. Prepare at least three wells for the following steps. One well for untransfected cells will be used as a negative control for transfection and selection. One well will be used for MAC-tagged GFP as a positive control for transfection and selection. One well will be used for MAC-tagged POI.
Critical step
Use regularly passaged cell lines, and do not use cells that have been cultured for too long (>2 months).
-
22
On the next day (day 1), check the cells using an inverted microscope. The cells should reach confluence between 60% and 80% by visual inspection.
-
23
Prepare a transfection mix as recommended by the manufacturer of the transfection reagent. For each well, use a ratio of 9:1 (wt/wt) for pOG44:MAC-tagged plasmid (1.8 μg of the pOG44 plasmid and 200 ng of the MAC-tagged plasmid):
Component
Amount
MAC-tagged plasmid from Step 17
200 ng
pOG44 plasmid
1.8 μg
FuGENE 6 or FuGENE HDa
8 μl
Medium to a final volume of
100 μl
Critical step
Include a positive control transfection with pOG44 and MAC-tagged GFP, which can be used as GFP control in the data filtering stage as well. Include a negative control of untransfected cells for selection.
-
24
Add the transfection mix to the cells and leave the cells overnight in a cell culture incubator.
-
25
On day 2, replace media to fresh complete media.
-
26
On day 3, gently rinse cells with 2 ml of PBS, add 500 μl of pre-warmed trypsin-EDTA to cover the bottom of the well and incubate the plate at 37 °C for 3 min. Neutralize the trypsin with 1 ml of complete culture media and split the cells from each well into a separate T175 flask containing a total volume of 35 ml of complete cell culture medium. There should be a minimum of three T175 flasks—one for positive control with MAC-tagged GFP, one for negative control without transfection and one for MAC-tagged POI.
-
27
On day 4, change the media to 35 ml of hygromycin B selection media.
-
28
On subsequent days, change media every 2−3 d to 35 ml of fresh hygromycin B selection media to each flask. After 7−10 d, cells that were not transfected or were transiently transfected and have not become resistant will die. For resistant cell clones, we typically obtain ~50−100 colonies per flask.
Critical step
Keep the flask upright and try not to touch the cell monolayer when removing or adding the media from/to the flask. Act quickly to avoid cells becoming dry.
-
29
When the resistant cell clones have grown to a diameter of ~2−5 mm (after ~14 d), wash the cells with 20 ml of PBS and trypsinize the cells with 4 ml of trypsin-EDTA by incubation for 5 min in the incubator. Split the cells from each T175 flask into 5 × 150-mm dishes in a total volume of 30 ml of complete cell culture medium per 150-mm culture dish.
-
30
Fluorescence microscopy to verify expression and localization of the POI (Steps 30–33): Seed stable cells at concentrations varying between 8,000 and 25,000 cells per well on polylysine-coated glass-bottom dishes.
-
31
When cells reach to 40−60% confluence (typically after 24−48 h, depending on the seeding density in Step 30), add tetracycline and biotin to final concentrations of 2 μg/ml and 50 μM, respectively. Twenty-four hours later, cells should be subcultured upon approximately 90% confluence (see Fig. 2b).
Critical step
The phenotype of the cells can be affected by expression of the MAC-tagged bait protein. The toxic effect of bait protein can be observed by seeing the evidence of cell death.
-
32
Wash the cells twice with 4 ml of PBS and fix the cells with 4% (vol/vol) PFA in PBS for 15 min at RT. Wash the cells two times with 4 ml of PBS, permeabilize with 0.1% Triton X-100 for 5 min and then block with IF blocking buffer for 30 min.
-
33
Wash the cells one time with 4 ml of PBS. Detect the bait proteins by incubating the cells with the anti-HA antibody (1:1,000; vol/vol) in 2 ml of IF blocking buffer for 45 min at RT, followed by another two washes with 4 ml of PBS. Apply the Alexa Fluor 488-conjugated secondary antibody (1: 1,000; vol/vol) in 2 ml of IF blocking buffer for 30 min at RT, followed by another two washes with 4 ml of PBS. Mount the cells with mounting medium. Figure 2c shows an example where we used MAC-tagged POI, LONP1 (P36776) to show the bait protein and biotinylated protein after immunostaining.
Critical step
Biotinylated proteins can be detected by adding Alexa Fluor 594 streptavidin (1: 1,000; vol/vol) to the secondary antibody solution. DAPI staining (1:1,000; vol/vol) can be used after the final PBS wash step to determine the nuclei.
-
34
Testing the expression levels of MAC-tagged protein by western blot (Steps 34−42): Seed cells at a concentration varying between 80,000 and 300,000 cells per well on a six-well plate. Prepare two wells for each cell line.
-
35
When cells reach 60−80% confluence (typically after 24−48 h, depending on the seeding density in Step 34), add tetracycline and biotin to final concentrations of 2 μg/ml and 50 μM, respectively.
-
36
Twenty-four hours later, remove the media and wash twice with 4 ml of PBS. Remove the PBS and add 100–150 μl of 2× Laemmli buffer to each well (100−150 μg protein per well). Swirl around to lyse all cells properly. Scrape cells off the plates and collect the cell lysate into 1.5-ml microcentrifuge tubes.
-
37
Sonicate the lysate in a water bath for 10 min at RT and boil the samples for 5 min. Centrifuge lysate for 5 min at 16,000g (RT) and transfer the cleared supernatant to a new tube.
Pause point
The cleared supernatant can be stored at −20 °C for several months and at −70 °C for up to 1 year.
-
38
Use 15−30 μl per sample for gel electrophoresis on a ten-well comb, miniTGX gel (any KD), along with protein ladder. Run gel at 80 V for 20 min and then increase to 125 V for a period of time depending on the position of the prey proteins on the gel, which is monitored by a pre-stained protein ladder.
-
39
Pre-chill the transfer buffer at 4 °C and equilibrate the gels in transfer buffer for 15 min. Soak the membrane and filter papers in transfer buffer for 2 min. Assemble a Gel-Membrane-Filter paper sandwich for semidry blotting. For one mini-TGX gel, we use 20 V and max current (~400 mA) for 30 min for transferring proteins from gel to membrane.
-
40
After electrophoretic transfer, rinse the blotted membrane with deionized water and then block with blocking buffer at RT for 1 h with agitation. Wash the blot twice with TBST for 5 min each time.
-
41
Incubate the blot in the diluted primary antibody (anti-HA antibody; 1:2,000; vol/vol) solution in WB blocking buffer at 4 °C for overnight with agitation. Wash the blot with TBST at RT three times for 10 min. Incubate with secondary antibody conjugated to horseradish peroxidase (HRP) in TBST at the recommended dilution (usually 1:5,000) at RT for 30 min with agitation. Remove the solution and wash three times with TBST at RT for 10 min.
-
42
Visualize the signals by enhanced chemiluminescence and captured on a LAS3000 darkbox with 5m exposure. Figure 2d shows an example western blot where we used MAC-tagged POI, LONP1 (P36776) cell line to show the expression level of bait.
Critical step
In case a specific antibody is available, also perform a WB against the bait protein itself to compare the expression levels of the MAC-tagged POI to the endogenous levels.
-
43
Cryopreserving the stable cell lines (Steps 43–46):
Critical step
Stable cell lines generated using the Flp-In method might silence the exogenous proteins over a large number of passages. It is recommended to cryopreserve early passages of stable lines and to not use these cell lines for longer than 15−20 passages.
-
44
To freeze cells, wash the cells with 15 ml of PBS and trypsinize the cells by adding 4 ml of trypsin-EDTA and incubate for 5 min. Resuspend the cells in 8 ml of complete cell culture medium per 150-mm dish and pellet them to a 15-ml tube at 300 r.p.m. for 5 min at RT.
-
45
Remove the supernatant and resuspend the pellet in 2 ml of freezing medium per 150-mm dish.
-
46
Pipette 1 ml per cryovial and store at –80 °C for 24 h, after which move to liquid nitrogen for long-term storage.
Pause point
The cryovials can be stored in liquid nitrogen for several years. After long-term storage, we recommend following Steps 34−42 and Steps 43−46 to verify protein expression levels and correct localization.
Generation of cell pellets for protein purification
Timing 5 d
-
47
Expand the cell lines expressing the MAC-tagged POI in 4 × 150-mm dishes until they reach 80% confluency. Split the 4 × 150-mm dishes to 20 × 150-mm dishes (ratio 1:5), containing a total volume of 30 ml of complete cell culture medium per dish.
Critical step
Of these 20 plates, ten will be used for AP–MS (two replicates of five plates), and ten will be used for BioID (two replicates of five plates). Include appropriate controls (ie, MAC-GFP-expressing cell lines) and scale up the number of plates to increase the number of replicates if necessary.
-
48
When the 20 dishes reach ~70% confluency (normally in ~2−3 d after splitting,) induce ten plates with 2 μg/ml of tetracycline for AP–MS purification by adding 10 ml of AP–MS induction media. Induce the remaining ten plates with 2 μg/ml of tetracycline and 50 μM biotin for BioID purification by adding 10 ml of BioID.
-
49
After 24 h incubation, the cells should start to proliferate and form a monolayer of cells (see Fig. 2b). Take the culture dishes out from incubator and carefully decant the medium from the dishes into a waste container (we add a bag of Virkon to the container to disinfect the liquid waste). Tap the dish onto clean paper towels to remove the remaining medium and place the empty dishes on ice. Rinse cells gently and briefly with ice-cold ~10 ml of PBS-(MgCl2 + CaCl2) and remove by pouring into the waste container.
Critical step
Pipette the PBS-(MgCl2 + CaCl2) carefully onto the side of the dish to avoid washing off the cells.
Critical step
For optimal results, at least the first time when this experiment is carried out, two people should participate in Steps 47 and 49.
-
50
Add 10 ml of ice-cold PBS-EDTA to one of the dishes. Pipette up and down several times along the bottom of the plate to harvest the cells. Transfer the cell suspension from the dish to the next dish. Repeat the procedure to harvest cells from five dishes and collect the suspension into a 15-ml centrifuge tube (~13-ml cell suspension/15-ml tube) and keep the tube on ice. Harvest the second set of five plates in the same way and collect them into a separate tube. The two tubes are processed as a technical replicate throughout the procedure.
Critical step
A rapid cell harvest is very important to preserve protein activity and should not take more than 10 min for five 15-cm dishes.
-
51
Pellet the cells by centrifugation at 1,200g for 5 min at 4 °C. Decant the supernatant (the pellet size should be approximately 1 ml). Invert the tubes briefly and gently tap the tube on a paper towel to remove the remaining droplets. Snap freeze the pellets by dipping the tube into liquid nitrogen and then transferring to a –70 °C to –90 °C freezer for long-term storage.
Caution
Always wear PPE when handling liquid N2.
Pause point
Frozen pellets should be stored at–70 °C to –90 °C for no longer than 3 weeks to ensure that the stability of the protein is not compromised.
Parallel strep-affinity purification and proximity biotinylation purification
-
52
Follow Option A for AP–MS and Option B for BioID.
-
(A)
Strep AP for AP–MS
Timing 1 h
-
(i)
Resuspend the AP–MS cell pellets in 3 ml of ice-cold AP–MS lysis buffer (3× pellet volume) by incubating on ice for 15−20 min. During the incubation, vortex the tube every 2−5 min vigorously for 5 s. Repeat to vortex several times to make sure the whole pellet is completely resuspended. At the end of resuspension, a slightly cloudy solution should be obtained.
-
(i)
-
(B)
Proximity biotinylation purification for BioID
Timing 1 h
-
(i)
Resuspend the BioID pellet in 3 ml of ice-cold BioID lysis buffer (3× pellet volume) plus 1 µl of benzonase nuclease by incubating on ice for 5−10 min. During the incubation, vortex the tube every 2−5 min vigorously for 5 s. Repeat the vortex several times to make sure the whole pellet is completely resuspended.
-
(ii)
Sonicate the lysates in an ice bath with 3 min of continuous sonication followed by a 5-min break for a total of three cycles.
Critical step
Alternatively, samples can be sonicated with a probe sonicator on ice using three 30-s bursts with 3-s pauses at 50% amplitude.
-
(i)
-
(A)
Pull-down
Timing 2 h
Critical
A schematic overview of the pull-down protein purification procedure (Steps 52−60) is shown in Fig. 3
Critical
It is recommended to perform chromatography at 4 °C. However, you can bring the tube to RT during the elution step.
-
53
Split each 15-ml tube of the cell lysates evenly into two 2-ml tubes. Centrifuge the samples at 16,000g for 15 min at 4 °C.
Fig. 3: Schematic representation of the protein purification with Strep-Tactin beads for AP–MS and BioID (Steps 52−60). 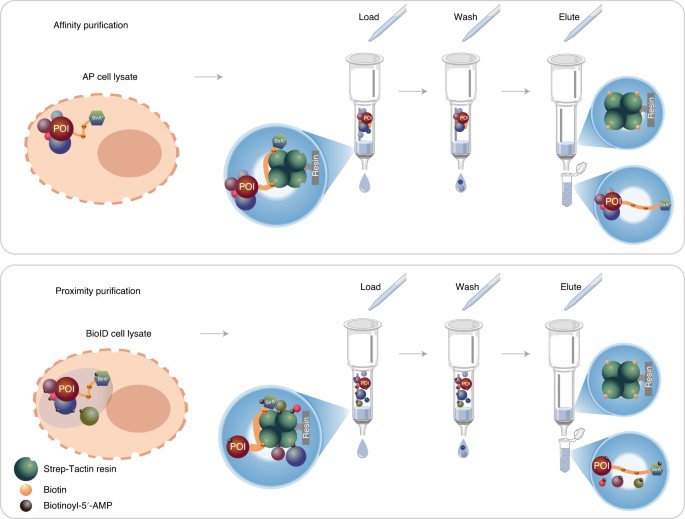
The two pipelines differ in cell culture. For the BioID pipeline, in addition to tetracycline, biotin is added for activation of the BirA* (Step 48). After disruption of cells, the cleared lysate is loaded onto spin columns containing pre-washed Strep-Tactin resin. For AP–MS, protein complexes with the POI are obtained through the binding of the MAC-tag to the Strep-Tactin resin. After washing, the retained protein complexes are eluted from the resin by resuspending in elution buffer containing excess biotin. For BioID, the MAC-tagged POI and the proteins that have been biotinylated are bound to the Strep-Tactin resin. After washing, the retained bait protein and biotinylated proteins are eluted by resuspending in the elution buffer.
-
54
Pour the supernatants into a new 2-ml tubes and centrifuge again at 16,000g for 10 min at 4 °C.
Critical step
Be careful pouring off the supernatant, and make sure that the pellet remains attached to the bottom of the tube.
-
55
During the second round of centrifugation, set up the purification column as follows. Snap off the tip of Bio-Rad spin columns and place the columns on a column rack. Prepare one spin column for each sample tube prepared in Step 52. Add 400 μl of Strep-Tactin bead slurry to each column and allow the resin to settle in the column for 5 min.
Critical step
Use a wide-bore tip or cut pipette tip for transferring the slurry. IBA Strep-Tactin beads are supplied as a 50% slurry. For a different brand of resin, adjust slurry volumes proportionately to the binding capacity.
-
56
Equilibrate the Strep-Tactin beads once with 1 ml of AP–MS lysis buffer for the Strep AP samples and 1 ml of BioID lysis buffer for the proximity biotinylation purification samples.
-
57
Gently apply cleared supernatants from Step 54 to the rim of the columns by pouring slowly without disrupting the packed resin. Once the sample has been applied to the top of the column, allow the flow to drain under gravity. Continually apply sample until the entire sample has been loaded and allow the column to completely drain.
Critical step
The pH of the cell lysate should be around 7.5−8 for effective binding to the Strep-Tactin beads. Correct the pH using NH4HCO3 solutions if needed.
-
58
Wash the resin three times with 1 ml of ice-cold pull-down wash buffer. Detergents (eg, 0.5% Igepal CA-630) in wash buffer will help remove the nonspecific binding to the resin and will not affect the binding of proteins to the Strep-Tactin resin.
-
59
Wash the resin four times with 1 ml of HENN buffer. Let the wash buffer flow through the inner rim of the tube to make sure all the detergent in the lysis buffer has been washed away. This washing step can be repeated additional times to increase the purity of the final protein products.
-
60
Place the end cap tightly onto the column tip. Add 300 μl of pull-down elution buffer. Seal the column with the top snap cap. Gently vortex or invert the column several times to resuspend the resin in elution buffer and incubate at RT for 5 min. Remove the end cap and place the columns into clean 2-ml microcentrifuge tubes. To obtain maximum yields, repeat the elution cycle two more times and combine the three elution fractions. We usually measure protein concentration after elution, using a Pierce 660-nm assay on a NanoDrop spectrophotometer. The total amount of protein is usually less than 250 µg.
Critical step
Always remove the top cap before the bottom cap to avoid drawing air bubbles down into the resin bed.
Pause point
The eluted sample can be frozen and kept at −80 °C for short-term storage (3 weeks). However, this might result in some sample loss.

Sample preparation for MS
Timing 3.5 h
-
61
Check the pH of the samples using pH paper (should be around 8). If needed, adjust the pH with a 200 mM NH4HCO3 solution.
-
62
Add TCEP to a final concentration of 5 mM. Incubate at 37 °C with shaking for 20 min. TCEP is used to break disulfide bonds within and between proteins by reduction.
-
63
Cool the sample to RT and add freshly prepared IAA to a final concentration of 10 mM for alkylation. Incubate for 20 min at RT in the dark.
-
64
Add 1.5 µg of trypsin (trypsin:protein ratio of 1:100−1:20 (wt/wt)). Incubate for a minimum of 2 h with shaking at 37 °C.
Critical step
Incubation times might vary depending on the manufacturer of trypsin. To ensure that the protein samples are completely digested, we suggest overnight incubation.
De-salting and enrichment of peptides
Timing ~4 h
Critical
For optimal results, proceed with the entire procedure in a timely manner and avoid excessive resin drying between steps. All reagents used at stages must be HPLC or MS grade to ensure the absence of trace contaminants that can interfere with nLC separation and MS detection.
-
65
Check the pH of the sample by placing 1−2 μl of the sample on a pH indicator paper. Adjust the pH until the sample is acidic (pH <3) using 10% (vol/vol) TFA.
-
66
Add ACN to the samples to obtain a final concentration of 1% (vol/vol).
-
67
Set up the C18 columns by sliding the adapter collar onto the C18 spin column and place it in a 2-ml tube. For one biological replicate, one C18 column tube is needed.
Critical step
The C18 spin columns will retain non-polar solutes such as peptides, proteins and detergent. These columns can bind up to 60 µg of the total peptide. Salts, DNA and polar solutes will not be retained. Column purification permits the removal of interfering contaminants and releases peptides in MS-compatible solutions.
-
68
Activate the C18 columns by adding 100 µl of ACN to rinse walls of the spin column and to wet resin. Centrifuge at 500g for 30 s at RT. Repeat this step two additional times and discard the flow-through.
-
69
Equilibrate the C18 spin columns by adding 100 µl of buffer A and centrifuge at 500g at RT for 30 s. Repeat this step three additional times and discard the flow-through.
-
70
Spin the columns once more at 500g for 1 min at RT to fully empty the column.
-
71
Load the maximum volume of digested sample from Step 66 (100−300 µl of sample/C18 column) to the column and centrifuge at 500g for 30 s at RT. Repeat this step until the entire sample has been applied to the column. Empty the collection tube when needed.
-
72
Spin the column once more at 500g for 1 min at RT.
-
73
Wash the resin by adding 100 µl of C18 wash buffer and centrifuge 30 s at 500g at RT. Repeat this step three additional times. Empty the collection tube when needed.
-
74
Spin the column once more at 500g for 1 min at RT to remove any moisture on the exterior of the column.
-
75
Transfer the column to a low protein binding collection tube.
Critical step
Low protein binding microcentrifuge tubes (2 ml) help minimize peptide loss during sample preparation. For optimal results, the tube can be rinsed with elution buffer before use.
-
76
Elute by adding 100 µl of C18 elution buffer to the columns and centrifuge 30 s at 500g at RT. Repeat this step two more times to elute the entire sample into a single collection tube.
-
77
Spin the column once more at 500g for 1 min at RT to make sure all elution buffer passes through the column.
-
78
Evaporate the eluted samples to dryness in a centrifugal vacuum evaporator (>2 h).
Pause point
Store dried peptides at −80 °C until ready to be analyzed by MS. Avoiding sample freeze–thaw cycles before analysis will help to minimize sample loss.
LC–MS/MS analysis
Timing ~ 2 h per sample
-
79
Recover the samples in 30 µl of buffer A and leave the samples in a sonicating water bath for 15 min to detach the peptides bound to the plastic.
-
80
Centrifuge the sample at 13,000g for 5 min at 4 °C to pellet any particulates and transfer all the supernatant (~30 µl) to an autosampler vial.
-
81
Spin and mark the vials carefully. Load 4 μl of the sample onto the LC mass spectrometer and run an optimized gradient as described in the ‘Equipment setup’ section.
Pause point
Any unused sample can be stored (do not re-dry) at −80 °C. To rerun stored samples, thaw samples at 4 °C, vortex, centrifuge as described in Step 80 and take the sample for injection as described in Step 81. Avoiding sample freeze–thaw cycles before analysis will help to minimize sample loss.
Protein identification using Proteome Discoverer
Timing ~ 0.5 h per sample
Critical
We routinely search the raw data generated by MS using the search engine SEQUEST and the post-search algorithm Percolator, which is embedded in Proteome Discoverer. The combination of SEQUEST and Percolator usually provides slightly better performance for high-accuracy MS2 (Orbitrap) data sets than other search engine and algorithm settings43. For more information about the Proteome Discoverer software, check the Proteome Discoverer User Guide online (https://assets.thermofisher.com/TFS-Assets/CMD/manuals/Man-XCALI-97808-Proteome-Discoverer-User-ManXCALI97808-EN.pdf).
Critical
Besides Proteome Discoverer, other computational tools, such as Abacus (http://abacustpp.sourceforge.net/) compatible with TPP (http://tools.proteomecenter.org/software.php) or MaxQuant (https://www.maxquant.org/), can also be used to obtain the peptide-spectrum match (PSM) values from MS files.
-
82
Prepare an organism-specific updated sequence database. UniProt databases can be accessed online (http://www.uniprot.org/). UniProtKB/Swiss-Prot is the manually annotated and non-redundant protein sequence database. Download the database in Fasta format and append with GFP, MAC-tag, serum albumin and trypsin protein sequence, of which the information can be obtained from our website (http://proteomics.fi).
-
83
Create the appropriate processing workflow in the workflow tree panel of the Workflow Editor in Proteome Discoverer. The most straightforward workflow we routinely use contains the following nodes:
-
Spectrum Files node
-
Spectrum Selector node
-
Sequest HT node
-
Percolator node
-
-
84
Depending on the data, choose the appropriate nodes from the workflow. For information about these nodes, refer to the Help section of Proteome Discoverer.
-
85
Define the parameters for each node and start the search. In most cases, we use the default parameters for each node. When the data are obtained from a QExactive mass spectrometer, we suggest using the following settings for SEQUEST:
Parameter
Setting
Missed cleavages
2
Precursor mass tolerance
± 15 ppm
Fragment mass tolerance
0.05 Da
Static modification
Cysteine carbamidomethylation
Variable modification
Methionine oxidation (AP–MS)
lysine biotinylation (BioID)
N-terminal biotinylation (BioID)
-
86
Use the Percolator algorithm to assess the resulting peptide identifications. A false discovery rate (FDR) cutoff of either 1% or 5% at the protein level can be applied. Recommended filters include peptide confidence (high) and peptides per protein (2). The final annotated result can be exported to Excel as a .xlsx or .csv file.
High-confidence interactor identification using SAINT and CRAPome
Timing ~ 0.5 h
Critical
Protein identifications vary somewhat between different search engines and usually share more than 50% overlap when comparing commonly used search engines44. However, those high-confidence interactors can be fairly similar after applying statistics methods45.We routinely use the Significance Analysis of INTeractome (SAINT) software (http://saint-apms.sourceforge.net/Main.html)46 to assign confidence scores to PPI data. It calculates the probability of true interaction based on the spectral count that can be extracted directly from Proteome Discoverer. A user-friendly way to run SAINT analysis without installing software is through the Contaminant Repository for Affinity Purification (CRAPome) website (https://www.crapome.org/) or the ProHhits website (http://prohitsms.com). Detailed information on the SAINTexpress analysis workflow can be found in the previous publication47. Here we provide another possibility that integrates the SAINT analysis and CRAPome filtration into a browser-based tool for users (Fig. 4).
-
87
Generate the sample information file in any text editor. This file should contain three tab-delimited columns: purification name (Excel file name from Proteome Discoverer), bait name and Target sample (T)/Control (C) labels. Duplicate Excel file names should be avoided. The bait names and file names should not contain any spaces. The pairing between purification name and bait name will be used for generating the interaction file. The third column of the table is completely filled with letters ‘T’ and ‘C’ to indicate the target sample and control sample, respectively. Click on the ‘DATA PROCESSING’ tab of the http://proteomics.fi website and upload the sample.txt file to the ‘Bait file’ input field and all the sample files that were exported from Proteome Discoverer in Step 86 onto the ‘MS Output files’ input field.
Fig. 4: Schematic representation of the data analysis and visualization workflow. 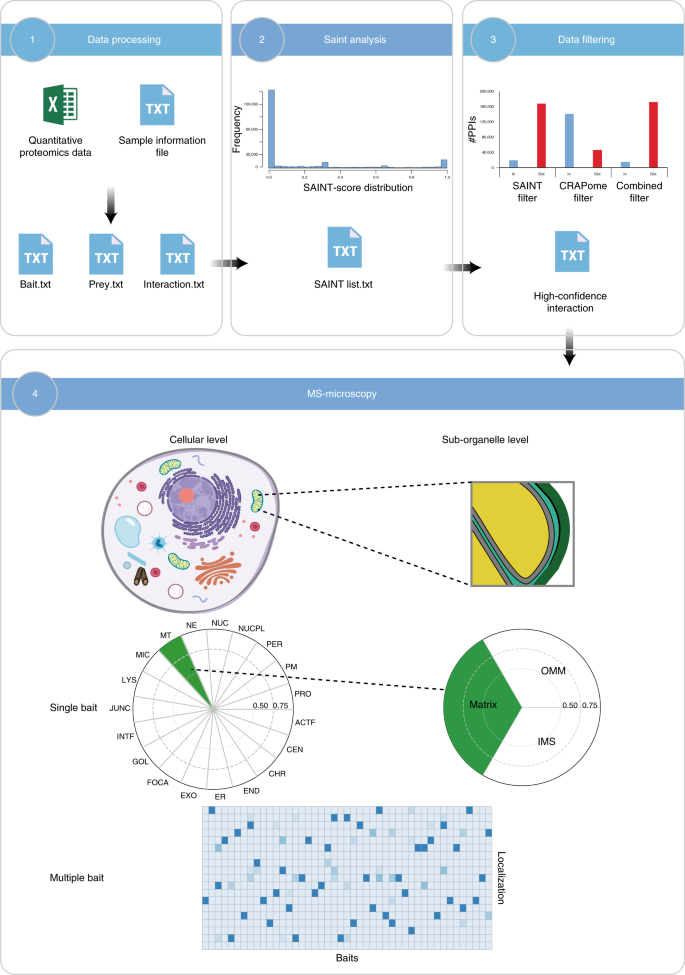
The data analysis and visualization workflow consist of four main modules: data processing (Steps 87 and 88), SAINT analysis (Steps 89), data filtering (Steps 90 and 91) and MS-microscopy (Steps 92−94). These modules work coordinately to facilitate the data analysis process. Users upload the quantitative proteomics data and sample information to generate the input files (bait.txt, prey.txt and interaction.txt) for SAINT analysis. SAINT assigns confidence scores to PPIs based on quantitative proteomics data. The plot in this section shows the distribution of the SAINT score. The list generated by SAINT analysis can be directly used for the data filtering step. The high-confidence interactions are identified based on their SAINT score and BFDR in combination with the CRAPome contaminant database. The bar plot illustrates the number of interactions that are filtered out by different strategies. The MS-microscopy platform uses these high-confidence interactions and considers the weights of interactors to provide dynamic localization information at the cellular and sub-organelle level.
-
88
Specify the of GFP controls to be included in the data set by clicking the corresponding tabs check boxes in the ‘DATA PROCESSING’ tab. We provide several GFP control samples on our website (http://proteomics.fi) as a supplement to user-generated controls to aid in the removal of nonspecific/background preys. These control samples include GFP-only and GFP with target signal sequence (plasma membrane localization signal, nuclear localization signal and nuclear export signal). Click the Run button to generate the files that are needed for SAINT analysis. The lower-right corner of the website indicates the processing time. When the execution is complete. The output of the program generates three text files, and the Download icon enables the user to directly download ‘bait.txt’,’prey.txt’ and ‘interaction.txt’.
-
89
SAINTexpress analysis. Select the files generated in Step 88 and click the Browse button to upload. The server will once again check the format of the ‘bait.txt’,’prey.txt’ and ‘interaction.txt’ files. After uploading, click the Run button to process the SAINTexpress analysis. When the execution is complete, a new window will pop up to enable the download of output ‘list.txt’. Examples of the files generated in this step can be found on our website (http://proteomics.fi).
-
90
Data filtering with SAINT. The ‘list.txt’ generated in Step 89 lists all unique bait–prey pairs with the corresponding probability scores (AvgP), SAINT score and Bayesian false discovery rate (BFDR). Each pair of interaction is assigned a SAINT score and a probability ranging from 0 to 1, representing the specificity of the interaction based on the PSM observation. To enable the filtering with SAINT, users click the arrow under SAINT score and BEDR and click the option that they want. We usually consider proteins with a SAINT score of 0.6 or more or a Bayesian FDR value of 0.05 or more as high-confidence interactors.
-
91
Data filtering with CRAPome. For each protein, the server calculates the average spectral count fold change by calculating the ratio of avgPSM of your sample to the average of PSM generated by CRAPome. To enable the filtering with CRAPome, users type the values that they want into the input boxes, which are under CRAPome frequency and PSM ratio. We recommend using the CRAPome database with a cutoff frequency of 0.2, except the hits with an average spectral count fold change of 3 or more, to obtain the high-confidence interacting proteins.

Data visualization using the MS-microscopy platform
Timing ~ 0.5 h
Critical
We highly recommend users refine their PPI data with statistics tools such as SAINT before proceeding with the MS-microscopy platform (Fig. 4). The MS-microscopy platform uses the relative quantification of the spectral count. An advantage of choosing spectral counting over MS1 intensity is that spectral count is less sensitive and does not require alignment between runs, thus making it flexible in applying on different data sets.
-
92
Use the standard output results from SAINT (generated in Step 91) as input files for visualization using the MS-microscopy platform on http://proteomics.fi.
Critical step
Data sets from other software and tools might require tailoring before they are used as the input file. The minimum requirement of an input.txt file is that it should include the following information columns: ‘Bait’, ‘Prey’ and ‘AvgSpec’. Example files are available for users under the ‘Example data for molecular microscropy analysis:’ in the ‘MS-MICROSCOPY’ tab. The platform accepts the input data set containing more than one bait protein.
-
93
Click the Browse button to upload the filtered protein interaction data.
-
94
The result takes a few seconds to display as a polar plot where the circle has been equally divided into 19 sectors, and each sector represents one specific subcellular location. Color scale: potential location score of query bait is shown over a three-color scale to be easily distinguished (with scores between 0 and 0.5 marked in red, between 0.5 and 0.75 in yellow and between 0.75 and 1 in green), whereas the shaded area in the sector indicates the relative score of query bait. Use the heat map for the visualization when the data set includes multiple POIs. The plot and heat map can be downloaded in PDF format. The corresponding score that is generated by the MS-microscopy platform can be downloaded as .txt format.
Troubleshooting
Troubleshooting advice can be found in Table 1.
Timing
-
Steps 1−20, generation of MAC-tagged gene of interest destination vectors: 2−3 d
-
Steps 21−46, generation of the stable cell lines of MAC-tagged POI: 12−15 d
-
Steps 47−51, generation of cell pellets for protein purification: 5 d
-
Steps 52−60, parallel AP–MS and BioID protein purification: 2 h
-
Steps 61−78, proteolytic digestion and peptide cleanup: 7.5 h
-
Steps 79−81, LC−MS/MS analysis: ~2 h/sample
-
Steps 82−86, protein identification using Proteome Discoverer: ~0.5 h
-
Steps 87−91, high-confidence interactor identification: ~0.5 h
-
Steps 92−94, ‘MS-microscopy’ application: ~0.5 h
Anticipated results
The rationale of our approach was to combine the separate AP–MS and BioID methods into one workflow to reduce the time and reagents spent on obtaining stable cell lines and protein purification. Using the Proteome Discoverer software with the threshold for high-confidence peptides, typically 300–800 proteins and 800–1,200 proteins are identified from AP–MS and BioID samples, respectively. Depending on the expression level of the POI, 20−600 PSMs and more than ten unique peptides of the MAC-tag and POI are identified. The MAC-tag and POI are expected to be found in the top 30 positions when ranking the protein identifications based on Proteome Discoverer probability-based scoring system. The prey list usually contains ~ 10% of known interactors before filtering steps. Unless the bait protein interacts with tubulin, the eluted samples after protein purification should not contain tubulin (Fig. 3d). After stringent data filtering using our online service, the average number of high-confidence interactors for AP–MS data sets are generally ~40. The total number of high-confidence interactors obtained by the BioID approach is higher, ~200, because it can also capture transiently binding proteins and proteins that are in close proximity to the bait (Fig. 3d).
One of the key features of the protocol described here is the MS-microscopy platform, which is a prototype portal to annotate the localization information of a POI based on its protein interaction data. Using the MS-microcopy platform, users can obtain high-resolution and dynamic localization information of a POI, both at the subcellular (Fig. 5a) and sub-organelle level (Fig. 5b). Moreover, a data set composed of multiple POIs can be visualized by a heat map (Fig. 5c).

The MS-microscopy platform was applied to visualize the localization of MAC-tagged LONP1 at the subcellular (a) and sub-organelle (b) level. The color assigned to each sub-organelle location is based on the annotation frequency (green: 0.75−1; yellow: 0.5−0.75; pink: 0−0.5). c, The heat map shows subcellular localizations of 45 bait proteins that were used for constructing the human biotinylation map26. The color assigned to each of the localizations is based on the annotation score of the MS-microscopy system. The color scheme is shown at the bottom part of the panel.
Reporting Summary
Further information on research design is available in the Nature Research Reporting Summary linked to this article.
Data availability
All the relevant files and testing examples can be downloaded from our website (http://proteomics.fi/). Other data that support this study are available from the corresponding author upon reasonable request.
Code availability
MS-microscopy Python code as well as R code for Shiny server are freely available on GitHub at https://github.com/kamms/ms-microscopy.
References
Fields, S. & Song, O. A novel genetic system to detect protein–protein interactions. Nature 340, 245–246 (1989).
Yachie, N. et al. Pooled-matrix protein interaction screens using Barcode Fusion Genetics. Mol. Syst. Biol. 12, 863 (2016).
Rajagopala, S. V., Sikorski, P., Caufield, J. H., Tovchigrechko, A. & Uetz, P. Studying protein complexes by the yeast two-hybrid system. Methods 58, 392–399 (2012).
Rolland, T. et al. A proteome-scale map of the human interactome network. Cell 159, 1212–1226 (2014).
Varjosalo, M. et al. Interlaboratory reproducibility of large-scale human protein-complex analysis by standardized AP–MS. Nat. Methods 10, 307–314 (2013).
Roux, K. J., Kim, D. I., Raida, M. & Burke, B. A promiscuous biotin ligase fusion protein identifies proximal and interacting proteins in mammalian cells. J. Cell Biol. 196, 801–810 (2012).
Kim, D. I. et al. Probing nuclear pore complex architecture with proximity-dependent biotinylation. Proc. Natl Acad. Sci. USA 111, E2453–E2461 (2014).
Yadav, L. et al. Systematic analysis of human protein phosphatase interactions and dynamics. Cell Syst. 4, 430–444 (2017).
Liu, X. et al. An AP–MS- and BioID-compatible MAC-tag enables comprehensive mapping of protein interactions and subcellular localizations. Nat. Commun. 9, 1188 (2018).
Lambert, J. P., Tucholska, M., Go, C., Knight, J. D. & Gingras, A. C. Proximity biotinylation and affinity purification are complementary approaches for the interactome mapping of chromatin-associated protein complexes. J. Proteom. 118, 81–94 (2015).
Abbasi, S. & Schild-Poulter, C. Mapping the Ku interactome using proximity-dependent biotin identification in human cells. J. Proteome Res. 18, 1064–1077 (2019).
Couzens, A. L. et al. Protein interaction network of the mammalian Hippo pathway reveals mechanisms of kinase–phosphatase interactions. Sci. Signal. 6, rs15 (2013).
Lundberg, E. & Borner, G. H. H. Spatial proteomics: a powerful discovery tool for cell biology. Nat. Rev. Mol. Cell Biol. 20, 285–302 (2019).
van Vliet, A. R. et al. The ER stress sensor PERK coordinates ER-plasma membrane contact site formation through interaction with filamin-A and F-actin remodeling. Mol. Cell 65, 885–899 (2017).
Glatter, T., Wepf, A., Aebersold, R. & Gstaiger, M. An integrated workflow for charting the human interaction proteome: insights into the PP2A system. Mol. Syst. Biol. 5, 237 (2009).
Ortiz, D. A., Glassbrook, J. E. & Pellett, P. E. Protein–protein interactions suggest novel activities of human cytomegalovirus tegument protein pUL103. J. Virol. 90, 7798–7810 (2016).
Varjosalo, M. et al. The protein interaction landscape of the human CMGC kinase group. Cell Rep. 3, 1306–1320 (2013).
Hauri, S. et al. Interaction proteome of human Hippo signaling: modular control of the co-activator YAP1. Mol. Syst. Biol. 9, 713 (2013).
St-Denis, N. et al. Phenotypic and interaction profiling of the human phosphatases identifies diverse mitotic regulators. Cell Rep. 17, 2488–2501 (2016).
Ward, R. J., Alvarez-Curto, E. & Milligan, G. Using the Flp-In T-Rex system to regulate GPCR expression. Methods Mol. Biol. 746, 21–37 (2011).
Hesketh, G. G., Youn, J. Y., Samavarchi-Tehrani, P., Raught, B. & Gingras, A. C. Parallel exploration of interaction space by BioID and affinity purification coupled to mass spectrometry. Methods Mol. Biol. 1550, 115–136 (2017).
Schmidt, T. G. & Skerra, A. The Strep-tag system for one-step purification and high-affinity detection or capturing of proteins. Nat. Protoc. 2, 1528–1535 (2007).
Keskitalo, S. et al. Novel TMEM173 mutation and the role of disease modifying alleles. Front. Immunol. 10, 2770 (2019).
Yellapragada, V. et al. MKRN3 interacts with several proteins implicated in puberty timing but does not influence GNRH1 expression. Front. Endocrinol. 10, 48 (2019).
Kondelin, J. et al. Comprehensive evaluation of coding region point mutations in microsatellite-unstable colorectal cancer. EMBO Mol. Med. 10, e8552 (2018).
Go, C. D. et al. A proximity biotinylation map of a human cell. Preprint at https://www.biorxiv.org/content/10.1101/796391v1 (2019).
Johar, S. S. & Talbert, J. N. Strep-tag II fusion technology for the modification and immobilization of lipase B from Candida antarctica (CALB). J. Genet. Eng. Biotechnol. 15, 359–367 (2017).
Schmidt, T. G. et al. Development of the Twin-Strep-tag and its application for purification of recombinant proteins from cell culture supernatants. Protein Expr. Purif. 92, 54–61 (2013).
Einhauer, A. & Jungbauer, A. Affinity of the monoclonal antibody M1 directed against the FLAG peptide. J. Chromatogr. A 921, 25–30 (2001).
Domanski, M. et al. Improved methodology for the affinity isolation of human protein complexes expressed at near endogenous levels. BioTechniques 0, 1–6 (2012).
Lee, S.-Y. et al. APEX fingerprinting reveals the subcellular localization of proteins of interest. Cell Rep. 15, 1837–1847 (2016).
Chojnowski, A. et al. 2C-BioID: an advanced two component BioID system for precision mapping of protein interactomes. iScience 10, 40–52 (2018).
Trinkle-Mulcahy, L. Recent advances in proximity-based labeling methods for interactome mapping. F1000Research https://doi.org/10.12688/f1000research.16903.1 (2019).
Kim, D. I. et al. An improved smaller biotin ligase for BioID proximity labeling. Mol. Biol. Cell 27, 1188–1196 (2016).
Branon, T. C. et al. Efficient proximity labeling in living cells and organisms with TurboID. Nat. Biotechnol. 36, 880–887 (2018).
Waller, J. R., Anderson, J. K. & Ulmer, D. C. Use of avidin to prepare biotin-free culture media. Anal. Biochem. 141, 189–193 (1984).
Dakshinamurti, K., Chalifour, L. & Bhullar, R. P. Requirement for biotin and the function of biotin in cells in culture. Ann. NY Acad. Sci. 447, 38–55 (1985).
May, D. G., Scott, K. L., Campos, A. R. & Roux, K. J. Comparative application of BioID and TurboID for protein-proximity biotinylation. Cells https://doi.org/10.3390/cells9051070 (2020).
Gupta, G. D. et al. A dynamic protein interaction landscape of the human centrosome–cilium interface. Cell 163, 1484–1499 (2015).
Zhang, L., Pan, X. & Hershey, J. W. Individual overexpression of five subunits of human translation initiation factor eIF3 promotes malignant transformation of immortal fibroblast cells. J. Biol. Chem. 282, 5790–5800 (2007).
Vaux, D. L., Fidler, F. & Cumming, G. Replicates and repeats-what is the difference and is it significant? A brief discussion of statistics and experimental design. EMBO Rep. 13, 291–296 (2012).
De Rivoyre, M. et al. Human receptors patched and smoothened partially transduce hedgehog signal when expressed in Drosophila cells. J. Biol. Chem. 281, 28584–28595 (2006).
Tu, C. et al. Optimization of search engines and postprocessing approaches to maximize peptide and protein identification for high-resolution mass data. J. Proteome Res. 14, 4662–4673 (2015).
Paulo, J. A. Practical and efficient searching in proteomics: a cross engine comparison. WebmedCentral https://doi.org/10.9754/journal.wplus.2013.0052 (2013).
Choi, H. et al. SAINT: probabilistic scoring of affinity purification-mass spectrometry data. Nat. Methods 8, 70–73 (2011).
Teo, G. et al. SAINTexpress: improvements and additional features in significance analysis of INTeractome software. J. Proteom. 100, 37–43 (2014).
Choi, H. et al. Analyzing protein–protein interactions from affinity purification–mass spectrometry data with SAINT. Curr. Protoc. 39, 8.15.11–18.15.23 (2012).
Acknowledgements
We thank S. Miettinen for technical assistance and T. Öhman and E. Niemelä for critical reading and comments on the manuscript. We thank D. A. Yohannes for technical support of the MAC-tag online platform. Imaging was performed at the Light Microscopy Unit, Institute of Biotechnology. This study was supported by grants from the Academy of Finland (nos. 288475 and 294173), the Sigrid Jusélius Foundation, the Finnish Cancer Foundation, the University of Helsinki Three-year Research Grant, Biocentrum Helsinki, Biocentrum Finland, HiLIFE and the Instrumentarium Research Foundation.
Author information
Authors and Affiliations
Contributions
M.V. and X.L. conceived the study and designed experiments. M.V., X.L., K.S., R.W. and G.L. performed experiments and data analysis. M.V., X.L., K.S., R.W. and G.L. participated in manuscript preparation. M.V. and X.L. wrote the manuscript.
Corresponding author
Ethics declarations
Competing interests
The authors declare no competing interests.
Additional information
Publisher’s note Springer Nature remains neutral with regard to jurisdictional claims in published maps and institutional affiliations.
Related links
Key references using this protocol
Liu, X. et al. Nat. Commun. 9, 1188 (2018): https://www.nature.com/articles/s41467-018-03523-2
Kondelin, J. et al. EMBO Mol. Med. 10, e8552 (2018): https://www.embopress.org/doi/full/10.15252/emmm.201708552
Paakkola, T. et al. Hum. Mol. Genet. 27, 4288–4302 (2018): https://academic.oup.com/hmg/article/27/24/4288/5102903
Yellapragada, V. et al. Front. Endocrinol. 10, 48 (2019): https://www.frontiersin.org/articles/10.3389/fendo.2019.00048/full
Keskitalo, S. et al. Front. Immunol. 10, 2770 (2019): https://www.frontiersin.org/articles/10.3389/fimmu.2019.02770/full.
Supplementary information
Supplementary Tables
Supplementary Tables 1 and 2.
Rights and permissions
About this article

Cite this article
Liu, X., Salokas, K., Weldatsadik, R.G. et al. Combined proximity labeling and affinity purification−mass spectrometry workflow for mapping and visualizing protein interaction networks. Nat Protoc 15, 3182–3211 (2020). https://doi.org/10.1038/s41596-020-0365-x
Received:
Accepted:
Published:
Issue Date:
DOI: https://doi.org/10.1038/s41596-020-0365-x
This article is cited by
-
Interaction network of human early embryonic transcription factors
EMBO Reports (2024)
-
Mitochondrial proteome research: the road ahead
Nature Reviews Molecular Cell Biology (2024)
-
Structure and interactions of the endogenous human Commander complex
Nature Structural & Molecular Biology (2024)
-
Structural characterization of protein-material interfacial interactions using lysine reactivity profiling-mass spectrometry
Nature Protocols (2023)
-
GTPBP8 is required for mitoribosomal biogenesis and mitochondrial translation
Cellular and Molecular Life Sciences (2023)
Comments
By submitting a comment you agree to abide by our Terms and Community Guidelines. If you find something abusive or that does not comply with our terms or guidelines please flag it as inappropriate.
