
Abstract
Deubiquitylating enzymes (DUBs) play a vital role in the ubiquitin pathway by editing or removing ubiquitin from their substrate. As breakthroughs within the ubiquitin field continue to highlight the potential of deubiquitylating enzymes as drug targets, there is increasing demand for versatile high-throughput (HT) tools for the identification of potent and selective DUB modulators. Here we present the HT adaptation of the previously published MALDI-TOF–based DUB assay method. In a MALDI-TOF DUB assay, we quantitate the amount of mono-ubiquitin generated by the in vitro cleavage of ubiquitin chains by DUBs. The method has been specifically developed for use with nanoliter-dispensing robotics to meet drug discovery requirements for the screening of large and diverse compound libraries. Contrary to the most common DUB screening technologies currently available, the MALDI-TOF DUB assay combines the use of physiological substrates with the sensitivity and reliability of the mass spectrometry–based readout.
Introduction
Ubiquitylation (or ubiquitination) is the reversible conjugation of a 76–amino acid polypeptide (ubiquitin) to a target protein. The attachment of one or more ubiquitin molecules to a substrate requires the sequential activity of an E1 activating enzyme, an E2 conjugating enzyme and an E3 ubiquitin ligase1,2,3,4 (Fig. 1a). The human genome encodes ~40 E2 conjugating enzymes5 and >600 E3 ligases6,7. Substrate specificity is achieved by the combination of an E2 conjugating enzyme and an E3 ligase. Unlike phosphorylation, which is a defined binary event, ubiquitylation is more complex. Such complexity has been referred to as a ‘code’2,8 that can translate into a plethora of different cellular functions9, including proteasomal degradation10, protein localization and signaling complex formation11,12,13. Ubiquitylation is achieved through isopeptide bond formation between the ubiquitin carboxyl terminal (Gly76) and the ɛ-amino group of a lysine residue present in the target protein (Fig. 1b,d). Proteins can be ubiquitylated at one or multiple sites (mono or multi-mono ubiquitylation). Importantly, ubiquitin can itself be ubiquitylated on one of seven lysines (Lys6, Lys11, Lys27, Lys29, Lys33, Lys48 and Lys63) or through peptide bond formation with the N-terminal methionine (Met1), thus forming dimers, oligomers or polymers (Fig. 1d). Ubiquitin chains can be homogenous if the same residue is modified during elongation or mixed or branched if different linkage types are combined (Fig. 1d). Ubiquitin can also be attached to threonine/serine and cysteine residues present in the substrate, by formation of ester and thioester bonds, respectively (Fig. 1e). This alternative type of ubiquitylation has been generally referred to as ‘non-lysine ubiquitylation’, and recent literature has demonstrated its relevance in eukaryotic cells14,15,16,17 (Fig. 1e). A further layer of complexity in the ubiquitin code is provided by further post-translational modification of ubiquitin itself by lysine acetylation18 and serine/threonine/tyrosine phosphorylation19,20,21. This provides additional levels of regulation within the ubiquitin system. Given the pervasive role of ubiquitylation, it is not surprising that alterations in this pathway have been linked to the onset of several diseases, including cancer22, neurodegenerative diseases23, autoimmunity24 and infectious diseases25.

a, Diagram of ubiquitylation cascade pathway. The E1 enzyme activates ubiquitin and transfers it to its catalytic cysteine (SH), forming the activated ubiquitin–E1 complex. During this process, ATP is hydrolyzed into adenosine monophosphate (AMP) and inorganic pyrophosphate (PPi). The E2 conjugating enzyme and the E3 ligase promote the covalent attachment of ubiquitin (Ub) to the substrate. Ubiquitin is removed and recycled by deubiquitylating enzymes (DUBs). b, Ubiquitin structure (PDB code: 1UBQ). Lysine residues and N- and C-termini are indicated in blue. c, Structure of K48 (1aar), K11 (2XEW) and K63 (2JF5) ubiquitin dimers. d, Different types of ubiquitylation and polyubiquitin chains. e, Schematic representation of lysine (canonical) and serine/threonine/cysteine (non-canonical) ubiquitylation.
Deubiquitylating enzymes
Removal of ubiquitin from its substrate is the prerogative of specific ubiquitin proteases, called DUBs. To counterbalance and deal with the complex ubiquitin topology, DUBs display several layers of specificity and regulation. The human genome encodes ~100 DUBs, which are divided into seven families26,27,28 (Fig. 2). The most represented DUB family is the ubiquitin-specific proteases (USPs), with 56 members. There are also 17 ovarian tumor proteases (OTUs), 12 JAB1/MPN/MOV34 Zn-dependent metalloprotease (JAMMs), 4 Machado-Josephin domain proteases (MJDs), 4 ubiquitin c-terminal hydrolases (UCHs), 5 motif interacting with ubiquitin-containing novel DUB family (MINDYs) and 1 zinc finger–containing ubiquitin peptidase 1 (ZUP1). When referring to DUB activity, the ubiquitin molecule that presents its carboxy-terminal glycine to the DUB active site is referred to as ‘distal’, and the ubiquitin molecule that follows next is referred to as the ‘proximal’ one. DUBs bind distal ubiquitin on their S1 site and the proximal ubiquitin on a second site (S1′). Additional sites (S2/S2′ S2 or even S3/S3′ sites) may accommodate ubiquitin modules to enhance substrate specificity (Supplementary Fig. 1). Despite sharing the same catalytic activity, DUBs vary in molecular size, structure and domain architecture, which can also confer specificity toward ubiquitin chain architecture and linkage type29. In fact, ubiquitin chains linked via different residues, despite being chemically identical, are considerably different from a structural point of view. For example, K63 and M1 linked ubiquitin chains adopt an extended conformation with no contacts between individual molecules, while K48 and K11 linked ubiquitin dimers and ubiquitin tetramers adopt a compact conformation with extensive hydrophobic interactions at the interfaces (Fig. 1c). Although most USP family members are promiscuous and able to cleave several ubiquitin chain types30,31, many member of OTU, JAMM, MJD, MINDY and ZUP1 classes are linkage specific with respect to either ubiquitin chain type or architecture29,32,33,34,35,36,37,38,39,40. In addition, the length of ubiquitin chains is relevant. Some DUBs cleave poly-ubiquitin chains at accelerated rates compared to ubiquitin dimers, suggestive of an avidity effect or the presence of additional ubiquitin-binding pockets32,35,36,37,38,39. Likewise, the majority of DUBs have in vitro isopeptidase or peptidase activity; thus, they can cleave the isopeptide and/or the peptide bond between ubiquitin and substrate or within poly-ubiquitin chains. The only currently known exception is JOSD1, a member of the MJD family recently reported as the only known DUB with in vitro specific esterase activity41.

Deubiquitylating enzyme catalytic domains were clustered by sequence similarity in CLC Genomics Workbench (version 7.5) by using ClustalW, and a neighbor-joining phylogenetic tree was generated with 500 bootstrapping replicates. The most-reliable nodes (bootstrap >50%) are indicated by gray dots. Tree images were generated by using the iTOL online tool97. Protein name/alternative name: YOD1/OTU1, ZRANB1/Trabid, OTUD7B/Cezanne, STAMBPL1/ Amsh-lp, STAMBP/Amsh. Linkage specificity is color-coded as indicated in the legend. Solid lines indicate that the relative linkage type has been tested, whereas dashed lines indicate that the activity has not been tested. For example, JOSD2 activity has been tested against the K11, K48 and K63 ubiquitin dimers, and activity has been detected by using the K11 dimer. Alternative substrates (i.e., modified substrate that encodes an extra tryptophan at the ubiquitin C terminus (Ub-W) or chemoenzymatically synthesized ubiquitylated threonine model substrate (Ub-T)) in use for the indicated DUB are indicated.
DUBs as therapeutic targets
DUB-mediated ubiquitin cleavage antagonizes or edits the activity of the E2 conjugating enzymes and E3 ligases (Fig. 1a). This can result in different outcomes, from preventing proteasomal degradation of a specific substrate to switching off signaling events triggered by ubiquitin conjugation. Given the relevance of ubiquitylation in several human diseases, the interest in manipulating specific disease-related DUBs constitutes an expanding research area in the drug discovery field42,43. Of particular interest are those DUBs that stabilize proto-oncogene proteins whose abundance cannot be otherwise regulated by using currently available drugs. For example, the USP2a deubiquitylating enzyme stabilizes cyclin D1, an important regulator of cell-cycle progression that is overexpressed in numerous cancer types44. Inhibition of USP2a leads to increased degradation of cyclin D1, cell arrest and possible tumor regression45. Another example is represented by USP7, a highly expressed DUB implicated in the regulation of p53 tumor suppressor and its associated E3 ligase MDM246. Also relevant is the role of DUBs in infectious diseases. Ubiquitylation is a regulatory mechanism involved in virtually every eukaryotic cellular process, including innate and adaptive immune responses47,48,49. In the ongoing evolutionary fight between host and pathogen, certain viral and bacterial species have developed sophisticated mechanisms to interfere with the cellular ubiquitylation pathway to promote their own survival50,51. One of these hijacking mechanisms is the expression of proteases with deubiquitylating activity52. Proteases with deubiquitylating activity have been identified in DNA viruses, such as adeno- and herpesviruses, and RNA viruses, including coronaviruses. For example, one of the two essential proteases encoded in both of the severe acute respiratory syndrome coronavirus (SARS-CoV and SARS-CoV-2) genomes, the papain-like protease, is a member of the USP family of DUBs and has deubiquitylating activity53,54. A similar protease has been identified in the Middle-East respiratory syndrome coronavirus55,56 and in the Crimean–Congo haemorrhagic fever virus (vOTU)57,58. The bacterial kingdom also has pathogenic deubiquitylating enzymes that are expressed during the infection process, i.e., SseL encoded by Salmonella enterica, ChlaDub1 and ChlaDub2 encoded by Chlamydia trachomatis and YopJ, a Yersinia species ubiquitin-like protein protease.
MALDI-TOF mass spectrometry (MS) for drug discovery
Screening for inhibitors (or activators) of relevant enzymes is often the first and most challenging step in a drug-discovery project. Until recently, fluorescence- or chemiluminescence-based techniques have played a major role in HT screening (HTS) campaigns. While being robust, sensitive and fast, fluorescent, chemiluminescent and antibody-based tools also have several drawbacks. Because of their compound auto-fluorescence or signal-quenching properties, they are particularly prone to false positives and negatives through pan-assay interference59,60, and can also require the development of specific antibodies or artificial labeled substrates. In the past two decades, MALDI-TOF MS has emerged as a compelling tool to perform early-stage, HT drug-discovery screening. A pioneering study in 1998 marked the beginning of the use of MALDI-TOF MS for automated, compound screening61.Those early efforts have been sustained by the increasing availability of both fast and robust high-end commercial MALDI-TOF MS instruments and tailored automated nanoliter liquid-handling systems. This allowed the miniaturization and scalability of MALDI-TOF MS–based assays to 384 and 1,536 well formats. To date, MALDI-TOF MS–based assays have been established for a large variety of enzymes—including E3 ligases62, kinases63,64, phosphatases65,66, β-secretases (BACE1)67, histone demethylases and acetylcholinesterases68 and cyclic GMP-AMP synthases69—and have been applied to the analysis of N-glycans70,71,72. The success of MALDI-TOF MS within HTS campaigns relies on several factors. First, MALDI-TOF MS circumvents the possibility of artefacts associated with substrate labeling (e.g., spurious fluorescence signals) while retaining high sensitivity, speed, signal robustness and high throughput. Moreover, MALDI-TOF MS detection is highly versatile, as it can directly quantify an extensive range of assay components, substrates and products of enzymatic reactions, therefore eliminating the time-consuming and costly development of specific antibodies or fluorescent labels. It also requires minimal sample preparation compared to standard liquid chromatography–MS techniques and has relatively high tolerance to contaminants. All these characteristics contribute to making MALDI-TOF MS a versatile addition to the drug-discovery toolbox.
Development of the protocol
In 2014, Ritorto et al. employed MALDI-TOF MS to characterize the in vitro activity of a panel of 32 DUBs and the selectivity of 11 DUB inhibitors31. This method, which we have termed the MALDI-TOF DUB assay, is based on the detection of the free ubiquitin signal that results from DUB activity toward ubiquitin dimers. The use of heavy labeled 15N ubiquitin as an internal standard circumvents MALDI-TOF MS spot-to-spot variability and allows one to quantify and normalize each data point. The method was initially performed in standard 0.5-ml tubes and was therefore low throughput in nature. Here we report a HT version of the original MALDI-TOF DUB assay, which we adapted to employ a nanoliter-pipetting system, fast automatic detection and semi-automatic data analysis41,73,74,75 (Fig. 3). Since the original publication31, the panel of active DUBs has been expanded to include 50 active DUBs, representing 2/3 of those predicted to be active and six out of the seven DUB families that are currently known (USP, OTU, JAMM, UCHs, MJD and MINDY) (Fig. 2 and Table 1). A range of physiological substrates (and pseudo-substrates) has also been used to meet the specific requirements of those DUBs that are not able to cleave ubiquitin dimers. For example, the UCH DUB family, found to cleave ubiquitin from small N-terminal–linked leaving groups76, is now included in the DUB panel following the use of a modified substrate that encodes an extra tryptophan at the ubiquitin C terminus (Ub-W). The UCH-mediated cleavage of the C-terminal–linked tryptophan is detected by MALDI-TOF MS, and therefore the activity of this class of enzymes can now be established. Longer ubiquitin chains have also been introduced to accommodate DUBs shown to preferably cleave long poly-ubiquitin chains. For example, the human SARS-CoV papain-like protease DUB has negligible activity toward K48-linked ubiquitin dimers but efficiently processes tetra- and tri-ubiquitin chains77. MINDY-1, a member of the recently discovered MINDY family, also cleaves longer K48 ubiquitin chains more efficiently than it does shorter substrates32. The combination of HT scalability and the support of prominent research groups in the ubiquitin field paved the way for the evolution of the MALDI-TOF DUB assay. In 2017, the first MALDI-TOF MS–based ‘DUB Profiling Service’, within the MRC Protein Phosphorylation and Ubiquitylation Unit at the University of Dundee, was launched to allow academic and pharmaceutical scientists to screen for and assess the selectivity and potency of DUB inhibitors.

Incubation time and workflow possible pause points are indicated as clock and hourglass symbols, respectively. The compound library is delivered by using an acoustic liquid-handling system (Stage 1) and pre-incubated with the enzyme of interest for 5–30 min at room temperature (Stage 2). The substrate is added to initiate the reaction (Stage 3), and the reaction is incubated for 30–60 min. The reaction is stopped by adding trifluoroacetic acid (TFA) (Stage 4). The procedure can be paused here for ≤48 h. Assay plates are spotted onto the 1536 AnchorChip MALDI target (Stage 5) and analyzed by MALDI-TOF MS (Stage 6). Data are exported and analyzed for positive hit identification (Stage 7). Intens., intensity.
Overview of the procedure
The number and range of enzymes and substrates available within the DUB Profiling Service allow the identification of both highly specific and promiscuous DUB inhibitors and activators. High specificity is usually a desirable requirement for compounds intended as therapeutic molecules. However, alternative applications, including the identification of chemical scaffolds to be used as research tools (i.e., activity-based probes), might require the identification of family-specific or promiscuous compounds. Depending on the nature of the research project, the strategy can be adapted to meet the intended goals. Here we describe a standard drug-discovery project that starts with the identification of a specific DUB as a potential drug target (Fig. 4). First, the activity of the target is carefully evaluated to identify the ideal enzyme and substrate concentrations and incubation times that will produce a free ubiquitin signal in a linear fashion so that inhibition levels can be accurately extrapolated during data analysis (Steps 1–7 of the procedure). A reaction progress curve should be obtained by incubating increasing quantities of the selected DUB and the substrate to measure product formation over a period of time. Once the enzymatic reaction has been stopped by trifluoroacetic acid (TFA), the nanoliter-pipetting system (Mosquito TTP Labtech or available alternative) is used to mix sample, 2,5-dihydroxyacetophenone (DHAP) matrix and 15N ubiquitin and to spot the mixture on the MALDI target (Steps 8–20 of the procedure). Data are acquired by using an automatic MALDI-TOF MS procedure (Steps 21–33 of the procedure). The drug-discovery step is initiated by HT acoustic delivery of the compounds from a suitable compounds library (Stage 1 of Fig. 3). Compounds are incubated with the enzyme of interest (Steps 34–36 of the procedure and Stage 2 of Fig. 3). The reaction is started by the addition of a ubiquitin dimer (or trimers, tetramers, etc.) of suitable linkage (Steps 38 and 39 of the procedure and Stage 3 of Fig. 3; see Table 1 for substrate indications). Finally, the reaction is stopped by adding TFA (Steps 40 and 41 of the procedure and Stages 4 and 5 of Fig. 3), and data are analyzed for the identification of positive hits (Steps 42–49 of the procedure and Stages 6 and 7 of Fig. 3). The 384-well plate format is typically used for large-compound screening, and up to 3,072 data points can be acquired daily (Fig. 3). These output values could potentially be increased by applying emerging 1,536-well plate liquid-handling technology, but this technology is not discussed further here. Positive hits are confirmed by technical replicates, and compound potencies are assessed by dose-response analysis, allowing calculation of half-maximal inhibitory concentration (IC50) values (see also Anticipated results). Cherry-picked positive hits are then tested against the entire DUB panel to assess their specificity and can be evaluated within the same phylogenetic family and across six out of the seven DUB families (previously optimized following Steps 1–7 of the procedure). This approach allows researchers to identify compounds that are distributed along the entire specificity spectrum and use compounds with distinct characteristics for different purposes.

Drug discovery workflow for identification and characterization of selective DUB inhibitors.
Advantages and limitations
The MALDI-TOF DUB assay has several advantages compared to other, mainly fluorescence-based, approaches. The first advantage is the use of physiological substrates. The applicability of the MALDI-TOF DUB assay relies on the recent advancement in biochemical strategies to prepare large quantities of specific ubiquitin chain types and lengths78,79,80. High-purity M1, K11-, K48- and K63-linked ubiquitin dimers, trimers and tetramers can now be easily produced and purified on a large enough scale to enable material-intensive experiments (HTS might require up to hundreds of micrograms of substrate per 384-well plate). This also provides extensive flexibility for investigating the activity of DUBs belonging to different families, as certain DUBs have characteristic ubiquitin chain linkage preferences. The use of a substrate that is likely to be physiological is particularly relevant for some linkage-specific DUBs. For example, AMSH, a member of the JAMM family, requires the presence of a K63-linked proximal ubiquitin to efficiently cleave K63 chains. The use of K63 dimers is therefore necessary to investigate this particular enzyme. Several members of the OTU family (OTULIN, OTUD1, OTUB1, OTUB2, A20 and VCPIP1) are also linkage specific, and their activity is better assessed with the use of the specific ubiquitin linkages. Moreover, the two recently discovered DUB families, MINDYs and ZUSFP, are also highly linkage specific and require the use of K48 and K63 chains, respectively.
The second advantage of the MALDI-TOF DUB assay is its scalability to HT formats. Physiological substrates (ubiquitin dimers/trimers, etc.) are routinely used in SDS–PAGE and antibody-based methods (western blot) to qualitatively profile DUB linkage preferences in vitro81. However, gel and western blot–based assays are time consuming and difficult to scale up to achieve thousands of data points per day. The easy sample preparation in conjunction with the use of 384/1,536-well plate formats make the MALDI-TOF DUB assay the easiest method for achieving medium- and HT assessment of compounds while usinging physiological substrates.
The MALDI-TOF DUB assay also has limitations, mostly related to the compatibility of assay buffers with the MS readout. When considering the method, it is important to bear in mind that the presence of salts, detergents and cryoprotectants in the reaction buffer might interfere with the MS signal82. In particular, the formation of sodium chloride adducts reduces the overall signal intensity and could potentially affect the accuracy of the quantification. Such problems can be encountered when dealing with enzymes that have particularly low activity, cannot be stored at high concentrations or are unstable in MS-compatible buffers. To circumvent this limitation, a high-throughput ‘on-target’ washing procedure proved to diminish ion suppression and adduct formation65 could be applied in the MALDI-TOF DUB assay. Other limitations include the equipment cost and level of skill required to operate the machinery. Although for fluorescence-based approaches, the availability of an adequate plate reader and a well-instructed technician might be the basic requirements, the MALDI-TOF–based assay demands more expensive instrumentation (i.e., a nanoliter-liquid-handling system and MALDI-TOF mass spectrometer) and the support of qualified operators and facilities.
Applications
The wide detection range of the MS-based read-out makes the MALDI-TOF DUB assay intrinsically versatile. In fact, it can be readily used for both drug-discovery and basic research purposes. Soon after the publication of the original method31, the MALDI-TOF DUB assay was used to characterize the activity of the UCH family of DUBs. These enzymes display no activity against ubiquitin dimers of any of the eight linkage types but are able to cleave ubiquitin from substrates with small unstructured leaving groups28,83,84. In 2015, the Hay group used biochemical tools and the MALDI-TOF DUB assay and discovered that UCH DUBs are capable of cleaving peptide-linked N-terminal mono-ubiquitin from several protein substrates76. The current HTS platform has also been extensively used to characterize compound selectivity in vitro74,75,85,86. In 2017, Kategaya et al. used both NMR and HT-activity-based screening to identify USP7 catalytic domain-binding fragments. Within this drug-discovery effort, the DUB MALDI-TOF MS–based assay was used to characterize the selectivity of the more potent hits, GNE-6640 and GNE-677675. The MALDI-TOF DUB assay has been applied to study the impact of ubiquitin phosphorylation on DUBs-mediated cleavage73 and to characterize a new and distinct deubiquitylating enzyme, ZUP138. In June 2019, the successful collaboration between the DUB Profiling Service, the University of Dundee Drug Discovery Unit and Corbin Therapeutics resulted in the licensing of novel small molecule inhibitors of USP15 to develop possible new treatments for neuroinflammation-based disorders, including multiple sclerosis. More recently, the MALDI-TOF DUB assay has been used to shed light on the emerging field of non-canonical deubiquitylation. The DUB panel has been tested against two model substrates, consisting of ubiquitin linked through either isopeptide or ester bonds to a lysine or a threonine, respectively41 (see also Fig. 3). This led to the discovery of the peculiar and highly specific esterase activity of JOSD1, a member of the MJD DUB family41.
Alternative methods
Several fluorescence-based substrates are available to determine in vitro DUB activity. Ubiquitin-7-amido-4-methylcoumarin (Ub-AMC), ubiquitin-rhodamine-110-glycine (Ub-Rho) and the fluorescent polarization–based substrate Ub-KG(TAMRA). Other alternatives are represented by fluorescence resonance energy transfer substrates87 and ubiquitin fusion with the reporter enzyme phospholipase A288. Most of these fluorescent substrates are commercially available, user friendly and amenable for HTS. However, they are prone to fluorescent artefacts and compound interference89,90 and do not resemble physiological ubiquitin linkages and topology. In particular, Ub-AMC and Ub-Rho are not true mimetics of ubiquitin modifications, as they do not contain an isopeptide linkage. The linkage between ubiquitin and the TAMRA moiety in the Ub-KG(TAMRA) substrate is an isopeptide bond91, but Ub-KG(TAMRA) lacks the presence of a proximal ubiquitin or substrate and is therefore no closer to a genuine DUB substrate than Ub-AMC or Ub-Rho. Ub-AMC and Ub-Rho have been successfully used with many of the USP family members in HTS campaigns42 and to determine cleavage kinetics. However, many DUBs, belonging to the JAMM, OTU, MINDY, MJD and ZUP1 families, are incompatible with these substrates. In addition, the use of a mono-ubiquitin substrate in HTS campaigns could preclude the detection of active compounds that interfere with binding domains other than the S1 site. More advanced di-ubiquitin fluorescence resonance energy transfer probes, comprising all seven isopeptide linkages, have been reported92. These new probes have been used for quantifying the activity and specificity of DUBs by means of Michaelis–Menten kinetics. Such substrates represent more physiological ubiquitin substrates; however, the economic and technical feasibility of a large-scale synthesis, the impact of fluorescent artefacts and consequently the applicability to HTS have not yet been assessed.
Another alternative approach is the use of RapidFire MS. This technology comprises a fast, robotic sample preparation followed by ESI MS detection. Similarly to MALDI-TOF MS, Rapid Fire systems have the advantage of using unlabeled substrates. However, the high sensitivity of the ESI detection to contaminants demands a prior sample cleaning and concentration step that pushes the sample rate in the 7–13 s range93, much higher than the ~1.5 s currently required for the detection of ubiquitin by the Rapiflex MALDI-TOF mass spectrometer. Recently reported RapidFire BLAZE methodology limits the time of small molecule detection down to 2.5 s per sample94, even higher than the MALDI-TOF MS–based detection, but the applicability of such methods to larger molecules has not been assessed.
Experimental design
When designing and planning your experiment, it is important to note that the preliminary evaluation of experimental parameters (such as enzyme concentration, incubation time and temperature) and the reproducibility, accuracy and precision of the liquid-handling system are particularly relevant to a successful outcome. The initial optimization of enzymatic concentration and incubation time (Steps 1–7 of the procedure) is fundamental to establishing an accurate experimental routine that will minimize plate-to-plate and day-to-day variability. It is also important to note that different protein preparations (of both substrate and enzyme) might have different activities, concentration and purities. Ideally, an HTS assay should be performed by using the same batch of both enzyme and substrate, to be partitioned before use into single-use aliquots. If this is not possible, new protein batches should be tested side by side, and, when necessary, experimental conditions should be adjusted accordingly.
Besides the drug-discovery application described in this article, the MALDI-TOF DUB assay can be adapted to study the activity and specificity of DUBs toward alternative substrates such as phosphorylated ubiquitin dimers or the UCHs’ specific substrate, Ub-W (Fig. 3). The use of alternative substrates might require different internal standards or alternative quantification methods. For example, to quantify the DUB-mediated cleavage of phosphorylated ubiquitin dimers, phosphorylated 15N ubiquitin has been used73. The internal standard might also be substituted when alternative quantification and normalization methods are required. The DUB-mediated cleavage of the alternative substrate Ub-W (Fig. 3) will result in the appearance of a substrate peak (Ub-W) and a product peak (Ub). To quantify the percent cleavage, a standard curve with a known amount of product and substrate can be performed before the assay. This will allow the translation of the ratio of observed ubiquitin substrate to ubiquitin into percent cleavage for accurate enzymatic activity quantification.
Materials
Reagents
Critical
It is essential to use MS-quality solvents for all stages.
-
DHAP (Tokyo Chemical Industry, cat. no. D1955)
-
Acetonitrile (Merck, cat. no. 1.00030.2500)
Caution
Acetonitrile is highly flammable and toxic.
-
Ammonium citrate dibasic (Fluka, cat. no. 09833)
Caution
Ammonium citrate causes serious eye irritation.
-
Orange G (Sigma-Aldrich, cat. no. O7252-100G)
-
Ethanol (Fisher Scientific, cat. no. E/0650DF/C17)
Caution
Ethanol is highly flammable.
-
Isopropanol (Merck, cat. no. 1.09634.2500)
Caution
Isopropanol is highly flammable and an irritant to eyes.
-
Dimethyl sulfoxide (DMSO; Sigma-Aldrich, cat. no. D8418)
-
DTT (Formedium, cat. no. DTT010)
Caution
DTT is a skin/eye irritant.
-
Assay plate—384-well microplate, polystyrene (PS), small volume, hibase, white (Greiner Bio-One, cat. no. 784904)
-
Mixing plate—384-well designed for low-volume serial dilution (LSVD) plate, non-sterile polypropylene (TTP Labtech, cat. no. 4150-05828)
-
Reservoir plate—microplate 384 V-bottom polypropylene (V-PP), Protein LoBind (Eppendorf, order no. 0030 624.300)
-
Protein calibration standard I (Bruker Daltonics, cat. no. 8206355)
-
Silverseal sealer aluminium foil (cat. no. 676090)
-
TFA (Thermo Scientific, cat. no. 85183)
Caution
TFA is highly corrosive and should be handled in a hood by using protective eyewear and gloves.
-
Recombinant deubiquitylase enzyme (in vitro active; see Table 1)
-
Ubiquitin dimer (or trimer/tetramer), produced and purified as previously described95,96
-
15N Ubiquitin, expression and purification method provided in Supplementary Methods
-
MTP AnchorChip 1536 BC (Bruker Daltonik GmbH, part no. 8280787)
Equipment
Critical
Low-protein-binding tubes are recommended for the handling and storage of ubiquitin substrates.
-
Rapiflex MALDI-TOF mass spectrometer (Bruker; equipped with Compass software for FlexSeries 2.0)
-
FlexControl software (Bruker)
-
FlexAnalysis software (Bruker)
-
Perkin Elmer Envision 2104 microplate reader
-
UW Ultrawave QS18 ultrasonic cleaning bath
-
20 cm × 13 cm × 4 cm stainless steel box (for sonicating the MALDI target)
-
FluidX, XRD-384 reagent dispenser
-
TTP Labtech Mosquito HTS equipped with five-position plate deck
-
16-channel electronic VIAFLO pipette, 2- to 50-µl volume range and appropriate tips
Reagent setup
DHAP matrix
Weigh 7.6 mg of DHAP matrix in a 1.5-ml tube. Resuspend the DHAP matrix in 375 µl of 100% (vol/vol) ethanol (liquid chromatography-MS grade). Weigh 25 mg of diammonium hydrogen citrate in a 1.5-ml tube. Resuspend diammonium hydrogen citrate in 1 ml of Milli-Q water. Add 125 µl of the aqueous diammonium hydrogen citrate to the ethanol/DHAP matrix solution. Shake the mixture for ≥1 h. The matrix solution can be stored for ≤1 week at room temperature (20–25 °C). Do not store at +4 or −20 °C.
Reaction buffers
Enzyme buffer (40 mM Tris pH 7.5, 0.01% (wt/vol) BSA, 1 mM DTT or TCEP)
To prepare 50 ml of enzyme buffer, mix 2 ml of 1 M Tris-HCl stock solution and 50 µl of 10% (wt/vol) BSA. Bring to volume with Milli-Q water. Keep on ice. If required, add 100 µl of 0.5 M TCEP or DTT before use and agitate gently by inversion. The buffer should be made up fresh before use.
Critical
DTT and TCEP are strong nucleophiles and may therefore compete for the compound with the active cysteine of the DUBs. Carefully evaluate DTT or TCEP presence in the reaction buffer depending on the DUB and compound library in use. Enzymatic activity should be evaluated in the presence or absence of a reducing agent in a side-by-side comparison (Steps 1–7 of the procedure). The use of reducing agents in HTS might produce false-positive and -negative hits. For example, compounds like BAY11-7082 or NSC112200 might be inactivated in the presence of reducing agents, resulting in false negatives. Other chemical scaffolds, with redox potential, could generate hydrogen peroxide that will oxidize the DUB active cysteine, thus producing a false-positive result.
Substrate buffer (40 mM Tris pH 7.5, 0.01% (wt/vol) BSA)
The substrate buffer is t be prepared as for the enzyme buffer (without the DTT or TCEP) and kept on ice until use. The substrate buffer should be made up fresh before use.
Stopping solution (6% (vol/vol) TFA solution)
To prepare 100 ml of stopping solution, add 6 ml of 100% (vol/vol) TFA to 94 of Milli-Q water. Agitate gently and keep on ice until use. The stopping solution can be stored at 4 °C for up to several weeks.
Heavy labeled ubiquitin (15N ubiquitin)
A detailed method for 15N ubiquitin expression and purification is reported in Supplementary Methods. Heavy labeled ubiquitin can be diluted in Milli-Q water.
Substrate solution
The substrate solution consists of a ubiquitin dimer (or trimer/tetramer) of a suitable linkage for the enzyme of interest (e.g., K48 ubiquitin dimer for OTUB1) or alternative substrate (e.g., Ub-W or chemoenzymatically synthesized ubiquitylated threonine model substrate (Ub-T)). In the reported protocol, all ubiquitin dimers have been prepared to achieve a final concentration of 0.1 mg/ml; see Fig. 2 and Table 1 for substrate compatibility and recommendations. To prepare the substrate solution, dilute the substrate by using substrate buffer solution. Substrate solution can be stored at 4 °C for several days.
Equipment setup
Clean MALDI target (AnchorChip or ground steel)
-
Place the MALDI target (384 or 1536 AnchorChip) in a stainless steel box of adequate size. Pour enough 100% (vol/vol) isopropanol to cover the target surface. Place the box in the ultrasonic bath and sonicate for 2 min.
-
Remove the isopropanol and pour a 30% acetonitrile, 0.1% (vol/vol) TFA solution onto the target to completely cover it.
-
Sonicate for 2 min and then dry the MALDI target plate by using a stream of high-purity nitrogen.
FluidX, XRD-384 reagent dispenser quality control
Before starting the main procedure, the liquid-handling heads of the XRD-384 should be tested for accuracy by using the absorbance of Orange G. The XRD-384 reagent dispenser quality control procedure should be repeated over four assay plates, as this represents the basal HTS unit (up to four assay plates can be spotted on a 1536 AnchorChip MALDI target). A coefficient of variation (CV) ≤5% is considered acceptable. If the CV is >5%, a new cassette should be used.
-
Load FluidX XRD with a 16-channel tubing cartridge. Prime with Milli-Q water for 10 s and then empty.
-
Prepare 10 ml of 1 mM Orange G solution.
-
Prime the 16-channel tubing cartridge with 1 mM Orange G for 5 s and ensure that no drips have formed on the cartridge tips.
-
Set XRD-384 to dispense 3 µl across all 24 columns of the assay plate.
-
Position the assay plate on the stage of the XRD-384 and dispense 3 μl of Orange G. Remove the plate from the stage.
-
Repeat Step 5 for three further assay plates.
-
Empty the tubing of Orange G.
-
Prime with Milli-Q water for 10 s and then empty the tubing. Prime with 100% ethanol for 10 s and then empty the tubing. Prime with Milli-Q water again for 10 s and then empty the tubing.
-
Prime the tubing with Milli-Q water for 5 s and ensure that no drips have formed on the tips of the cartridge.
-
Set XRD-384 to dispense 47 μl of Milli-Q water across all 24 columns of the 384-well plate.
-
Dispense 47 μl of Milli-Q water across all 384-well plates.
-
Spin down (50g, 30 s) 384-well plates to recover any drips on the well sides.
-
Read absorbance at 405 nM on an Envision plate reader (or similar).
-
Calculate the column, row and whole plate CV (%), as well as percent swing from the plate mean.
Procedure
Measuring the reaction progress curve (enzyme linearization)
Timing 1–2 h
-
1
Prepare serial dilutions of the enzyme of interest (e.g., 1250\625\312\156\80\40 nM final) in enzyme buffer (see ‘Reagent setup’).
-
2
Aliquot 3 µl of the enzyme dilutions in an assay plate. As the reaction is to be evaluated over a period of time, consider assessing at least five to six time points, including time zero (e.g., 0, 15, 30, 45 and 60 min).
-
3
Prepare the zero-time-point sample by adding TFA to a final concentration of 2% (vol/vol). This time point sample will represent the ‘background level’.
-
4
Cover the assay plate by using an aluminium sealing foil to prevent evaporation.
-
5
Incubate the assay plate at room temperature (20–25 °C) for 5 min.
-
6
Add 3 µl of the substrate to the assay plate by using a multi-channel pipette.
-
7
At the selected time points, stop each reaction by adding 3 µl of TFA to a final concentration of 2% (vol/vol).
Spotting on the MALDI target by using a TTP Labtech Mosquito
Timing ~0.5 h/384-well plate
-
8
Calibrate the TTP Labtech Mosquito by running the calibration wizard program and following the onscreen prompts.
Critical step
Accurate calibration of the nanolitrer-pipetting system is fundamental to ensure optimal mixing and spotting on the MALDI target.
-
9
Aliquot a sufficient amount of DHAP and 15N ubiquitin into a reservoir plate (Fig. 5) and cover the plate with aluminium sealing foil to prevent evaporation.
Fig. 5 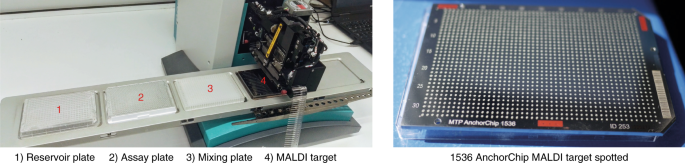
TTP Labtech Mosquito setup for MALDI target spotting.
Critical step
DHAP matrix preparation is saturated and will have some residual insolubilized material. Do not transfer insoluble DHAP matrix from the 1.5-ml tube to the reservoir plate, as this will block TTP Labtech Mosquito tips. Ensure that there is ample dead volume (~7 μl) for each stock well on the reservoir plate.
-
10
Position the reservoir plate on deck position 1.
-
11
Position the assay plate on deck position 2.
-
12
Position the mixing plate on deck position 3.
-
13
Position the MTP AnchorChip 1536 BC MALDI target on deck position 4.
-
14
Aliquot 1,050 nl of assay plate column 1 into mixing plate column 1.
-
15
Add 500 nl of 15N ubiquitin to mixing plate column 1.
-
16
Add 1.2 µl of DHAP matrix to mixing plate column 1.
-
17
Mix thoroughly by using 2 × 10 mixing cycles of 1,000 nl.
Critical step
Although time consuming, extensive mixing cycles are required to activate the formation of sample/DHAP matrix crystals and ensure an optimal MALDI-TOF MS signal. The number of mixing cycles and the volume can be adjusted depending on sample concentration and complexity.
-
18
Spot 260 nl on the MTP AnchorChip 1536 MALDI target.
-
19
Repeat Steps 7–9 for all subsequent assay plate columns.
Critical step
As the DHAP matrix is prepared with 75% (vol/vol) ethanol, the evaporation of mixed samples is time sensitive. The mixture of sample and matrix must be immediately spotted onto the MALDI target before the next steps can take place.
-
20
Let the spots dry completely at room temperature.
Critical step
Once spotted, the reaction mixture should be analyzed as soon as possible to avoid degradation of the sample.

Automatic MALDI-TOF MS analysis
Timing ~0.5–1 h/1,536-well plate
-
21
Launch FlexControl and select a fingerprint (.par file) Reflectron Positive acquisition method focused on a window between 8 and 9 kDa.
-
22
Insert the freshly spotted MALDI target onto the MALDI target plate carrier and push it into the load port until it reaches the end position.
Critical step
Make sure that the target is inserted correctly with the cutoff corner facing the load door.
-
23
Press the loading button and start plate docking.
-
24
Select the appropriate MALDI target geometry (e.g., MTP AnchorChip 1536 BC or 384 BC).
-
25
Wait for system status to appear as ‘Ready’ and for the high vacuum pressure to reach values in the 5.5 × 10⁻⁷ mbar range.
Critical step
When vacuum pumps are performing optimally in a Rapiflex MALDI-TOF MS system (absence of sealing leaks or of poor pump performance), the high pump should take no longer than 10 min to reach ideal vacuum pressure for MALDI-TOF MS analysis. High percentage air humidity will affect the time required for reaching adequate high vacuum pressure.
-
26
Teach the sample carrier by using the anchor points in position X, Y, Z. Accurate sample carrier teaching is important to ensure that all spots are detected and acquired properly.
-
27
Select a time zero point on the MALDI-plate to check instrument performances and adjust laser intensities. Time zero spots should not have any detectable mono-ubiquitin signal, as no dimer cleavage should have occurred.
-
28
Create a new mass control list and add 15N ubiquitin observed mass/charge (m/z) (typically 8,669.47 Da, although it may deviate slightly depending on the source of 15N ubiquitin).
-
29
Calibrate the instrument by using the 15N ubiquitin signal (8,669.47 m/z).
-
30
Edit the FlexControl method (Table 2).
Table 2 FlexControl method parameters -
31
Save the method and calibration.
-
32
Open FlexAnalysis and create an internal calibration FlexAnalysis method (.FAMS). Edit the method as indicated in Table 3.
Table 3 FlexAnalysis method parameters -
33
In the automation run, select ‘New’ and start a new run by using the automatic run wizard. Edit the AutoXecute method as indicated in Table 4. Both FlexAnalysis and FlexControl methods will be required in the setup of the automatic run.
Table 4 AutoXecute method parameters
MALDI-TOF DUB assay for HTS
Timing 1–1.5 h
Critical
Use FluidX XRD with 16-channel tubing cartridges to divide enzyme, substrate and TFA solutions into aliquots. Perform FluidX XRD quality control as indicated in the ‘FluidX, XRD-384 reagent dispenser quality control’ section in ‘Equipment setup’. A workflow overview is illustrated in Fig. 3.
-
34
Distribute aliquots of the compound library into assay plates by using non-contact acoustic delivery (Fig. 3, Stage 1). Reserve two assay plate columns for both positive (DMSO only) and negative (no enzyme) controls.
Pause point
The sealed assay plate containing the compound library can be stored at 4 °C for ≤1 week.
-
35
Distribute 3-µl aliquots of enzyme (at the optimized concentration) into each assay plate column except for the negative control column.
-
36
Distribute 3-µl aliquots of enzyme buffer into the negative control column.
-
37
Cover the plate with aluminium sealing foil to prevent evaporation and incubate at room temperature for 5–30 min.
-
38
Add 3 µl of substrate to each column of the entire assay plate.
-
39
Cover the assay plate with aluminium sealing foil to prevent evaporation and incubate at room temperature for the time suggested by the reaction progression curve (generally 30–60 min).
-
40
Stop the reaction by adding 3 µl of TFA at a final concentration of 2% (vol/vol) to each column.
Pause point
Plates can be covered with aluminium sealing foil and stored at room temperature for ≤48 h.
-
41
Spot the assay plates on a 1536 AnchorChip MALDI target as indicated in Stage 5 of Fig. 3.
Critical step
If the plates are left for >12 h before spotting, a new foil seal should be applied.
Pause point
The spotted MALDI target can be stored inside the target box, covered and left at room temperatur for ≤48 h. A longer time gap may result in reduced MS signal intensity and peak resolution (Supplementary Fig. 2).
-
42
Analyze by MALDI-TOF MS by using the automated run mode (Steps 21–33 of the procedure); see Box 1 and Fig. 6 for more detailed information.
Fig. 6: Linearity of MALDI-TOF MS ubiquitin and 15N ubiquitin detection. 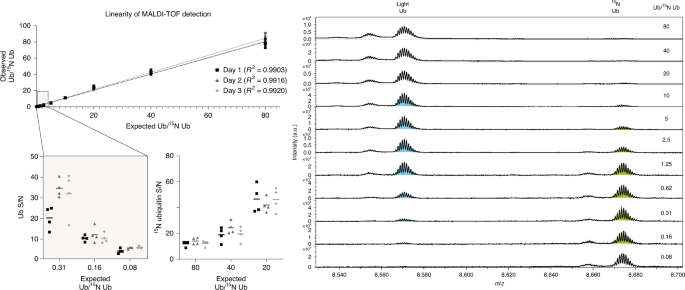
11 ubiquitin serial dilutions were prepared as previously described31, and representative spectra are shown. S/N of the three higher and lower dilutions are enlarged. Ub, ubiquitin.

Statistical analysis for the HT MALDI-TOF DUB assay
Timing 0.5 h
-
43
Open the FlexAnalysis software and select the folder containing the raw data of interest. At least one spectrum needs to be opened to allow FlexAnalysis to perform all the subsequent analysis steps.
-
44
In the FlexAnalysis software, open the ‘Method’ menu and select the ‘zero’ script.
-
45
Modify the destination folder and result file name as desired, save the modified script and use the batch process for analyzing data. The zero script will export mass areas of each spot from the raw data into a .csv column format. For the negative controls, the zero script considers the area of the background noise detectable in the ubiquitin m/z window (see Boxes 1 and 2 for more information)
-
46
Copy and paste the zero script output columns (spectrum, compound, m/z, signal-to-noise ratio (S/N), resolution and area) into the input sheet of the baseline data check file.
-
47
Convert the output zero deleted sheet (last sheet of the baseline data check file) to .txt plain format.
-
48
Drag the text file onto the Grid.exe file. The script will produce a new file with ‘GRID’ included in the file name. The GRID file will select ubiquitin and 15N ubiquitin area values and report them in the same position as spotted on the MALDI plate.
-
49
Calculate the area ratio of ubiquitin to 15N ubiquitin.
-
50
Evaluate data quality by calculating Z′ scores (Box 2).
Troubleshooting
Troubleshooting advice can be found in Table 5.
Timing
-
Steps 1–7, measuring the reaction progress curve (enzyme linearization): 1–2 h
-
Steps 8–20, spotting on the MALDI target by using a TTP Labtech Mosquito: ~0.5 h/384-well plate
-
Steps 21–33, automatic MALDI-TOF MS analysis: 0.5–1 h/1,536-well plate
-
Steps 34–42, MALDI-TOF DUB assay for HTS: 1–1.5 h
-
Steps 43–50, statistical analysis for the HT MALDI-TOF DUB assay: 0.5 h
Anticipated results
Here we present the HT adaptation of the MALDI-TOF DUB assay previously published in 2014 (ref. 31). As MALDI-TOF MS signals have intrinsically high peak-intensity variability, all the data reported here are normalized by dividing the area of the ubiquitin signal over the area of the 15N ubiquitin signal. This normalized value can then be translated to percent cleavage or percent activity to facilitate data interpretation and graphical representation. Because of the nature of the assay, continuous reading of the reaction progression is not possible. It is, therefore, fundamental to optimize reaction parameters, such as enzyme and substrate concentration, incubation times and temperatures, by performing a reaction time course experiment (progress curve) before beginning inhibitor or activator screening. To easily quantify inhibition and activation effects on the enzyme of interest, the reaction should be followed at the initial stage, when an excess of substrate will result in linear product formation. At later stages, the reaction slows down and finally ceases, because of depletion of substrates or enzyme instability, producing misleading inhibition/activation results. Therefore, it is important that only the linear part of the progress curve is considered for evaluation. To optimize enzyme concentration and incubation time, different enzyme concentrations are tested at several time points. For this purpose, the ubiquitin dimer (or other substrate) is incubated with an increasing concentration of the DUB of interest to determine optimal enzyme concentration and incubation time (Fig. 7). The assay reaction simply consists of the recombinantly expressed DUB of interest, the ubiquitin dimer of selected linkage (0.1 mg/ml final) and BSA carrier (0.01% wt/vol) in a 40 mM Tris–HCl pH 7.5 buffer. All the DUBs present in the panel have had their enzymatic concentration and incubation time selected to achieve optimal performances with the same substrate final concentration (0.1 mg/ml). Such a strategy facilitates the selectivity assessment procedure, when dozens of different DUB preparations are to be tested daily. In selecting the preferred substrate (ubiquitin linkage and ubiquitin chain length) for HTS purposes, one must consider both the efficiency of the enzymatic cleavage and the feasibility (both economic and technical) of substrate protein preparation. Figure 7a shows representative results of an enzyme kinetic evaluation of USP30, tested at seven concentrations ranging from 40 to 1,250 nM. High enzyme concentrations result in excessively fast substrate consumption (>40% at 45 min), increased variability between technical replicates and limited linearity range. The rate of substrate consumption no longer increases with doubling the amount of enzyme (i.e.. 1,250 nM and 625 nM consumed similar amounts of substrate at 45-min incubation time), indicating that saturating conditions had been reached (Fig. 7b). At intermediate concentration (156 nM), the USP30 substrate consumption rate is optimal (<20% at 45 min), with reduced variability between technical replicates and a linear increase in substrate consumption compared to lower dilutions (Fig. 7b). Further enzyme dilution results in poor linearity range, excessively low substrate consumption and increased data variability.

a, USP30 activity was assessed at seven different concentrations over five time points. The substrate concentration was kept constant at 0.1 mg/ml. Ubiquitin/15N ubiquitin ratios are translated in percentage of cleavage by using Eq. 1. n = 2, spotted in technical replicates; errors bars = s.d. b, Details of cleavage (%) at 45-min incubation time.
Once the enzyme of interest has been characterized, it can be used for HTS. In Fig. 8a, representative results of a successful screening of a 384-compound plate are shown: both the positive and negative control columns have no missing data points and reduced variability, resulting in a Z′ of 0.8. Positive hits can therefore be unambiguously identified. The level of inhibition required to determine a positive hit depends on the nature of the compound library and the compound’s final concentration. For example, compounds able to reduce the enzyme activity >40% can be selected to be further characterized. In Fig. 8b, we provide an example of a failed assay plate (Z′ < 0.5). The low scoring is related to the presence of missing spots in the control columns and high variability among the available data points (see also Statistical analysis). In Fig. 8c, we show Z′ score distribution of two HTS campaigns against USP30 and AMSH-LP. The MALDI-TOF DUB assay can be used for characterizing compound potency.

a, Successful 384-well plate experiment results (Z′ = 0.8), with positive hits (percent activity <50%) indicated. b, Unsuccessful 384-well plate (Z′ < 0.5) experiment results. Crossed-out squares indicate missing values (absence of 15N ubiquitin signal). White squares indicate zero values (absence of ubiquitin signal). c, Z′ score distribution representative of two screenings against USP30 and AMSH-LP. d, Statistical summary of USP30 and AMSH-LP screenings. NC, negative control; PC, positive control,.
In Fig. 9, representative results of an IC50 experiment are shown: the inhibition pattern is clearly visible, and compounds can be classified based on their potency (i.e., compound 1 is less potent than compound 8). 51 DUBs are currently available for both compound library screening and specificity studies (Table 1; https://dub-screen.mrc.ac.uk/).

The compounds were tested at increasing concentrations against the target DUB. Positive control (PC): only DMSO. Negative control (NC): no enzyme.
Reporting Summary
Further information on research design is available in the Nature Research Reporting Summary linked to this article.
Data availability
The data that support the anticipated results are available from the corresponding author upon reasonable request. Other inquiries can also be submitted at https://dub-screen.mrc.ac.uk/.
Code availability
The in-house scripts are publicly available in GitHub at https://github.com/Vdecesare/GRID-script.git and https://github.com/Vdecesare/Zero-Script.git.
References
Hershko, A., Heller, H., Elias, S. & Ciechanover, A. Components of ubiquitin-protein ligase system. Resolution, affinity purification, and role in protein breakdown. J. Biol. Chem. 258, 8206–8214 (1983).
Komander, D. & Rape, M. The ubiquitin code. Annu. Rev. Biochem. 81, 203–229 (2012).
Ye, Y. & Rape, M. Building ubiquitin chains: E2 enzymes at work. Nat. Rev. Mol. Cell Biol. 10, 755–764 (2009).
Schulman, B. A. & Harper, J. W. Ubiquitin-like protein activation by E1 enzymes: the apex for downstream signalling pathways. Nat. Rev. Mol. Cell Biol. 10, 319–331 (2009).
Michelle, C., Vourc’h, P., Mignon, L. & Andres, C. R. What was the set of ubiquitin and ubiquitin-like conjugating enzymes in the eukaryote common ancestor? J. Mol. Evol. 68, 616–628 (2009).
Deshaies, R. J. & Joazeiro, C. A. RING domain E3 ubiquitin ligases. Annu. Rev. Biochem. 78, 399–434 (2009).
Metzger, M. B., Hristova, V. A. & Weissman, A. M. HECT and RING finger families of E3 ubiquitin ligases at a glance. J. Cell Sci. 125, 531–537 (2012).
Yau, R. & Rape, M. The increasing complexity of the ubiquitin code. Nat. Cell Biol. 18, 579–586 (2016).
Husnjak, K. & Dikic, I. Ubiquitin-binding proteins: decoders of ubiquitin-mediated cellular functions. Annu. Rev. Biochem. 81, 291–322 (2012).
Thrower, J. S., Hoffman, L., Rechsteiner, M. & Pickart, C. M. Recognition of the polyubiquitin proteolytic signal. EMBO J. 19, 94–102 (2000).
Chen, Z. J. & Sun, L. J. Nonproteolytic functions of ubiquitin in cell signaling. Mol. Cell 33, 275–286 (2009).
Kulathu, Y. & Komander, D. Atypical ubiquitylation—the unexplored world of polyubiquitin beyond Lys48 and Lys63 linkages. Nat. Rev. Mol. Cell Biol. 13, 508–523 (2012).
Jiang, Y., Su, S., Zhang, Y., Qian, J. & Liu, P. Control of mTOR signaling by ubiquitin. Oncogene 38, 3989–4001 (2019).
Pao, K. C. et al. Activity-based E3 ligase profiling uncovers an E3 ligase with esterification activity. Nature 556, 381–385 (2018).
Kelsall, I. R., Zhang, J., Knebel, A., Arthur, J. S. C. & Cohen, P. The E3 ligase HOIL-1 catalyses ester bond formation between ubiquitin and components of the Myddosome in mammalian cells. Proc. Natl Acad. Sci. USA 116, 13293–13298 (2019).
Chua, N. K., Hart-Smith, G. & Brown, A. J. Non-canonical ubiquitination of the cholesterol-regulated degron of squalene monooxygenase. J. Biol. Chem. 294, 8134–8147 (2019).
McClellan, A. J., Laugesen, S. H. & Ellgaard, L. Cellular functions and molecular mechanisms of non-lysine ubiquitination. Open Biol. 9, 190147 (2019).
Ohtake, F. et al. Ubiquitin acetylation inhibits polyubiquitin chain elongation. EMBO Rep. 16, 192–201 (2015).
Kazlauskaite, A. et al. Parkin is activated by PINK1-dependent phosphorylation of ubiquitin at Ser65. Biochem. J. 460, 127–139 (2014).
Shiba-Fukushima, K. et al. Phosphorylation of mitochondrial polyubiquitin by PINK1 promotes Parkin mitochondrial tethering. PLoS Genet. 10, e1004861 (2014).
Okatsu, K. et al. Phosphorylated ubiquitin chain is the genuine Parkin receptor. J. Cell Biol. 209, 111–128 (2015).
Fujita, Y., Tinoco, R., Li, Y., Senft, D. & Ronai, Z. A. Ubiquitin ligases in cancer immunotherapy—balancing antitumor and autoimmunity. Trends Mol. Med. 25, 428–443 (2019).
Atkin, G. & Paulson, H. Ubiquitin pathways in neurodegenerative disease. Front. Mol. Neurosci. 7, 63 (2014).
Cohen, P. Immune diseases caused by mutations in kinases and components of the ubiquitin system. Nat. Immunol. 15, 521–529 (2014).
Popovic, D., Vucic, D. & Dikic, I. Ubiquitination in disease pathogenesis and treatment. Nat. Med. 20, 1242–1253 (2014).
Clague, M. J. et al. Deubiquitylases from genes to organism. Physiol. Rev. 93, 1289–1315 (2013).
Nijman, S. M. et al. A genomic and functional inventory of deubiquitinating enzymes. Cell 123, 773–786 (2005).
Clague, M. J., Urbe, S. & Komander, D. Breaking the chains: deubiquitylating enzyme specificity begets function. Nat. Rev. Mol. Cell Biol. 20, 338–352 (2019).
Komander, D., Clague, M. J. & Urbe, S. Breaking the chains: structure and function of the deubiquitinases. Nat. Rev. Mol. Cell Biol. 10, 550–563 (2009).
Faesen, A. C. et al. The differential modulation of USP activity by internal regulatory domains, interactors and eight ubiquitin chain types. Chem. Biol. 18, 1550–1561 (2011).
Ritorto, M. S. et al. Screening of DUB activity and specificity by MALDI-TOF mass spectrometry. Nat. Commun. 5, 4763 (2014).
Abdul Rehman, S. A. et al. MINDY-1 is a member of an evolutionarily conserved and structurally distinct new family of deubiquitinating enzymes. Mol. Cell 63, 146–155 (2016).
Mevissen, T. E. T. & Komander, D. Mechanisms of deubiquitinase specificity and regulation. Annu. Rev. Biochem. 86, 159–192 (2017).
Kristariyanto, Y. A., Abdul Rehman, S. A., Weidlich, S., Knebel, A. & Kulathu, Y. A single MIU motif of MINDY-1 recognizes K48-linked polyubiquitin chains. EMBO Rep. 18, 392–402 (2017).
Haahr, P. et al. ZUFSP deubiquitylates K63-linked polyubiquitin chains to promote genome stability. Mol. Cell 70, 165–174.e6 (2018).
Hermanns, T. et al. A family of unconventional deubiquitinases with modular chain specificity determinants. Nat. Commun. 9, 799 (2018).
Hewings, D. S. et al. Reactive-site-centric chemoproteomics identifies a distinct class of deubiquitinase enzymes. Nat. Commun. 9, 1162 (2018).
Kwasna, D. et al. Discovery and characterization of ZUFSP/ZUP1, a distinct deubiquitinase class important for genome stability. Mol. Cell 70, 150–164.e6 (2018).
Winborn, B. J. et al. The deubiquitinating enzyme ataxin-3, a polyglutamine disease protein, edits Lys63 linkages in mixed linkage ubiquitin chains. J. Biol. Chem. 283, 26436–26443 (2008).
Mevissen, T. E. et al. OTU deubiquitinases reveal mechanisms of linkage specificity and enable ubiquitin chain restriction analysis. Cell 154, 169–184 (2013).
De Cesare, V. et al. Deubiquitinating enzyme amino acid profiling reveals a class of ubiquitin esterases. Preprint at https://www.biorxiv.org/content/10.1101/2020.05.11.087965v1.full (2020).
Schauer, N. J., Magin, R. S., Liu, X., Doherty, L. M. & Buhrlage, S. J. Advances in discovering deubiquitinating enzyme (DUB) inhibitors. J. Med. Chem. 63, 2731–2750 (2020).
Harrigan, J. A., Jacq, X., Martin, N. M. & Jackson, S. P. Deubiquitylating enzymes and drug discovery: emerging opportunities. Nat. Rev. Drug Discov. 17, 57–78 (2018).
Shan, J., Zhao, W. & Gu, W. Suppression of cancer cell growth by promoting cyclin D1 degradation. Mol. Cell 36, 469–476 (2009).
Davis, M. I. et al. Small molecule inhibition of the ubiquitin-specific protease USP2 accelerates cyclin D1 degradation and leads to cell cycle arrest in colorectal cancer and mantle cell lymphoma models. J. Biol. Chem. 291, 24628–24640 (2016).
Li, M. et al. Deubiquitination of p53 by HAUSP is an important pathway for p53 stabilization. Nature 416, 648–653 (2002).
Gerlach, B. et al. Linear ubiquitination prevents inflammation and regulates immune signalling. Nature 471, 591–596 (2011).
Park, Y., Jin, H. S., Aki, D., Lee, J. & Liu, Y. C. The ubiquitin system in immune regulation. Adv. Immunol. 124, 17–66 (2014).
Ebner, P., Versteeg, G. A. & Ikeda, F. Ubiquitin enzymes in the regulation of immune responses. Crit. Rev. Biochem. Mol. Biol. 52, 425–460 (2017).
Zhou, Y. & Zhu, Y. Diversity of bacterial manipulation of the host ubiquitin pathways. Cell. Microbiol. 17, 26–34 (2015).
Lin, Y. H. & Machner, M. P. Exploitation of the host cell ubiquitin machinery by microbial effector proteins. J. Cell Sci. 130, 1985–1996 (2017).
Hermanns, T. & Hofmann, K. Bacterial DUBs: deubiquitination beyond the seven classes. Biochem. Soc. Trans. 47, 1857–1866 (2019).
Barretto, N. et al. The papain-like protease of severe acute respiratory syndrome coronavirus has deubiquitinating activity. J. Virol. 79, 15189–15198 (2005).
indner, H. A. et al. Selectivity in ISG15 and ubiquitin recognition by the SARS coronavirus papain-like protease. Arch. Biochem. Biophys. 466, 8–14 (2007).
Lin, M. H. et al. Structural and functional characterization of MERS coronavirus papain-like protease. J. Biomed. Sci. 21, 54 (2014).
Bailey-Elkin, B. A. et al. Crystal structure of the Middle East respiratory syndrome coronavirus (MERS-CoV) papain-like protease bound to ubiquitin facilitates targeted disruption of deubiquitinating activity to demonstrate its role in innate immune suppression. J. Biol. Chem. 289, 34667–34682 (2014).
Akutsu, M., Ye, Y., Virdee, S., Chin, J. W. & Komander, D. Molecular basis for ubiquitin and ISG15 cross-reactivity in viral ovarian tumor domains. Proc. Natl Acad. Sci. USA 108, 2228–2233 (2011).
Deaton, M. K., Spear, A., Faaberg, K. S. & Pegan, S. D. The vOTU domain of highly-pathogenic porcine reproductive and respiratory syndrome virus displays a differential substrate preference. Virology 454–455, 247–253 (2014).
Simeonov, A. et al. Fluorescence spectroscopic profiling of compound libraries. J. Med. Chem. 51, 2363–2371 (2008).
Baell, J. B. & Nissink, J. W. M. Seven year itch: pan-assay interference compounds (PAINS) in 2017—utility and limitations. ACS Chem. Biol. 13, 36–44 (2018).
Hsieh, F., Keshishian, H. & Muir, C. Automated high throughput multiple target screening of molecular libraries by microfluidic MALDI-TOF MS. J.f Biomol. Screen. 3, 189–198 (1998).
De Cesare, V. et al. The MALDI-TOF E2/E3 ligase assay as universal tool for drug discovery in the ubiquitin pathway. Cell Chem. Biol. 25, 1117–1127.e4 (2018).
Heap, R. E. et al. Identifying inhibitors of inflammation: a novel high-throughput MALDI-TOF screening assay for salt-inducible kinases (SIKs). SLAS Discov. 22, 1193–1202 (2017).
Beeman, K. et al. Integration of an in situ MALDI-based high-throughput screening process: a case study with receptor tyrosine kinase c-MET. SLAS Discov. 22, 1203–1210 (2017).
Winter, M. et al. Automated MALDI target preparation concept: providing ultra-high-throughput mass spectrometry-based screening for drug discovery. SLAS Technol. 24, 209–221 (2019).
Winter, M. et al. Establishing MALDI-TOF as versatile drug discovery readout to dissect the PTP1B enzymatic reaction. SLAS Discov. 23, 561–573 (2018).
Machalkova, M., Schejbal, J., Glatz, Z. & Preisler, J. A label-free MALDI TOF MS-based method for studying the kinetics and inhibitor screening of the Alzheimer’s disease drug target beta-secretase. Anal. Bioanal. Chem. 410, 7441–7448 (2018).
Haslam, C. et al. The evolution of MALDI-TOF mass spectrometry toward ultra-high-throughput screening: 1536-well format and beyond. J. Biomol. Screen. 21, 176–186 (2016).
Simon, R. P. et al. MALDI-TOF mass spectrometry-based high-throughput screening for inhibitors of the cytosolic DNA sensor cGAS. SLAS Discov. 25, 372–383 (2019).
Bladergroen, M. R. et al. Automation of high-throughput mass spectrometry-based plasma N-glycome analysis with linkage-specific sialic acid esterification. J. Proteome Res. 14, 4080–4086 (2015).
Reiding, K. R., Blank, D., Kuijper, D. M., Deelder, A. M. & Wuhrer, M. High-throughput profiling of protein N-glycosylation by MALDI-TOF-MS employing linkage-specific sialic acid esterification. Anal. Chem. 86, 5784–5793 (2014).
Jeong, H. J., Kim, Y. G., Yang, Y. H. & Kim, B. G. High-throughput quantitative analysis of total N-glycans by matrix-assisted laser desorption/ionization time-of-flight mass spectrometry. Anal. Chem. 84, 3453–3460 (2012).
Huguenin-Dezot, N. et al. Synthesis of isomeric phosphoubiquitin chains reveals that phosphorylation controls deubiquitinase activity and specificity. Cell Rep. 16, 1180–1193 (2016).
Magiera, K. et al. Lithocholic acid hydroxyamide destabilizes cyclin D1 and induces G0/G1 arrest by inhibiting deubiquitinase USP2a. Cell Chem. Biol. 24, 458–470.e18 (2017).
Kategaya, L. et al. USP7 small-molecule inhibitors interfere with ubiquitin binding. Nature 550, 534–538 (2017).
Bett, J. S. et al. Ubiquitin C-terminal hydrolases cleave isopeptide- and peptide-linked ubiquitin from structured proteins but do not edit ubiquitin homopolymers. Biochem. J. 466, 489–498 (2015).
Bekes, M. et al. SARS hCoV papain-like protease is a unique Lys48 linkage-specific di-distributive deubiquitinating enzyme. Biochem. J. 468, 215–226 (2015).
Dong, K. C. et al. Preparation of distinct ubiquitin chain reagents of high purity and yield. Structure 19, 1053–1063 (2011).
Oualid, F. E., Hameed, D. S., Atmioui, D. E., Hilkmann, H. & Ovaa, H. Synthesis of atypical diubiquitin chains. Methods Mol. Biol. 832, 597–609 (2012).
Michel, M. A., Komander, D. & Elliott, P. R. Enzymatic assembly of ubiquitin chains. Methods Mol. Biol. 1844, 73–84 (2018).
Hospenthal, M. K., Mevissen, T. E. T. & Komander, D. Deubiquitinase-based analysis of ubiquitin chain architecture using Ubiquitin Chain Restriction (UbiCRest). Nat. Protoc. 10, 349–361 (2015).
Chandler, J., Haslam, C., Hardy, N., Leveridge, M. & Marshall, P. A systematic investigation of the best buffers for use in screening by MALDI-mass spectrometry. SLAS Discov. 22, 1262–1269 (2017).
Johnston, S. C., Riddle, S. M., Cohen, R. E. & Hill, C. P. Structural basis for the specificity of ubiquitin C-terminal hydrolases. EMBO J. 18, 3877–3887 (1999).
Eletr, Z. M. & Wilkinson, K. D. Regulation of proteolysis by human deubiquitinating enzymes. Biochim. Biophys. Acta 1843, 114–128 (2014).
Weisberg, E. L. et al. Inhibition of USP10 induces degradation of oncogenic FLT3. Nat. Chem. Biol. 13, 1207–1215 (2017).
de Las Pozas, A., Reiner, T., De Cesare, V., Trost, M. & Perez-Stable, C. Inhibiting multiple deubiquitinases to reduce androgen receptor expression in prostate cancer cells. Sci. Rep. 8, 13146 (2018).
Horton, R. A., Strachan, E. A., Vogel, K. W. & Riddle, S. M. A substrate for deubiquitinating enzymes based on time-resolved fluorescence resonance energy transfer between terbium and yellow fluorescent protein. Anal. Biochem. 360, 138–143 (2007).
Nicholson, B. et al. Characterization of ubiquitin and ubiquitin-like-protein isopeptidase activities. Protein Sci. 17, 1035–1043 (2008).
Dang, L. C., Melandri, F. D. & Stein, R. L. Kinetic and mechanistic studies on the hydrolysis of ubiquitin C-terminal 7-amido-4-methylcoumarin by deubiquitinating enzymes. Biochemistry 37, 1868–1879 (1998).
Kemp, M. Recent advances in the discovery of deubiquitinating enzyme inhibitors. Prog. Med. Chem. 55, 149–192 (2016).
Geurink, P. P., El Oualid, F., Jonker, A., Hameed, D. S. & Ovaa, H. A general chemical ligation approach towards isopeptide-linked ubiquitin and ubiquitin-like assay reagents. Chembiochem 13, 293–297 (2012).
Geurink, P. P. et al. Development of diubiquitin-based FRET probes to quantify ubiquitin linkage specificity of deubiquitinating enzymes. Chembiochem 17, 816–820 (2016).
Hutchinson, S. E. et al. Enabling lead discovery for histone lysine demethylases by high-throughput RapidFire mass spectrometry. J. Biomol. Screen. 17, 39–48 (2012).
Bretschneider, T. et al. RapidFire BLAZE-mode is boosting ESI-MS toward high-throughput-screening. SLAS Technol. 24, 386–393 (2019).
Pickart, C. M. & Raasi, S. Controlled synthesis of polyubiquitin chains. Methods Enzymol. 399, 21–36 (2005).
Bremm, A. & Komander, D. Synthesis and analysis of K11-linked ubiquitin chains. Methods Mol. Biol. 832, 219–228 (2012).
Letunic, I. & Bork, P. Interactive Tree Of Life (iTOL): an online tool for phylogenetic tree display and annotation. Bioinformatics 23, 127–128 (2007).
Zhang, J. H., Chung, T. D. & Oldenburg, K. R. A simple statistical parameter for use in evaluation and validation of high throughput screening assays. J. Biomol. Screen. 4, 67–73 (1999).
Acknowledgements
We are thankful for the excellent technical support of MRC PPU Reagents and Services, with its molecular biology, protein production and MS teams. We offer special thanks to Clare Johnson for the extensive technical support and recombinant protein delivery. We also thank Bruker Daltonics and particularly Rainer Paape, Meike Hamester and Arndt Asperger for providing scripts and technical support. This work was supported by the Medical Research Council (MRC grant number MC_UU_12016) and the pharmaceutical companies supporting the Division of Signal Transduction Therapy (Boehringer Ingelheim, GlaxoSmithKline and Merck KGaA). We thank Dr. Satpal Virdee, Dr. Yogesh Kulathu and Prof. Dario Alessi for carefully proofreading the manuscript.
Author information
Authors and Affiliations
Contributions
V.D.C. and P.D. wrote the manuscript. V.D.C., J.M. and R.T. developed the technique, carried out the experiments and analyzed the data. A.K. provided protein and reagent technical support. M.S.R. and M.T. developed the initial screen. H.M., C.J.H. and P.D. supervised the project and provided funding.
Corresponding authors
Ethics declarations
Competing interests
J.M. and R.T. are employees of the DUB Profile Service within the MRC Protein Phosphorylation and Ubiquitylation Unit Reagents and Service group. H.M. and C.J.H. are managers of the MRC Protein Phosphorylation and Ubiquitylation Unit Reagents and Service group.
Additional information
Peer review information Nature Protocols thanks Melanie Leveridge, Jan Preisler and the other, anonymous, reviewer(s) for their contribution to the peer review of this work.
Publisher’s note Springer Nature remains neutral with regard to jurisdictional claims in published maps and institutional affiliations.
Related links
Key references using this protocol
Huguenin-Dezot, N. et al. Cell Rep. 16, 1180–1193 (2016): https://doi.org/10.1016/j.celrep.2016.06.064
Magiera, K. et al. Cell Chem. Biol. 24, 458–470.e18 (2017): https://doi.org/10.1016/j.chembiol.2017.03.002
Kategaya, L. et al. Nature 550, 534–538 (2017): https://doi.org/10.1038/nature24006
Supplementary information
Supplementary Information
Supplementary Figs. 1 and 2 and Supplementary Methods.
Rights and permissions
About this article

Cite this article
De Cesare, V., Moran, J., Traynor, R. et al. High-throughput matrix-assisted laser desorption/ionization time-of-flight (MALDI-TOF) mass spectrometry–based deubiquitylating enzyme assay for drug discovery. Nat Protoc 15, 4034–4057 (2020). https://doi.org/10.1038/s41596-020-00405-0
Received:
Accepted:
Published:
Issue Date:
DOI: https://doi.org/10.1038/s41596-020-00405-0
This article is cited by
Comments
By submitting a comment you agree to abide by our Terms and Community Guidelines. If you find something abusive or that does not comply with our terms or guidelines please flag it as inappropriate.
