
Abstract
In vivo two-photon imaging is a valuable technique for studies of viral pathogenesis and host responses to infection in vivo. In this protocol, we describe a methodology for analyzing influenza virus–infected lung in vivo by two-photon imaging microscopy. We describe the surgical procedure, how to stabilize the lung, and an approach to analyzing the data. Further, we provide a database of fluorescent dyes, antibodies, and reporter mouse lines that can be used in combination with a reporter influenza virus (Color-flu) for multicolor analysis. Setup of this model typically takes ~30 min and enables the observation of influenza virus–infected lungs for >4 h during the acute phase of the inflammation and at least 1 h in the lethal phase. This imaging system, which we termed two-photon IMPRESS (imaging pathophysiology research system), is broadly applicable to analyses of other respiratory pathogens and reveals disease progression at the cellular level in vivo.
Introduction
In vivo two-photon imaging is an analytical approach that can be used to visualize cell dynamics and hemodynamics in organs or tissues of live animals. Information in real time obtained by using this approach, such as changes in cell behavior and morphology, tissue localization, and blood flow, has revealed highly sophisticated and dynamic systems of living organisms. During in vivo imaging, the blood circulation in the tissue being observed is maintained; therefore, this technique is also effective for analyzing the migration and invasion of immune cells in the inflammatory environment. Observations in physiological environments deepen our understanding of host response mechanisms under both steady-state and disease conditions.
Computed tomography, X-ray, and IVIS Spectrum (an in vivo imaging system) imaging methods have been used as non-invasive approaches; however, these techniques have low spatiotemporal resolution and have been able to estimate only the site of inflammation in an organ1,2. Therefore, it is impossible to observe cellular responses of the immune system using these approaches. By contrast, a two-photon excitation laser microscope, the light source of which is a near-infrared laser that produces low damage to cells but has long-reaching depth in tissue, enables us to capture the movement of cells in living animals at high resolution. Two-photon imaging has been in use in biological science since the 1990s; it has progressed at a remarkable rate, and observation methods for various organs, including brain, liver, and lymph nodes, have been reported3,4. In this protocol, we describe how to use it to image virus-infected lungs. We have previously demonstrated that this protocol works by using mice infected with mouse-adapted seasonal influenza virus (H1N1) or highly pathogenic avian influenza virus (H5N1)5.
Challenges when imaging the lung
The lung, which is a respiratory organ, has contact with the outside environment and is an important organ for research on immunity to infectious diseases. In the seventeenth century, Marcello Malpighi discovered pulmonary capillaries and alveoli in the frog lung by using optical microscopy6; now fluorescent reporter mice facilitate the study of disease models in conjunction with two-photon excitation microscopy (Table 1). However, a challenge encountered when imaging the lung is that it is constantly moving during respiration. The lung has been stabilized in several ways during in vivo observation by microscopy, including bronchus clamping, prolonged apnea, gluing, and suction7,8; however, it is difficult to reduce motion artifacts due to lung respiratory movement under physiological conditions and hence to obtain high-quality images. Bronchus clamping can suppress respiratory motion artifacts of the lung lobe9,10; however, it is not suitable for long-term observation because it causes severe hypoxia. Although prolonging apnea is less invasive11,12,13, it does not allow researchers sufficient time to observe the lung for image acquisition by two-photon excitation microscopy, and the quality of the images tends to deteriorate over time. Gluing addresses the above limitations14,15; however, it can induce shear force injury and inflammation, which affect the interpretation of results. A suction window, which is currently the most commonly used stabilizing system during lung imaging, achieves moderate immobilization of the lung and high-quality images16,17,18,19; however, the observation period is limited to ≤12 h. Ex vivo imaging of lungs and in vivo imaging of trachea have also been performed as complementary methods8. Each of these methods has its advantages and disadvantages, and it is important to select and optimize the method best suited to the goal of the experiments and disease model.
In vivo observation of lungs has been performed using various lung disease and experimental models, including bacterial infection, allergen inoculation, tumor metastasis, and lipopolysaccharide (LPS)-induced sepsis (Table 1). However, for viral respiratory diseases, such as influenza, other than an observation in a methodology report20, only analyses of the trachea in vivo21,22,23 and isolated lungs had been performed24, with no analysis of the lung in vivo, until our recent publication5 (Table 1). Unlike ex vivo methods, which involve isolated or sliced lungs, in vivo imaging using two-photon excitation microscopy of live animals enables researchers to observe hemodynamics, migration and extravasation of immune cells, as well as interactions among immune cells during influenza virus infection. However, it is technically demanding to perform two-photon excitation microscopy of live influenza virus–infected lung, which exhibits severe inflammation, requiring the development of highly sophisticated, less invasive instruments and surgical techniques. In addition, when observing animals infected with pathogenic viruses, specialized facilities and instruments are frequently required to avoid the spread of the virus. Furthermore, because many types of immune cells infiltrate the infected lung in an inflammatory environment, it is necessary to distinguish the target immune cells from the infected cells by using fluorescent labels in the infected microenvironment. To detect multiple fluorescent signals excited simultaneously by a two-photon excitation laser, fluorochromes with different spectra and equal brightness must be selected; however, there is currently no comprehensive database of fluorescent reagents, fluorescent reporter viruses, and reporter mouse lines available for lung in vivo imaging. We therefore also provide a database of fluorescent dyes, antibodies, and reporter mouse lines that can be used in combination with a reporter influenza virus (Color-flu)25,26,27 for multicolor analysis under pathological conditions in this protocol.
Our system uses suction-based lung stabilization16,28 to improve an existing in vivo two-photon imaging system for influenza virus–infected lung as a model of an acute inflammatory respiratory disease5. We have successfully used C57BL/6 mice and transgenic mice of the C57BL/6 background (6- to 10-week-old males and females). By using our method, described in detail here, it is possible to visualize and analyze the behavior of immune cells and their interactions with infected cells during an influenza virus infection, which creates an acute inflammatory environment.
Limitations of the protocol
A limitation of two-photon excitation microscopy is that the observation depth that can be achieved is a maximum of ~70 μm. Therefore, we cannot observe the bronchial region. This limitation is linked to the wavelength of the infrared laser and detector capability of the microscope. However, as laser technology develops, the observation depth achievable using this method will improve.
Applications of the protocol
In this protocol, we describe the application of this methodology to influenza virus infection of the lungs because this is what we have used it for previously. This protocol could be applied not only to studies of the early stages of inflammation due to infection or other causes, but also to analyses of tissue regeneration mechanisms in lungs that are in the process of recovering from infection or other injuries. The information provided will also be useful to those using two-photon imaging analysis for the evaluation of the effects of drugs and vaccines, as well as biological events in the lungs and other organs (e.g., liver, spleen)5. Moreover, with minor modifications, the approach could be applied to analyses of other respiratory diseases, including other infectious models (e.g., severe acute respiratory syndrome (SARS) and Middle East respiratory syndrome (MERS)), pulmonary fibrosis, and tumor metastasis.
Materials
Biological materials
-
Mice. We have successfully used 6- to 10-week-old C57BL/6 mice (Japan SLC, mouse line C57BL/6JJmsSlc) and the following transgenic mouse lines: CAG-ECFP (cat. no. 004218), Cd11c-DTR/GFP (cat. no. 004509), Zbtb46-GFP (cat. no. 027618), Csf1r-GFP (cat. no. 018549), Cx3cr1-GFP (cat. no. 005582), Ncr1-GFP (cat. no. 022739), Clec9a-GFP (cat. no. 017696), Sftpc-GFP (cat. no. 028356), Cd11c-Cre (cat. no. 008068), Zbtb46-Cre (cat. no. 028538), Cx3cr1-Cre (cat. no. 025524), Cx3cr1-CreER (cat. no. 020940), Cd8a-Cre (cat. no. 008766), Cd4-CreER (cat. no. 022356), Cd19-Cre (cat. no. 006785), Mcpt8-Cre (cat. no. 017578), loxP-flanked R26-tdTomato (Ai14) (cat. no. 007914), R26-EYFP (cat. no. 006148), and R26-mT/mG (cat. no. 007676) mice, which can be obtained from the Jackson Laboratory. CAG-Cre mice can be obtained from J. Miyazaki (Osaka University Graduate School of Medicine)29. LysM-GFP mice can be obtained from T. Graf (Albert Einstein College of Medicine)30. Sftpc-CreER mice can be obtained from B.L.M. Hogan (Duke University Medical Center)31. Ly6g-Cre (Catchup) mice can be obtained from M.G.32. R26-mTFP1 mice can be obtained from I. Imayoshi (Kyoto University)33. Cre strains were bred to R26-tdTomato, R26-EYFP, R26-mTFP1, or R26-mT/mG mice. SftpcCreER/+;R26tdTomato/+ mice, SftpcCreER/+;R26mTmG/+ mice, SftpcCreER/+;R26tdTomato/+;Cx3cr1GFP/+mice and Cx3cr1CreER/+;R26tdTomato/+ mice were intraperitoneally injected with 1 mg of tamoxifen for 5 d. Cd4CreER/+;R26tdTomato/+ mice and Cd4CreER/+;R26mTmG/+ mice were intraperitoneally injected with 5 mg of tamoxifen for 5 d
Caution
All animal care and experiments must conform to the guidelines for animal experiments of the relevant government and institution. All our animal care and experiments conformed to the guidelines for animal experiments of the University of Tokyo and were approved by the animal research committee of the University of Tokyo (PA17-31 and PA17-17).
-
Viruses. We have used MA-eCFP-H5N1, MA-Cerulean-H5N1, MA-eGFP-H5N1, MA-Venus-H5N1, and MA-mCherry-H5N1 (A/Vietnam/1203/2004[H5N1]); and MA-eCFP-PR8, MA-Cerulean-PR8, MA-eGFP-PR8, MA-Venus-PR8, and MA-mCherry-PR8 (A/Puerto Rico/8/34[H1N1]), which express a fluorescent reporter protein (eCFP, Cerulean, eGFP, Venus, or mCherry) fused to the NS1 protein. Viruses were generated by using reverse genetics25,26,27. Virus strains should be propagated in Madin-Darby canine kidney (MDCK) cells. The MDCK cell line we used was obtained from R.G. Webster (St. Jude Children’s Research Hospital). DNA fingerprinting showed that this cell line has the same origin as one obtained from ATCC (cat. no. CCL-34, RRID:CVCL_0422)
Caution
All viruses and infected animals should be handled in accordance with your institution’s biosafety regulations. All work on highly pathogenic avian influenza viruses must be performed under biosafety level 3 (BSL3) regulations. Accordingly, all our in vivo imaging studies were performed in the BSL3 facility at the University of Tokyo (Tokyo, Japan), which is approved for such use by the Ministry of Agriculture, Forestry, and Fisheries of Japan
Critical
The cells should be regularly checked to ensure that they are not contaminated with mycoplasma.
Reagents
Critical
Although the suppliers used for all reagents are provided, alternative reagents are available in most cases. All reagents should be stored according to the manufacturer’s recommendations. For aliquot sizes for reagents, see the ‘Reagent setup’ section.
-
Sterile phosphate buffered saline (PBS, pH 7.4; made in-house)
-
Sterile saline solution (NaCl, 0.9% (wt/vol); made in-house)
-
Dimethyl sulfoxide, sterile-filtered (DMSO; Nacalai Tesque, cat. no. 13408-64)
Caution
DMSO readily penetrates the skin; wear rubber gloves and protective eye goggles.
-
Sunflower seed oil (Sigma-Aldrich, cat. no. 88921)
-
Ethanol (99.5%; FujiFilm Wako Pure Chemical, cat. no. 057-00456)
Caution
Ethanol is highly flammable and may cause eye irritation. Handle it appropriately.
-
Tamoxifen (Sigma-Aldrich, cat. no. T5648)
-
Isoflurane (MSD Animal Health)
Caution
Isoflurane is an anesthetic gas associated with adverse health outcomes. It should be used in a well-ventilated room or with another appropriate removal system. Store it in a locked drawer at room temperature (18–25 °C).
-
Sevoflurane (Maruishi Pharmaceutical)
Caution
Sevoflurane is an anesthetic gas associated with adverse health outcomes. It should be used in a well-ventilated room or with another appropriate removal system. Store it in a locked drawer at room temperature.
Fluorescent reagents
Caution
Fluorescent reagents can be harmful. They should be handled according to the manufacturer’s instructions while wearing proper protective clothing
Critical
Choose fluorescent reagents as required for your experiment.
-
Cascade Blue-conjugated dextran (10,000 molecular weight (MW); Invitrogen, cat. no. D1976)
-
Fluorescein isothiocyanate (FITC)-conjugated dextran (4,000 MW; Sigma-Aldrich, cat. no. 46944)
-
FITC-conjugated dextran (10,000 MW; Invitrogen, cat. no. D1820)
-
FITC-conjugated dextran (40,000 MW; Invitrogen, cat. no. D1845)
-
FITC-conjugated dextran (70,000 MW; Sigma-Aldrich, cat. no. 46945)
-
Texas Red-conjugated dextran (3,000 MW; Invitrogen, cat. no. D3328)
-
Texas Red-conjugated dextran (10,000 MW; Invitrogen, cat. no. D1863)
-
Texas Red-conjugated dextran (70,000 MW; Invitrogen, cat. no. D1864)
-
Qtracker 655 vascular labels (Invitrogen, cat. no. Q21021MP)
-
Qdot 655 wheat germ agglutinin (WGA) conjugate (Invitrogen, cat. no. Q12021MP)
-
Calcein AM solution (Sigma-Aldrich, cat. no. C1359)
-
SYTOX Blue nucleic acid stain (Invitrogen, cat. no. S11348)
-
SYTOX Green nucleic acid stain (Invitrogen, cat. no. S7020)
-
SYTOX Orange nucleic acid stain (Invitrogen, cat. no. S11368)
-
Propidium iodide (Invitrogen, cat. no. P1304MP)
-
DAPI (4ʹ,6-diamidino-2-phenylindole, dilactate; Invitrogen, cat. no. D3571)
-
Hoechst 33342, trihydrochloride, trihydrate (Invitrogen, cat. no. H3570)
-
Pan caspase (FAM-VAD-FMK) in vivo probe, green (Vergent Bioscience, cat. no. 20100)
-
CellROX Green Reagent (Invitrogen, cat. no. C10444)
-
CellROX Orange Reagent (Invitrogen, cat. no. C10443)
-
CellROX Deep Red Reagent (Invitrogen, cat. no. C10422)
-
LysoTracker Blue DND-22 (Invitrogen, cat. no. L7525)
-
LysoTracker Green DND-26 (Invitrogen, cat. no. L7526)
-
LysoTracker Red DND-99 (Invitrogen, cat. no. L7528)
-
LysoTracker Deep Red (Invitrogen, cat. no. L12492)
-
MitoTracker Orange CMTMRos (Invitrogen, cat. no. M7510)
-
MitoTracker Red CM-H2Xros (Invitrogen, cat. no. M7513)
-
MitoTracker Red FM (Invitrogen, cat. no. M22425)
-
Rhodamine 6G (Sigma-Aldrich, cat. no. 252433)
-
Tetramethylrhodamine, ethyl ester, perchlorate (TMRE; Invitrogen, cat. no. T669)
-
FluoSpheres polystyrene microspheres (1.0 µm, red fluorescent; Invitrogen, cat. no. F13083)
-
SiR-actin (Cytoskeleton, cat. no. CY-SC001)
-
SiR-tubulin (Cytoskeleton, cat. no. CY-SC002)
-
PKH26 Red Fluorescent Cell Linker Kit (Sigma-Aldrich, cat. no. PKH26PCL)
-
FITC-conjugated anti-mouse Ly-6G antibody (BioLegend, cat. no. 127606, RRID: AB_1236494)
-
Alexa Fluor 488–conjugated anti-mouse Ly-6G antibody (BioLegend, cat. no. 127626, RRID: AB_2561340)
-
DyLight 488–conjugated anti-mouse Ly-6G antibody (Leinco Technologies, cat. no. L287, RRID: AB_2810281)
-
PE-conjugated anti-mouse Ly-6G antibody (BD Biosciences, cat. no. 551461, RRID: AB_394208)
-
Alexa Fluor 594–conjugated anti-mouse Ly-6G antibody (BioLegend, cat. no. 127636, RRID: AB_2563207)
-
Alexa Fluor 647–conjugated anti-mouse Ly-6G antibody (BioLegend, cat. no. 127610, RRID: AB_1134159)
Equipment
-
Dark microtubes, (1.5 ml; Watson, cat. no. 131-915)
-
Microsurgery straight scissors (13.5 cm; BRC, cat. no. 64152075)
-
Microsurgery straight iris scissors (11.0 cm; BRC, cat. no. 64122001)
-
Microsurgery hooked forceps (12.7 cm; BRC, cat. no. 64121044)
-
Microsurgery bulldog forceps (BRC, cat. no. 70052-30CII/R)
-
Tracheal cannula (1.1 × 32 mm; i.d., 0.80 mm; Nipro, cat. no. 09-043)
-
Insulin syringes (0.5 ml, 100 U, 30 gauge × 10 mm; Nipro, cat. no. 08277)
-
Pasteur pipettes (BD Falcon, cat. no. 357575)
-
Customized surgical retractor (made in-house)
-
Thoracic suction window (Sakura Seiki, custom made)
-
Stage for mounting a thoracic suction window (Sakura Seiki, custom made)
-
Suction regulator (Iwaki, cat. no. 1450050)
-
Cover glass (Matsunami Glass, cat. no. C013001)
-
Hot plate (Hipet, cat. no. 4977007036379)
-
Adhesive tape (Yamato, cat. no. NO200-19)
-
Customized microscope stage (Narishige, custom made)
-
Confocal microscope system (Zeiss, model no. LSM 780 NLO)
-
Infrared laser (Coherent, model no. Chameleon Vision II)
-
20× water immersion lens (Zeiss, Plan-Apochromat model)
-
Beam-pointing stabilizer (TEM Messtechnik, model no. Aligna 4D system)
-
High-efficiency particulate air (HEPA) filters (Vacushield; Pall, cat. no. 4402)
-
Artificial ventilator (Shinano, cat. no. SN-480-7)
-
Airway pressure monitor (Shinano)
-
Gas anesthesia vaporizer (Shinano, cat. no. SN-487-OT)
-
Mouse anesthesia induction chamber (Shinano, cat. no. SN-487-85-02)
-
Mouse anesthesia mask (Shinano, cat. no. SN-487-70-08)
-
Parafilm (Laboratory & Medical Supplies, cat. no. PM-996)
-
Positive pressure mask (Versaflo Faceshields; 3M, cat. no. TR-300-HKL and TR-3712N)
-
Tyvek suit (DuPont, cat. no. SoftWear III)
-
Surgical gloves (SIAM OKAMOTO, cat. no. OM-100)
-
Small glass window (Thorlabs, cat. no. WG12012-B)
-
Planar window, RS seal (Roxtec, cat. no. RS 100 AISI 316 woc/SLFRS 100 AISI 316)
-
Pulse oximeter (Kent Scientific, model. no. LabOx-1)
Software
-
CellProfiler (Broad Institute: https://cellprofiler.org/)
-
MATLAB (MathWorks: https://www.mathworks.com/products/matlab.html)
-
Prism 6 software (GraphPad: https://www.graphpad.com/scientific-software/prism/)
-
ImageJ (NIH: https://imagej.nih.gov/ij/)
-
TrackMate34, a plugin for ImageJ (NIH: https://imagej.net/TrackMate)
Reagent setup
Critical
All reagents should be prepared under sterile conditions. Fluorescent reagents should be protecting from light during the setup procedure because they are light sensitive.
Tamoxifen solution
To prepare 10 mg/ml of tamoxifen solution in sunflower seed oil, dissolve 100 mg of tamoxifen in 1 ml of ethanol (99.5%) and add 9 ml of sunflower seed oil. After adding the ethanol and sunflower seed oil, mix well by vortexing and sonication. This solution can be stored in a refrigerator (2–8 °C) for a week.
Caution
Tamoxifen powder should be handled in a hood. To avoid inhalation and contact with skin, wear rubber gloves and a surgical mask.
Fluorescent dextran
Prepare a solution at a concentration of 2 mg/ml in sterile 1× PBS or saline, make aliquots in 1.5-ml microtubes, and store them in a refrigerator (2–8 °C) for up to 2 weeks. Inject 50 μl (100 μg) of fluorescent dextran i.v. per mouse.
Qtracker 655 vascular labels
Immediately before use, add 5 μl of the stock solution to 95 μl of sterile 1× PBS or saline to make 100 μl total and inject 50 μl i.v. at a concentration of 0.1 μM.
FluoSpheres polystyrene microspheres
Prepare a solution at a concentration of 1 × 10⁸ beads/ml in sterile 1× PBS or saline, make aliquots of the solution in dark 1.5-ml microtubes, and store them in a refrigerator (2–8 °C) for long periods (~3 months). Immediately before use, mix well and inject 50 μl i.v. per mouse.
Qdot 655 WGA
Immediately before use, add 5 μl of the stock solution to 95 μl of sterile 1× PBS or saline to make 100 μl total and i.v. inject 50 μl.
Calcein AM solution
Prepare a solution at a concentration of 100 μM in sterile 1× PBS or saline, dispense the solution into dark 1.5-ml microtubes, and store them in a refrigerator (2–8 °C) for up to 2 weeks. Inject 50 μl of fluorescent dextran i.v. per mouse.
SYTOX Blue, Green, and Orange
Divide the 5 mM DMSO stock solution into dark 1.5-ml microtubes and store them at −20 °C for up to 3 months. Immediately before use, prepare a solution at a concentration of 50 μM in sterile 1× PBS or saline and i.v. inject 50 μl per mouse.
Propidium iodide
Prepare a solution at a concentration of 100 mM in sterile 1× PBS or saline, dispense the solution in dark 1.5-ml microtubes, and store them at −20 °C for up to 3 months. Immediately before use, prepare a solution at a concentration of 1 mM in sterile 1× PBS or saline and inject 50 μl i.v. per mouse.
DAPI
Prepare a solution at a concentration of 10 mM in sterile 1× PBS or saline, make aliquots of the solution in dark 1.5-ml microtubes, and store them in a refrigerator (2–8 °C) for up to 2 weeks. Inject 50 μl of the solution i.v. per mouse.
Pan caspase (FAM-VAD-FMK) in vivo probe
Prepare a working solution according to the vendor’s manual, dissolve pan caspase in vivo probe in 5 μl of DMSO, and add 55 μl of 1× injection buffer (from the kit). Inject 60 μl of the solution i.v. per mouse within 1 h of preparation.
PKH26
Prepare a working solution according to the vendor’s manual, dissolve 100 μl of PKH26PCL in 900 μl of ethanol and store at room temperature for up to 3 months. Immediately before use, prepare a solution at a concentration of 10 μM in sterile Dilution Buffer (from the kit) and inject 50 μl intranasally per mouse.
CellROX Green, Orange, and Deep Red
Immediately before use, add 50 μl of the stock solution to 450 μl of sterile 1× PBS or saline to make 500 μl total and inject 50 μl i.v. at a concentration of 250 μM.
LysoTracker Blue, Green, Red, and Deep Red
Immediately before use, add 50 μl of the stock solution to 450 μl of sterile 1× PBS or saline to make 500 μl total and inject 50 μl i.v. at a concentration of 100 μM.
MitoTracker Orange CMTMRos, Red CM-H2Xros, and Red FM
Immediately before use, dilute 50 μg of MitoTracker in 1 ml of DMSO and inject 50 μl i.v. at a concentration of 100 μM.
Critical
The MitoTracker solution should be prepared fresh each time immediately before use.
Rhodamine 6G
Prepare the solution at a concentration of 10 mM in sterile 1× PBS or saline, make aliquots in dark 1.5-ml microtubes, and store them in a refrigerator (2–8 °C) for up to 2 weeks. Immediately before use, prepare a solution at a concentration of 10 μM in sterile 1× PBS or saline and inject 50 μl i.v. per mouse.
TMRE
Prepare the solution at a concentration of 10 mM in DMSO, make aliquots in dark 1.5-ml microtubes, and store them in a refrigerator (2–8 °C) for up to 2 weeks. Immediately before use, prepare a working solution at a concentration of 1 mM in sterile 1× PBS or saline and inject 50 μl i.v. per mouse.
SiR-actin and SiR-tubulin
Prepare each solution at a concentration of 1 mM in DMSO, make aliquots in dark 1.5-ml microtubes, and store them in a refrigerator (2–8 °C) for up to 1 week. Immediately before use, prepare solutions at a concentration of 100 μM in sterile 1× PBS or saline and inject 50 μl i.v. per mouse.
Fluorescent antibody
Dilute fluorescent antibodies to a concentration of 1 µg per 10 μl with sterile 1× PBS or saline and inject 50 μl i.v. per mouse.
Caution
It should be noted that antibody staining may affect the target cell behavior; for example, at a high dose (~200 μg), antibodies may neutralize cell activities and/or cause antibody-dependent cytotoxic activity35,36,37. In our studies, we use 5 µg of antibody for brightness screening because inoculation of fluorochrome-conjugated anti-Ly-6G antibody at low doses (1–40 µg) into mice does not affect neutrophil recruitment38. The contribution of Ly-6G, which is expressed predominantly on murine neutrophils, to recruitment during inflammation remains a matter of debate. It has been reported that low-dose antibody treatment inhibited Ly-6G ligation and the recruitment of neutrophils to the site of inflammation39; however, a more recent study indicated that Ly-6G knockout did not affect either neutrophil differentiation or recruitment to the site of inflammation in Catchup mice32. Therefore, a low dose of anti-Ly-6G antibody is used in our protocol.
Equipment setup
Laser path adjustment system
An overview of the laser path adjustment system is shown in Fig. 1. Our two-photon excitation laser (Chameleon Vision II) unit is placed on an anti-vibration table outside the BSL3 facility. The laser beam enters the BSL3 room, where the two-photon excitation scanning microscope is located, through a window (composed of a small glass window (WG12012-B) and a planar window (RS seal)) connecting the inside and the outside of the BSL3 facility (Fig. 1c,d). The laser path connecting the laser source unit and the two-photon excitation microscope is adjusted by automated laser beam alignment and the Aligna 4D stabilization system is adjusted with two active mirrors.

a, Schematic image of the system for correcting the laser beam path. b, Layout of active mirrors to adjust the laser path. c, The window through which the laser connecting the inside and outside of the BSL3 facility passes. d, Arrangement of the two-photon excitation microscope inside the BSL3 facility and the laser unit outside the BSL3 facility. Some images provided courtesy of Coherent and Zeiss.
Caution
This system adjusts the laser path passing from the outside to the inside of the BSL3 facility for maintenance purposes, so there is no need for this setup unless you are using pathogens that require BSL3 containment. Heat is generated when the laser source unit is running, so keep the temperature and humidity constant by using air conditioning equipment.
Caution
The system should be operated only by users trained to deal with unenclosed high-power invisible beams and should be placed in an appropriate enclosure with interlocking doors.
Two-photon excitation laser scanning microscopy system for in vivo imaging of virus-infected mouse lungs in a BSL3 facility
A schematic of the arrangement of the in vivo lung imaging system for virus-infected mouse is shown in Fig. 2a, and layout examples are shown in Fig. 2b–g. This in vivo lung imaging system is based on the upright microscope LSM 780 NLO system, which is equipped with four different lasers (excitation at 405, 488, 543, and 633 nm) for confocal imaging and a two-photon excitation laser (excitation at 630–1,050 nm). To be able to perform the surgical procedure on the mouse, we replaced the sample stage with a large, flat one (microscope stage for in vivo experiment) as shown in Fig. 2b,c. To efficiently excite multiple fluorescent proteins and fluorescent dyes simultaneously, the wavelength of the infrared laser should be set at 910 nm. All fluorescent spectra between the 410- and 695-nm wavelengths can be detected using a 20× water immersion lens, and we record signals in lambda image stacks (0.13 frames per s, 1,024 × 1,024 pixels) and acquire z-stack images with z-depths of 5 μm (total of 10-μm z-depth). We perform spectral separation of the acquired lambda stacks by using the linear unmixing function of the ZEN software. Although the LSM 780 microscope system is controlled by a primary personal computer, we recommended adding >64 GB of RAM for appropriate imaging analysis.

a, Schematic image of the imaging system for virus-infected lungs. b, Placement of life support devices and lung stabilizer devices. c, Surgical stage. d, Anesthesia machine and mechanical ventilator. e–g, The operator wearing a Tyvek suit and a positive-pressure mask. All our animal care and experiments conformed to the guidelines for animal experiments of the University of Tokyo and were approved by the animal research committee of the University of Tokyo (PA17-31 and PA17-17). Some images in a provided courtesy of Zeiss.
We keep the mice on a heated stage on the sample stage and record their vital signs using a LabOx-1 pulse oximeter. To observe the lungs of the mice with a thoracotomy, we place the ventilator with an airway pressure monitor and anesthesia machine for rodents in appropriate positions on the stage. We installed high-efficiency particulate air (HEPA) filters in the exhalation duct of the ventilation system (Fig. 2b,d), and the operator wore a positive pressure mask (Versaflo Faceshields) and a Tyvek suit (Fig. 2e–g) to avoid exposure to the viruses.
Caution
The wavelength and power of the excitation laser should be adjusted appropriately according to the experimental conditions. Increasing the laser power enhances target signals and enables detection of second-harmonic generation (SHG), in which structures with repeating patterns lead to the formation of a signal. SHG is a useful phenomenon for visualizing collagen fibers in the lung without staining; however, it should be noted that the autofluorescence of lung tissue is also enhanced under excessive excitation conditions (Supplementary Fig. 1). When using this protocol, we did not perform experiments under which SHG occurs, in order to minimize autofluorescence; it is better to adjust the laser power according to the experimental purpose. When the wavelength of the excitation laser is too short, the autofluorescence signal becomes very strong and it is difficult to observe properly. By contrast, when the laser wavelength is too long, it becomes difficult to obtain a signal because of the short excitation energy (Supplementary Fig. 2).
Caution
Although color separation of emission using a conventional optical band-pass filter is also available for this protocol, multispectral imaging is a useful approach for simultaneously analyzing multiple targets by eliminating tissue autofluorescence and identifying fluorescent labels with overlapping spectra40,41. In vivo two-photon imaging is performed under conditions of single stimulation with a two-photon excitation laser; limitations exist regarding available fluorescent reagents/proteins for multiple labeling of target cells and lung architecture. Therefore, we recommend using a multispectral approach to produce crosstalk-free images of fluorescence with overlapping spectra that cannot be separated by using band-pass filters. Before starting experiments, it is necessary to collect spectral signatures of the emission signal of each fluorescent reagent and protein as reference spectra under the same excitation condition as will be used in the experiment.
Thoracic suction window and surgical tools
To observe the mouse lung using an upright microscope, it is necessary to prepare a thoracic suction window to immobilize the lung. In the BSL3 facility, animal experiments must be performed while wearing two or three layers of latex gloves; therefore, the thoracic suction window was designed for easy handling, even in the BSL3 facility, and to be minimally invasive for the infected animals (Fig. 3a–c and Supplementary Fig. 3). To position a cover glass for each observation, flatten the upper surface of the thoracic suction window so that a commercially available cover glass will fit. This device is also designed to reduce concavity and convexity as much as possible so that blood containing virus cannot accumulate. Connect the thoracic suction window to an aspirator through a waste tank and a suction regulator. To prevent the spread of virus-containing aerosols, install HEPA filters between the waste tank and the suction regulator as shown in Fig. 3d.

a, Surgical tools. b, Thoracic suction window. c, Setup of thoracic suction window and the holding devices. d, Device layout pertaining to lung stabilization.
Procedure
Infection with fluorescent influenza viruses
Timing 10–20 min
-
1
On Day 0, intranasally inoculate C57BL/6 (‘B6’) mice or transgenic mice with 105 plaque-forming units (PFUs) of Color-flu viruses in 50 μl of PBS under sevoflurane anesthesia. Tables 2 and 3 show the brightness levels of fluorescence of representative reporter mouse immune cells and Color-flu viruses in vivo.
Table 2 Comparison of fluorescent reporter mice for in vivo imaging using two-photon excitation microscopy Table 3 Comparison of fluorescent reporter viruses (Color-flu) for in vivo imaging using two-photon excitation microscopy Caution
All relevant guidelines regarding the use of animals and recombinant viruses should be followed.
Critical
Fluorescent reporter influenza viruses (Color-flu) stably express high levels of a reporter protein in the infected cells and show comparable virulence to those of wild-type influenza viruses in mice25. Depending on the experiments, modify the virus infectious dose, monitor the infected mice in the days following infection, and determine the appropriate time point for observation (e.g., when mice are infected with 103 PFU of MA-Venus-PR8, infected cells can be observed for up to 7 d post-infection). Of note, infected cells may not be observed if the infectious dose is too low.
Critical
As controls for the experiment, use wild-type mice or transgenic mice that are not infected with influenza virus and administer the same fluorescently labeled antibodies and reagents as those used in the test group.
Starting up the imaging system equipment
Timing 20–30 min
-
2
On the day of analysis, turn on the two-photon excitation laser and the Aligna 4D control unit placed outside the BSL3 facility, and verify that they are working.
Critical
The Aligna 4D control unit needs to be kept ON.
-
3
Wearing a Tyvek suit, positive pressure mask, and gloves according to the guidelines for the BSL3 facility, enter the BSL3 facility where the imaging system is housed.
-
4
Turn on the microscope controllers, confocal lasers, and the computer for the two-photon excitation microscope and the Aligna 4D system.
-
5
Launch the microscope control software ZEN and turn on the lasers, including the two-photon excitation laser.
-
6
Launch the Aligna 4D control software Kangoo and adjust the laser path connecting the laser source unit and the microscope (Supplementary Fig. 4).
-
7
Wrap the hot plate with aluminum foil, turn it on, and keep it at 35 °C. Sterilize the surgical area and tools with 70% ethanol and place all instruments within easy reach.
Animal anesthesia
Timing 2–3 min
-
8
Turn on the gas anesthesia vaporizer and supply 5% isoflurane to a mouse anesthesia induction chamber.
-
9
Anesthetize the influenza virus–infected mouse with 5% isoflurane in a mouse anesthesia induction chamber. Subsequently, transfer the mouse to the hot plate while supplying 2% isoflurane via an anesthetic mask.
Administration of fluorescent dyes
Timing 5 min
-
10
Inject the chosen fluorescent dyes and antibodies via the retro-orbital plexus (as shown in Supplementary Video 1) using an insulin syringe. Tables 4 and 5 show the brightness levels of antibodies and fluorescence of dyes, respectively, in vivo.
Table 4 Comparison of fluorochrome-conjugated antibodies for in vivo imaging using two-photon excitation microscopy Table 5 Comparison of fluorescent dyes for in vivo imaging using two-photon excitation microscopy Caution
When working with viruses in a BSL3 containment, it is not safe to use needles, so we avoid them as much as possible, which is a standard precaution in high-containment laboratories. In addition, in the BSL3 facility, animal experiments must be performed wearing two or three layers of latex gloves. Tail-vein administration is a common method; however, it is not easy to perform these procedures with so many layers of gloves. Use tweezers to hold down the mouse to make the administration route. When an infected animal is not used, an administration route can be created via the tail vein or the jugular vein.
Surgical procedure
Timing 10–15 min
Critical
Before experimenting with infected animals, practice the surgical procedures with euthanized animals.
-
11
Place the mouse on its back and tape the anterior limbs with adhesive tape (Fig. 4a).
Fig. 4: Surgical procedure for lung imaging. 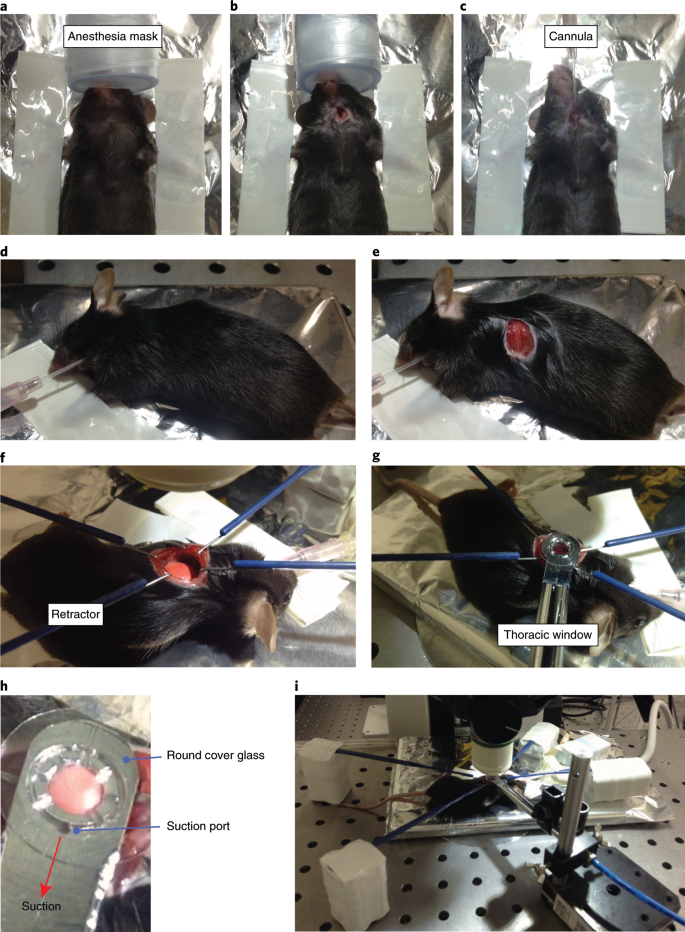
a, Place the mouse on its back and tape with adhesive tape. b, Cut the skin beneath the chin and expose the trachea. c, Insert a tracheal cannula. d, Place the mouse in the right lateral decubitus position. e, Make an incision in the skin at the left axilla. f, Expose the left lung lobe and keep it exposed by using retractors. g, Lower the thoracic suction window gently to immobilize the lungs of the mouse. h, Close-up of the thoracic suction window. i, Lower the objective lens to the thoracic suction window. All our animal care and experiments conformed to the guidelines for animal experiments of the University of Tokyo and were approved by the animal research committee of the University of Tokyo (PA17-31 and PA17-17).
-
12
Using straight scissors, cut the skin beneath the chin in the middle and expose the trachea (Fig. 4b). Insert a tracheal cannula and intubate the mouse to facilitate mechanical ventilation with a ventilator (Fig. 4c). Turn on the ventilator, ventilate the mouse at a respiratory rate of 120 breaths per min, and apply positive-end expiratory pressure (PEEP; ~6 cm H2O) and a tidal volume of ~0.5 mL. Deliver isoflurane continuously at 2% to maintain anesthesia.
Caution
Perform the surgery with care so as not to cut the blood vessels. If bleeding occurs, stop the bleeding with fine bulldog forceps for microsurgery.
-
13
Place the mouse in the right lateral decubitus position and re-fix its anterior limbs with the tape (Fig. 4d). Make an incision in the skin at the left axilla using straight scissors, straight iris scissors, and hooked forceps (Fig. 4e).
Caution
Carefully change the mouse’s position in order to avoid cannula drop off.
-
14
Expose the left lung lobe by surgical intercostal incision between ribs 3 and 4, and keep it exposed by using retractors (Fig. 4f).
Caution
Perform the surgery with care so as not to cut the blood vessels. If bleeding occurs, stop the bleeding with fine bulldog forceps for microsurgery.
Critical
Because lungs infected with viruses often shrink, secure a large field of surgical view so that the suction window can reach it.
-
15
Place the mouse beneath the objective lens and connect a device to monitor the heart rate of the mouse (we use a LabOx-1 pulse oximeter).

Starting up the thoracic vacuum window system
Timing 2–3 min
-
16
Turn on the aspirator connected to the thoracic suction window.
-
17
Fix the thoracic suction window to the holding block at a 90° angle and put a round cover glass on the tip of the suction device.
-
18
Turn on the suction pressure regulator and adjust the suction pressure to 25–30 mmHg.
Observation of lungs infected with influenza viruses
Timing 2–3 min
-
19
Lower the thoracic suction window gently to immobilize the mouse lungs (Fig. 4g,h). The thoracic suction window should cause the lung to stick to the cover glass because of negative pressure.
Caution
Carefully move the suction window so as not to scratch the objective.
-
20
Position the objective lens above the thoracic window.
-
21
Put water drops on the cover glass by using a pasteur pipette and lower the objective lens to the thoracic suction window (Fig. 4i).
-
22
Double-check the general condition of the mouse and its position.
Data acquisition
Timing 1–4 h per sample
-
23
Acquire images using the lambda mode of the ZEN software. Record time series at different frequencies according to need.
Unmixing of spectrum data and analyzing the images
Timing 1–2 h per sample
-
24
To unmix the spectrum data, prepare a reference image of each spectrum in advance. To make a reference image, acquire each fluorescent dye or protein separately without any co-staining and analyze the single fluorescent spectrum. We use the linear unmixing module of the ZEN software for separating spectrum data; however, other commercial or open-source software is available (Table 6).
Table 6 Open-source packages for image processing and analyses -
25
Subject unmixed time-series stacks to image registration to correct for tissue drifts and respiratory artifacts. This step is critical to certain analyses, such as long-term tracking of individual cells or subcellular structures. In some cases, a reference channel is required for determining the shift and distortion of the objects. In our studies, we use time-series stacks of blood vessels or collagens for such use, because their localizations are constant over time without substantial changes in shape or structure during the observation.
Caution
Some image registration algorithms may cause spatial distortion. Choose algorithms that generate corrected data suitable for your subsequent analyses, especially when examination of the shape and structure of cells and tissues is required.
-
26
Analyze the movies as required for your experiment.
Troubleshooting
Troubleshooting advice can be found in Table 7.
Timing
-
Step 1, infection: 10–20 min
-
Steps 2–7, starting up the imaging system equipment: 20–30 min
-
Steps 8–22, anesthesia and surgical preparation for imaging: 21–29 min
-
Steps 23–26, data acquisition and image analyses: 2–6 h per sample (depending on the number of samples, fluorescent colors, and acquired frames)
Anticipated results
The imaging system described in this protocol enables the observation of the behavior of virus-infected cells and immune cells in infected lungs in real time. Typical images of influenza virus–infected lung are shown in Fig. 5a and Supplementary Video 2. When observing while using a multicolor fluorescent label, it is easier to analyze the detected images if the brightness level of each fluorophore is adjusted to make them similar. It is better to choose fluorescent dyes or proteins that possess high fluorescence stability for long-term observations (Tables 2, 4 and 5). We have found that use of MA-Cerulean-viruses or MA-Venus-viruses for infection produces influenza virus–infected cells with sufficient brightness (Table 3). For labeling immune cells and alveolar cells, we have achieved good results by using the fluorochrome phycoerythrin (PE) for antibody staining and Rosa-tdTomato42 or -mTFP133 mice that were crossed with cell-specific Cre-expressing mice. If using reporter mice expressing a fluorescent protein such as GFP, which is regulated by an endogenous promoter, the expression level of the fluorescent protein should be confirmed. To visualize the lung structure, we use Texas-Red dextran or Qtracker 655 Vascular Labels for the red to far-infrared channel.

a, CatchupIVM-red mice were intranasally infected with 105 PFU of MA-Venus-H5N1 or MA-Venus-PR8 virus and observed at 4 d post-infection. Fluorescent dextran (blue) was intravenously administered to visualize the lung architecture. Red and green indicate neutrophils and virus-infected cells, respectively. b, Ly6gCre/+;R26mTFP1/+ mice were intranasally infected with 105 PFU of MA-Venus-PR8 virus and observed at 7 d post-infection. PE-conjugated anti-mouse Ly-6G antibody (red) and fluorescent dextran (white) were intravenously administered to visualize the vascular neutrophils and lung architectures, respectively. Green indicates virus-infected cells. Blue indicates both infiltrating (arrowheads) and vascular neutrophils (arrow). c, Ly6gCre/+;R26tdTomato/+;Cx3cr1GFP/+ mice were intranasally infected with 105 PFU of MA-Venus-PR8 virus and observed at 5 d post-infection. Fluorescent dextran (white) was intravenously administered to visualize the lung architecture. Red, green, and blue indicate neutrophils, monocytes, and virus-infected cells, respectively. The yellow arrowhead and arrow indicate a neutrophil and a monocyte, respectively, in contact. AB, antibody.
Influenza virus–infected lungs are infiltrated by numerous immune cells, including neutrophils and monocytes43,44,45. An immune cell–specific reporter mouse line can be used to visualize cells infiltrating the alveoli and cells in blood vessels, whereas it is preferable to label intravascular cells by intravenous administration of fluorochrome-conjugated antibodies5,46,47. Consistent with previous reports, intravenously injected antibodies will label only the cells in contact with the blood flow and not those in extravascular regions under our experimental conditions5. By administering a fluorescently labeled antibody against neutrophils into neutrophil reporter mice, we can observe the behavior of both the neutrophils infiltrating the influenza-infected lungs and the neutrophils in blood vessels separately (Fig. 5b). To observe the interaction between different kinds of infiltrating immune cells, such as neutrophils and monocytes, double-reporter mice expressing fluorescent proteins with different spectra but similar brightness have a major advantage (Fig. 5c and Supplementary Video 3).
Co-infection of the host with different strains of influenza virus can lead to the emergence of reassortant viruses. By infecting mice with Color-flu viruses that produce different fluorescence spectra, we detected alveolar epithelial cells that simultaneously expressed two fluorescent proteins in vivo (Fig. 6). Visualization of co-infected cells might enable us to better understand the reassortment process of influenza viruses in vivo.

B6 mice were intranasally infected with 105 PFU of MA-Venus-H5N1 and MA-Cerulean-H5N1, or MA-Venus-PR8 and MA-Cerulean-PR8 viruses and observed at 3 d (H5N1) or 4 d (PR8) post-infection. Fluorescent dextran (white) was intravenously administered to visualize the lung architecture. Red and green indicate MA-Cerulean-virus-infected cells (yellow arrows) and MA-Venus-virus-infected cells (white arrows), respectively. The yellow arrowheads indicate cells co-infected with MA-Cerulean-virus and MA-Venus-virus. Scale bar, 50 µm.
In summary, the use of this in vivo imaging system for infected animal and multicolor imaging enables us to analyze pathology and immune cell dynamics at the cellular level, which would not be possible by using conventional histopathology methods. This imaging system thus provides a novel and useful approach for investigating viral pathogenicity.
Reporting Summary
Further information on research design is available in the Nature Research Reporting Summary linked to this article.
Data availability
The data that support this study are available from the corresponding author upon reasonable request.
Code availability
The MATLAB scripts are available at https://github.com/KawaokaLab/Ueki_PNAS_2018.
References
Tran, V., Moser, L. A., Poole, D. S. & Mehle, A. Highly sensitive real-time in vivo imaging of an influenza reporter virus reveals dynamics of replication and spread. J. Virol. 87, 13321–13329 (2013).
Veldhuis Kroeze, E. J. et al. Consecutive CT in vivo lung imaging as quantitative parameter of influenza vaccine efficacy in the ferret model. Vaccine 30, 7391–7394 (2012).
Denk, W., Holt, J. R., Shepherd, G. M. & Corey, D. P. Calcium imaging of single stereocilia in hair cells: localization of transduction channels at both ends of tip links. Neuron 15, 1311–1321 (1995).
Choi, M., Kwok, S. J. & Yun, S. H. In vivo fluorescence microscopy: lessons from observing cell behavior in their native environment. Physiology 30, 40–49 (2015).
Ueki, H. et al. In vivo imaging of the pathophysiological changes and neutrophil dynamics in influenza virus-infected mouse lungs. Proc. Natl Acad. Sci USA 115, E6622-E6629 (2018).
West, J. B. Marcello Malpighi and the discovery of the pulmonary capillaries and alveoli. Am. J. Physiol. Lung Cell Mol. Physiol. 304, L383–L390 (2013).
Looney, M. R. & Bhattacharya, J. Live imaging of the lung. Annu. Rev. Physiol. 76, 431–445 (2014).
Looney, M. R. & Headley, M. B. Live imaging of the pulmonary immune environment. Cell. Immunol., https://doi.org/10.1016/j.cellimm.2018.09.007 (2018).
Macgregor, R. G. Examination of the pulmonary circulation with the microscope. J. Physiol. 80, 65–77 (1933).
Hasegawa, A. et al. Color-coded real-time cellular imaging of lung T-lymphocyte accumulation and focus formation in a mouse asthma model. J. Allergy Clin. Immunol. 125, 461–468.e6 (2010).
Mitsuoka, H. et al. Pathophysiological role of endothelins in pulmonary microcirculatory disorders due to intestinal ischemia and reperfusion. J. Surg. Res. 87, 143–151 (1999).
Tabuchi, A., Mertens, M., Kuppe, H., Pries, A. R. & Kuebler, W. M. Intravital microscopy of the murine pulmonary microcirculation. J. Appl. Physiol. 104, 338–346 (2008).
Veith, N. T. et al. Surfactant protein A mediates pulmonary clearance of Staphylococcus aureus. Respir. Res. 15, 85 (2014).
Kreisel, D. et al. In vivo two-photon imaging reveals monocyte-dependent neutrophil extravasation during pulmonary inflammation. Proc. Natl Acad. Sci. USA 107, 18073–18078 (2010).
Spahn, J. H. et al. DAP12 expression in lung macrophages mediates ischemia/reperfusion injury by promoting neutrophil extravasation. J. Immunol. 194, 4039–4048 (2015).
Looney, M. R. et al. Stabilized imaging of immune surveillance in the mouse lung. Nat. Methods 8, 91–96 (2011).
Presson, R. G. Jr et al. Two-photon imaging within the murine thorax without respiratory and cardiac motion artifact. Am. J. Pathol. 179, 75–82 (2011).
Headley, M. B. et al. Visualization of immediate immune responses to pioneer metastatic cells in the lung. Nature 531, 513–517 (2016).
Lefrancais, E. et al. The lung is a site of platelet biogenesis and a reservoir for haematopoietic progenitors. Nature 544, 105–109 (2017).
Benson, R. A., Lawton, J. C. & MacLeod, M. K. T cell response in the lung following influenza virus infection. Methods Mol. Biol. 1591, 235–248 (2017).
Lim, K. et al. Neutrophil trails guide influenza-specific CD8+ T cells in the airways. Science 349, aaa4352 (2015).
Lambert Emo, K. et al. Live imaging of influenza infection of the trachea reveals dynamic regulation of CD8+ T cell motility by antigen. PLoS Pathog. 12, e1005881 (2016).
Palomino-Segura, M., Virgilio, T., Morone, D., Pizzagalli, D. U. & Gonzalez, S. F. Imaging cell interaction in tracheal mucosa during influenza virus infection using two-photon intravital microscopy. J. Vis. Exp. 2018, e58355, https://doi.org/10.3791/58355 (2018).
Matheu, M. P. et al. Three phases of CD8 T cell response in the lung following H1N1 influenza infection and sphingosine 1 phosphate agonist therapy. PloS One 8, e58033 (2013).
Fukuyama, S. et al. Multi-spectral fluorescent reporter influenza viruses (Color-flu) as powerful tools for in vivo studies. Nat. Commun. 6, 6600 (2015).
Zhao, D. et al. Molecular determinants of virulence and stability of a reporter-expressing H5N1 influenza A virus. J. Virol. 89, 11337–11346 (2015).
Katsura, H. et al. Amino acid changes in PB2 and HA affect the growth of a recombinant influenza virus expressing a fluorescent reporter protein. Sci. Rep. 6, 19933 (2016).
Thornton, E. E., Krummel, M. F. & Looney, M. R. Live imaging of the lung. Curr. Protoc. Cytom. 60, 12.28.1–12.28.12 (2012).
Sakai, K. & Miyazaki, J. A transgenic mouse line that retains Cre recombinase activity in mature oocytes irrespective of the cre ransgene transmission. Biochem. Biophys. Res. Commun. 237, 318–324 (1997).
Faust, N., Varas, F., Kelly, L. M., Heck, S. & Graf, T. Insertion of enhanced green fluorescent protein into the lysozyme gene creates mice with green fluorescent granulocytes and macrophages. Blood 96, 719–726 (2000).
Rock, J. R. et al. Multiple stromal populations contribute to pulmonary fibrosis without evidence for epithelial to mesenchymal transition. Proc. Natl Acad. Sci. USA 108, E1475–1483 (2011).
Hasenberg, A. et al. Catchup: a mouse model for imaging-based tracking and modulation of neutrophil granulocytes. Nat. Methods 12, 445–452 (2015).
Imayoshi, I. et al. A multifunctional teal-fluorescent Rosa26 reporter mouse line for Cre- and Flp-mediated recombination. Neurosci. Res. 73, 85–91 (2012).
Tinevez, J. Y. et al. TrackMate: an open and extensible platform for single-particle tracking. Methods 115, 80–90 (2017).
Tate, M. D. et al. The role of neutrophils during mild and severe influenza virus infections of mice. PloS One 6, e17618 (2011).
Narasaraju, T. et al. Excessive neutrophils and neutrophil extracellular traps contribute to acute lung injury of influenza pneumonitis. Am. J. Pathol. 179, 199–210 (2011).
Reilly, E. C., Lambert-Emo, K. & Topham, D. J. The effects of acute neutrophil depletion on resolution of acute influenza infection, establishment of tissue resident memory (TRM), and heterosubtypic immunity. PloS One 11, e0164247 (2016).
Yipp, B. G. & Kubes, P. Antibodies against neutrophil LY6G do not inhibit leukocyte recruitment in mice in vivo. Blood 121, 241–242 (2013).
Wang, J. X. et al. Ly6G ligation blocks recruitment of neutrophils via a β2-integrin-dependent mechanism. Blood 120, 1489–1498 (2012).
Garini, Y., Young, I. T. & McNamara, G. Spectral imaging: principles and applications. Cytom. A 69, 735–747 (2006).
Levenson, R. M. & Mansfield, J. R. Multispectral imaging in biology and medicine: slices of life. Cytom. A 69, 748–758 (2006).
Madisen, L. et al. A robust and high-throughput Cre reporting and characterization system for the whole mouse brain. Nat. Neurosci. 13, 133–140 (2010).
Braciale, T. J., Sun, J. & Kim, T. S. Regulating the adaptive immune response to respiratory virus infection. Nat. Rev. Immunol. 12, 295–305 (2012).
Brandes, M., Klauschen, F., Kuchen, S. & Germain, R. N. A systems analysis identifies a feedforward inflammatory circuit leading to lethal influenza infection. Cell 154, 197–212 (2013).
Iwasaki, A. & Pillai, P. S. Innate immunity to influenza virus infection. Nat. Rev. Immunol. 14, 315–328 (2014).
Anderson, K. G. et al. Intravascular staining for discrimination of vascular and tissue leukocytes. Nat. Protoc. 9, 209–222 (2014).
Patel, B. V., Tatham, K. C., Wilson, M. R., O’Dea, K. P. & Takata, M. In vivo compartmental analysis of leukocytes in mouse lungs. Am. J. Physiol. Lung Cell Mol. Physiol. 309, L639–652 (2015).
Hall, H. L. A study of the pulmonary circulation by the transillumination method. Am. J. Physiol. 72, 446–457 (1925).
Wagner, W. W. Jr & Latham, L. P. Pulmonary capillary recruitment during airway hypoxia in the dog. J. Appl. Physiol. 39, 900–905 (1975).
Wearn, J. T., Barr, J. S. & German, W. J. The behavior of the arterioles and capillaries of the lung. Exp. Biol. Med. 24, 114–115 (1926).
Wagner, W. W. Jr, Latham, L. P. & Capen, R. L. Capillary recruitment during airway hypoxia: role of pulmonary artery pressure. J. Appl. Physiol. Respir. Environ. Exerc. Physiol. 47, 383–387 (1979).
Olkon, D. M. & Joannides, M. Capillaroscopic appearance of the pulmonary alveoli in the living dog. Anat. Rec. 45, 121–127 (1930).
Capen, R. L., Latham, L. P. & Wagner, W. W. Jr. Diffusing capacity of the lung during hypoxia: role of capillary recruitment. J. Appl. Physiol. Respir. Environ. Exerc. Physiol. 50, 165–171 (1981).
Capen, R. L. & Wagner, W. W. Jr. Intrapulmonary blood flow redistribution during hypoxia increases gas exchange surface area. J. Appl. Physiol. Respir. Environ. Exerc. Physiol. 52, 1575–1580 (1982).
Wearn, J. T. et al. The normal behavior of the pulmonary blood vessels with observations on the intermittence of the flow of blood in the arterioles and capillaries. Am. J. Physiol. 109, 236–256 (1934).
Groh, J., Kuhnle, G. E., Kuebler, W. M. & Goetz, A. E. An experimental model for simultaneous quantitative analysis of pulmonary micro- and macrocirculation during unilateral hypoxia in vivo. Res. Exp. Med. 192, 431–441 (1992).
Terry, R. J. A thoracic window for observation of the lung in a living animal. Science 90, 43–44 (1939).
Wagner, W. W. Jr. & Filley, G. F. Microscopic observation of the lung in vivo. Vasc. Dis. 2, 229–241 (1965).
Tabuchi, A. et al. Precapillary oxygenation contributes relevantly to gas exchange in the intact lung. Am. J. Respir. Crit. Care Med. 188, 474–481 (2013).
Wagner, W. W. Jr. Pulmonary microcirculatory observations in vivo under physiological conditions. J. Appl. Physiol. 26, 375–377 (1969).
Wagner, W. W. Jr, Latham, L. P., Gillespie, M. N., Guenther, J. P. & Capen, R. L. Direct measurement of pulmonary capillary transit times. Science 218, 379–381 (1982).
Mitsuoka, H. et al. Intravital laser confocal microscopy of pulmonary edema resulting from intestinal ischemia-reperfusion injury in the rat. Crit. Care Med. 27, 1862–1868 (1999).
Lien, D. C. et al. Physiological neutrophil sequestration in the lung: visual evidence for localization in capillaries. J. Appl. Physiol. 62, 1236–1243 (1987).
Bhattacharya, S., Glucksberg, M. R. & Bhattacharya, J. Measurement of lung microvascular pressure in the intact anesthetized rabbit by the micropuncture technique. Circ. Res. 64, 167–172 (1989).
Kreisel, D. et al. Emergency granulopoiesis promotes neutrophil-dendritic cell encounters that prevent mouse lung allograft acceptance. Blood 118, 6172–6182 (2011).
Okada, O. et al. Capillary perfusion patterns in single alveolar walls. J. Appl. Physiol. 72, 1838–1844 (1992).
Kuhnle, G. E., Leipfinger, F. H. & Goetz, A. E. Measurement of microhemodynamics in the ventilated rabbit lung by intravital fluorescence microscopy. J. Appl. Physiol. 74, 1462–1471 (1993).
Zheng, Z. et al. Donor pulmonary intravascular nonclassical monocytes recruit recipient neutrophils and mediate primary lung allograft dysfunction. Sci. Transl. Med. 9, aal4508 (2017).
Kuebler, W. M., Kuhnle, G. E., Groh, J. & Goetz, A. E. Leukocyte kinetics in pulmonary microcirculation: intravital fluorescence microscopic study. J. Appl. Physiol. 76, 65–71 (1994).
Schmidt, E. P. et al. The pulmonary endothelial glycocalyx regulates neutrophil adhesion and lung injury during experimental sepsis. Nat. Med. 18, 1217–1223 (2012).
Okada, O., Presson, R. G. Jr, Godbey, P. S., Capen, R. L. & Wagner, W. W. Jr. Temporal capillary perfusion patterns in single alveolar walls of intact dogs. J. Appl. Physiol. 76, 380–386 (1994).
Ortiz-Munoz, G. et al. Aspirin-triggered 15-epi-lipoxin A4 regulates neutrophil-platelet aggregation and attenuates acute lung injury in mice. Blood 124, 2625–2634 (2014).
Gebb, S. A. et al. Sites of leukocyte sequestration in the pulmonary microcirculation. J. Appl. Physiol. 79, 493–497 (1995).
Chong, S. Z. et al. CXCR4 identifies transitional bone marrow premonocytes that replenish the mature monocyte pool for peripheral responses. J. Exp. Med. 213, 2293–2314 (2016).
Kuebler, W. M., Kuhnle, G. E., Groh, J. & Goetz, A. E. Contribution of selectins to leucocyte sequestration in pulmonary microvessels by intravital microscopy in rabbits. J. Physiol. 501, 375–386 (1997).
Bennewitz, M. F. et al. Lung vaso-occlusion in sickle cell disease mediated by arteriolar neutrophil-platelet microemboli. JCI Insight 2, e89761 (2017).
Kuebler, W. M., Kuhnle, G. E. & Goetz, A. E. Leukocyte margination in alveolar capillaries: interrelationship with functional capillary geometry and microhemodynamics. J. Vasc. Res. 36, 282–288 (1999).
Park, I. et al. Neutrophils disturb pulmonary microcirculation in sepsis-induced acute lung injury. Eur. Respir. J. 53, 1800786 (2019).
Eichhorn, M. E., Ney, L., Massberg, S. & Goetz, A. E. Platelet kinetics in the pulmonary microcirculation in vivo assessed by intravital microscopy. J. Vasc. Res. 39, 330–339 (2002).
McCormack, D. G. et al. Pulmonary microvascular changes during sepsis: evaluation using intravital videomicroscopy. Microvasc. Res. 60, 131–140 (2000).
Lamm, W. J., Bernard, S. L., Wagner, W. W. Jr & Glenny, R. W. Intravital microscopic observations of 15-microm microspheres lodging in the pulmonary microcirculation. J. Appl. Physiol. 98, 2242–2248 (2005).
Park, I. et al. Intravital imaging of a pulmonary endothelial surface layer in a murine sepsis model. Biomed. Opt. Express 9, 2383–2393 (2018).
Yang, Y., Yang, G. & Schmidt, E. P. In vivo measurement of the mouse pulmonary endothelial surface layer. J. Vis. Exp. 2013, e50322, https://doi.org/10.3791/50322 (2013).
Cortez-Retamozo, V. et al. Real-time assessment of inflammation and treatment response in a mouse model of allergic airway inflammation. J. Clin. Invest. 118, 4058–4066 (2008).
Tschernig, T. et al. Direct visualisation of microparticles in the living lung. Exp. Toxicol. Pathol. 65, 883–886 (2013).
Thornton, E. E. et al. Spatiotemporally separated antigen uptake by alveolar dendritic cells and airway presentation to T cells in the lung. J. Exp. Med. 209, 1183–1199 (2012).
Fiole, D. et al. Two-photon intravital imaging of lungs during anthrax infection reveals long-lasting macrophage-dendritic cell contacts. Infect. Immun. 82, 864–872 (2014).
Chojnacki, A. et al. Intravital imaging allows real-time characterization of tissue resident eosinophils. Commun. Biol. 2, 181 (2019).
Bennewitz, M. F., Watkins, S. C. & Sundd, P. Quantitative intravital two-photon excitation microscopy reveals absence of pulmonary vaso-occlusion in unchallenged sickle cell disease mice. Intravital 3, e29748 (2014).
Preu, L. et al. Initial host response to bacteria in the murine lung differs between Pseudomonas aeruginosa, Staphylococcus aureus and Streptococcus pneumoniae. Inflammation 39, 513–517 (2016).
Thanabalasuriar, A., Neupane, A. S., Wang, J., Krummel, M. F. & Kubes, P. iNKT cell emigration out of the lung vasculature requires neutrophils and monocyte-derived dendritic cells in inflammation. Cell Reps. 16, 3260–3272 (2016).
Fingar, V. H., Taber, S. W. & Wieman, T. J. A new model for the study of pulmonary microcirculation: determination of pulmonary edema in rats. J. Surg. Res. 57, 385–393 (1994).
Yipp, B. G. et al. The lung is a host defense niche for immediate neutrophil-mediated vascular protection. Sci. Immunol. y. 2, eaam8929 (2017).
Schneider, P., Foitzik, T., Kahrau, S., Podufal, A. & Buhr, H. J. An experimental rat model for studying pulmonary microcirculation by in vivo videomicroscopy. Microvasc. Res. 62, 421–434 (2001).
Thanabalasuriar, A. et al. Bispecific antibody targets multiple Pseudomonas aeruginosa evasion mechanisms in the lung vasculature. J. Clin. Invest. 127, 2249–2261 (2017).
Mertens, M. et al. Alveolar dynamics in acute lung injury: heterogeneous distension rather than cyclic opening and collapse. Crit. Care Med. 37, 2604–2611 (2009).
Lefrancais, E., Mallavia, B., Zhuo, H., Calfee, C. S. & Looney, M. R. Maladaptive role of neutrophil extracellular traps in pathogen-induced lung injury. JCI Insight 3, e98178 (2018).
Lee, E. K. S. et al. Leukotriene B4-mediated neutrophil recruitment causes pulmonary capillaritis during lethal fungal sepsis. Cell Host Microbe 23, 121–133.e124 (2018).
Surewaard, B. G. J. et al. α-Toxin induces platelet aggregation and liver injury during Staphylococcus aureus sepsis. Cell Host Microbe 24, 271–284.e273 (2018).
Devi, S. et al. Neutrophil mobilization via plerixafor-mediated CXCR4 inhibition arises from lung demargination and blockade of neutrophil homing to the bone marrow. J. Exp. Med. 210, 2321–2336 (2013).
Caudrillier, A., Mallavia, B., Rouse, L., Marschner, S. & Looney, M. R. Transfusion of human platelets treated with mirasol pathogen reduction technology does not induce acute lung injury in mice. PloS One 10, e0133022 (2015).
Funakoshi, N. et al. A new model of lung metastasis for intravital studies. Microvasc. Res. 59, 361–367 (2000).
Wang, J. et al. Visualizing the function and fate of neutrophils in sterile injury and repair. Science 358, 111–116 (2017).
Entenberg, D. et al. In vivo subcellular resolution optical imaging in the lung reveals early metastatic proliferation and motility. Intravital 4(3), 1-11 (2015).
Chakarov, S. et al. Two distinct interstitial macrophage populations coexist across tissues in specific subtissular niches. Science 363, aau0964 (2019).
Hanna, R. N. et al. Patrolling monocytes control tumor metastasis to the lung. Science 350, 985–990 (2015).
Puttur, F. et al. Pulmonary environmental cues drive group 2 innate lymphoid cell dynamics in mice and humans. Sci. Immunol. 4, eaav7638 (2019).
Rodriguez-Tirado, C. et al. Long-term high-resolution intravital microscopy in the lung with a vacuum stabilized imaging window. J. Vis. Exp. 2016, e54603, https://doi.org/10.3791/54603 (2016).
Park, J. et al. Cancer cells induce metastasis-supporting neutrophil extracellular DNA traps. Sci. Transl. Med. 8, 361ra138 (2016).
Entenberg, D. et al. A permanent window for the murine lung enables high-resolution imaging of cancer metastasis. Nat. Methods 15, 73–80 (2018).
Hadjantonakis, A. K., Macmaster, S. & Nagy, A. Embryonic stem cells and mice expressing different GFP variants for multiple non-invasive reporter usage within a single animal. BMC Biotechnol. 2, 11 (2002).
Srinivas, S. et al. Cre reporter strains produced by targeted insertion of EYFP and ECFP into the ROSA26 locus. BMC Dev. Biol. 1, 4 (2001).
Muzumdar, M. D., Tasic, B., Miyamichi, K., Li, L. & Luo, L. A global double-fluorescent Cre reporter mouse. Genesis 45, 593–605 (2007).
Jung, S. et al. In vivo depletion of CD11c+ dendritic cells abrogates priming of CD8+ T cells by exogenous cell-associated antigens. Immunity 17, 211–220 (2002).
Caton, M. L., Smith-Raska, M. R. & Reizis, B. Notch-RBP-J signaling controls the homeostasis of CD8- dendritic cells in the spleen. J. Exp. Med. 204, 1653–1664 (2007).
Satpathy, A. T. et al. Zbtb46 expression distinguishes classical dendritic cells and their committed progenitors from other immune lineages. J. Exp. Med. 209, 1135–1152 (2012).
Loschko, J. et al. Absence of MHC class II on cDCs results in microbial-dependent intestinal inflammation. J. Exp. Med. 213, 517–534 (2016).
Sancho, D. et al. Identification of a dendritic cell receptor that couples sensing of necrosis to immunity. Nature 458, 899–903 (2009).
Sasmono, R. T. et al. A macrophage colony-stimulating factor receptor-green fluorescent protein transgene is expressed throughout the mononuclear phagocyte system of the mouse. Blood 101, 1155–1163 (2003).
Jung, S. et al. Analysis of fractalkine receptor CX(3)CR1 function by targeted deletion and green fluorescent protein reporter gene insertion. Mol. Cell. Biol. 20, 4106–4114 (2000).
Yona, S. et al. Fate mapping reveals origins and dynamics of monocytes and tissue macrophages under homeostasis. Immunity 38, 79–91 (2013).
Aghajani, K., Keerthivasan, S., Yu, Y. & Gounari, F. Generation of CD4CreER(T(2)) transgenic mice to study development of peripheral CD4-T-cells. Genesis 50, 908–913 (2012).
Maekawa, Y. et al. Notch2 integrates signaling by the transcription factors RBP-J and CREB1 to promote T cell cytotoxicity. Nat. Immunol. 9, 1140–1147 (2008).
Rickert, R. C., Roes, J. & Rajewsky, K. B lymphocyte-specific, Cre-mediated mutagenesis in mice. Nucleic Acids Res. 25, 1317–1318 (1997).
Sullivan, B. M. et al. Genetic analysis of basophil function in vivo. Nat. Immunol. 12, 527–535 (2011).
Gazit, R. et al. Lethal influenza infection in the absence of the natural killer cell receptor gene Ncr1. Nat. Immunol. 7, 517–523 (2006).
Vanderbilt, J. N. et al. High-efficiency type II cell-enhanced green fluorescent protein expression facilitates cellular identification, tracking, and isolation. Am. J. Respir. Cell Mol. Biol. 53, 14–21 (2015).
Cutrale, F. et al. Hyperspectral phasor analysis enables multiplexed 5D in vivo imaging. Nat. Methods 14, 149–152 (2017).
Inglada, J. & Christophe, E. The Orfeo Toolbox remote sensing image processing software. IEEE Int. Geosci. Remote Sens. Symp. 4, IV-733–IV-736 (2009).
Neher, R. & Neher, E. Optimizing imaging parameters for the separation of multiple labels in a fluorescence image. J. Microsc. 213, 46–62 (2004).
Zimmermann, T., Rietdorf, J., Girod, A., Georget, V. & Pepperkok, R. Spectral imaging and linear un-mixing enables improved FRET efficiency with a novel GFP2-YFP FRET pair. FEBS Lett. 531, 245–249 (2002).
Neher, R. A. et al. Blind source separation techniques for the decomposition of multiply labeled fluorescence images. Biophys. J. 96, 3791–3800 (2009).
Thirion, J. P. Image matching as a diffusion process: an analogy with Maxwell’s demons. Med. Image Anal. 2, 243–260 (1998).
Vercauteren, T., Pennec, X., Perchant, A. & Ayache, N. Diffeomorphic demons: efficient non-parametric image registration. NeuroImage 45, S61–S72 (2009).
Lee, S., Vinegoni, C., Sebas, M. & Weissleder, R. Automated motion artifact removal for intravital microscopy, without a priori information. Sci. Rep. 4, 4507 (2014).
Rueckert, D. et al. Nonrigid registration using free-form deformations: application to breast MR images. IEEE Trans. Med. Imaging 18, 712–721 (1999).
Dunn, K. W., Lorenz, K. S., Salama, P. & Delp, E. J. IMART software for correction of motion artifacts in images collected in intravital microscopy. Intravital 3, e28210 (2014).
Soulet, D., Pare, A., Coste, J. & Lacroix, S. Automated filtering of intrinsic movement artifacts during two-photon intravital microscopy. PloS One 8, e53942 (2013).
Warren, S. C. et al. Removing physiological motion from intravital and clinical functional imaging data. eLife 7, 35800.002 (2018).
Hilsenbeck, O. et al. Software tools for single-cell tracking and quantification of cellular and molecular properties. Nat. Biotechnol. 34, 703–706 (2016).
Carpenter, A. E. et al. CellProfiler: image analysis software for identifying and quantifying cell phenotypes. Genome Biol. 7, R100 (2006).
de Chaumont, F. et al. Icy: an open bioimage informatics platform for extended reproducible research. Nat. Methods 9, 690–696 (2012).
Acknowledgements
We thank S. Watson for editing the manuscript. We thank K. Iwatsuki-Horimoto, L. Wu, S. Fukuyama, Y. Matsuzawa, and K. Miyake (The University of Tokyo); M. Ishii, H. Mizuno, and J. Kikuta (Osaka University Graduate School of Medicine); and H. Ueno (Kansai Medical University) for research assistance. We thank J. Miyazaki (Osaka University Graduate School of Medicine), T. Graf (Albert Einstein College of Medicine), B. L. M. Hogan (Duke University Medical Center), I. Imayoshi (Kyoto University), and R. G. Webster (St. Jude Children’s Research Hospital) for providing animals and a cell line. This research was supported by Strategic Basic Research Programs from the Japan Science and Technology Agency (JST); Leading Advanced Projects for Medical Innovation (LEAP) from the Japan Agency for Medical Research and Development (AMED) (JP18am001007); Grants-in-Aid for Scientific Research on Innovative Areas from the Ministry of Education, Culture, Science, Sports, and Technology (MEXT) of Japan (16H06429, 16K21723, and 16H06434); the Japan Initiative for Global Research Network on Infectious Diseases (J-GRID) from the MEXT of Japan and from AMED (JP19fm0108006); the e-ASIA Joint Research Program from AMED (JP17jm0210042); the Research Program on Emerging and Re-emerging Infectious Diseases from AMED (JP19fk0108031); the NIAID-funded Center for Research on Influenza Pathogenesis (CRIP) (HHSN272201400008C); the fund for the Promotion of Joint International Research (Fostering Joint International Research (B)) from the Japan Society for the Promotion of Science (JSPS) (JP18KK0225); MEXT KAKENHI (18K14580); and JSPS KAKENHI (P16416).
Author information
Authors and Affiliations
Contributions
H.U., D.Z., and Y.K. designed the method and performed the experiments. M.G. provided a mouse line. H.U., I.-H.W., and Y.K. wrote the manuscript.
Corresponding author
Ethics declarations
Competing interests
Y.K. is a founder of FluGen and has received speaker’s honoraria from Toyama Chemical and Astellas and grant support from Chugai Pharmaceuticals, Daiichi Sankyo Pharmaceutical, Toyama Chemical, Tauns Laboratories, Otsuka Pharmaceutical, and Kyoritsu Seiyaku.
Additional information
Peer review information Nature Protocols thanks Megan MacLeod and the other, anonymous, reviewer(s) for their contribution to the peer review of this work.
Publisher’s note Springer Nature remains neutral with regard to jurisdictional claims in published maps and institutional affiliations.
Related links
Key references using this protocol
Fukuyama, S. et al. Nat. Commun. 6, 6600 (2015): https://doi.org/10.1038/ncomms7600
Ueki, H. et al. Proc. Natl Acad. Sci. USA 115, E6622-E6629 (2018): https://doi.org/10.1073/pnas.1806265115
Integrated supplementary information
Supplementary Figure 1 Comparison of the changes in the autofluorescence signal depending on the excitation laser power.
Lungs of C57BL/6 mice were observed by using a two-photon excitation microscope with the excitation laser set at 910 nm. The numbers in the panel indicate the laser power. Blue indicates second-harmonic generation (SHG). Red and green indicate autofluorescence at different fluorescent wavelengths. Scale bar, 50 µm.
Supplementary Figure 2 Comparison of the changes in the autofluorescence signal depending on the excitation laser wavelength.
Lungs of C57BL/6 mice were observed by using a two-photon excitation microscope with the excitation laser set at the indicated wavelength. The numbers in the panel indicate the laser power. Blue and red indicate autofluorescence at different fluorescent wavelengths. Scale bar, 50 µm.
Supplementary Figure 3 Design drawing and production procedure of the thoracic suction window.
a. i) Cut a brass round bar (Φ50) to a thickness of 3 mm, drill a hole (φ4) in the center, and make a scoop with a depth of 0.7 mm (R20) in the center by using an NC lathe. ii) Trim away a 0.5-mm-deep portion of the round plate. iii) Cut off the part indicated in the figure (width 20.7 mm). iv) Cut off the part indicated in the figure (width 21 mm). v) Cut off the opposite part indicated in the figure (width 21 mm). vi) Cut off both sides at 1 mm ×20.8 mm. vii) Make a round groove (5 mm deep) by using a circular table. viii) Create 90- and 45-degree grooves with a ball end mill. ix) Make a hole at Φ1. b. i) Cut a round brass bar (Φ8) to 80 mm in length. ii) Trim away one side of the round bar (0.5 mm). iii) Drill a hole to a depth of 60 mm. iv) Make an M5 screw hole 8 mm in depth. v) Make a hole (Φ1) from the opposite side. vi) Cut off the part indicated in the figure. c. i) Solder piece a and piece b. ii) Smooth the thoracic window with a file. iii) Plate the thoracic window with nickel chrome.
Supplementary Figure 4 Operation of the laser path compensation software.
a. Initial screen. b. Make sure the laser is switched on, and turn on the AutoGain button (yellow arrow). c. Turn on the RegOn button (yellow arrow). d. Make sure that the beam angle and beam position overlap at the center of the screen (yellow arrow). Some images provided courtesy of Coherent and Zeiss.
Supplementary information
Supplementary Information
Supplementary Figs. 1–4.
Supplementary Video 1
Administration of fluorescent reagents via the retro-orbital plexus.
Supplementary Video 2
In vivo imaging of mouse lung infected with influenza viruses.
Supplementary Video 3
Multicolor imaging of neutrophil and monocyte dynamics in influenza virus–infected lungs.
Rights and permissions
About this article

Cite this article
Ueki, H., Wang, IH., Zhao, D. et al. Multicolor two-photon imaging of in vivo cellular pathophysiology upon influenza virus infection using the two-photon IMPRESS. Nat Protoc 15, 1041–1065 (2020). https://doi.org/10.1038/s41596-019-0275-y
Received:
Accepted:
Published:
Issue Date:
DOI: https://doi.org/10.1038/s41596-019-0275-y
This article is cited by
-
Real-time imaging of dynamic tissues
Nature Methods (2023)
-
Crystal ribcage: a platform for probing real-time lung function at cellular resolution
Nature Methods (2023)
Comments
By submitting a comment you agree to abide by our Terms and Community Guidelines. If you find something abusive or that does not comply with our terms or guidelines please flag it as inappropriate.
