
Abstract
BNT162b2, a nucleoside-modified mRNA formulated in lipid nanoparticles that encodes the SARS-CoV-2 spike glycoprotein (S) stabilized in its prefusion conformation, has demonstrated 95% efficacy in preventing COVID-191. Here we extend a previous phase-I/II trial report2 by presenting data on the immune response induced by BNT162b2 prime–boost vaccination from an additional phase-I/II trial in healthy adults (18–55 years old). BNT162b2 elicited strong antibody responses: at one week after the boost, SARS-CoV-2 serum geometric mean 50% neutralizing titres were up to 3.3-fold above those observed in samples from individuals who had recovered from COVID-19. Sera elicited by BNT162b2 neutralized 22 pseudoviruses bearing the S of different SARS-CoV-2 variants. Most participants had a strong response of IFNγ+ or IL-2+ CD8+ and CD4+ T helper type 1 cells, which was detectable throughout the full observation period of nine weeks following the boost. Using peptide–MHC multimer technology, we identified several BNT162b2-induced epitopes that were presented by frequent MHC alleles and conserved in mutant strains. One week after the boost, epitope-specific CD8+ T cells of the early-differentiated effector-memory phenotype comprised 0.02–2.92% of total circulating CD8+ T cells and were detectable (0.01–0.28%) eight weeks later. In summary, BNT162b2 elicits an adaptive humoral and poly-specific cellular immune response against epitopes that are conserved in a broad range of variants, at well-tolerated doses.
Main
The effect of the SARS-CoV-2 pandemic has necessitated the rapid development of safe and effective prophylactic vaccines. Eleven months after starting ‘Project Lightspeed’ (the joint BioNTech–Pfizer programme for the development of an RNA vaccine for COVID-19), BNT162b2 became the first vaccine to be authorized for emergency use. The vaccine showed 95% efficacy for protection against COVID-19 in a phase-II/III trial1 and emerging real-world data confirm that BNT162b2 is highly effective in preventing COVID-19 and hospitalization and death associated with SARS-CoV-2 infection3,4,5. The observational data also demonstrate that BNT162b2 reduces laboratory-confirmed infection, as well as viral load in individuals who are infected3,4,5,6.
BNT162b2 is based on lipid-nanoparticle-formulated mRNA vaccine technology, which delivers precise genetic information of the immunogen to antigen-presenting cells and elicits potent immune responses7. mRNA is transiently expressed, does not integrate into the genome and is degraded by physiological pathways. mRNA vaccines are molecularly well-defined and synthesized efficiently from DNA templates by in vitro transcription8,9,10. mRNA production and lipid nanoparticle formulation are fast and highly scalable, which renders this technology suitable for the rapid development and supply of vaccines during pandemic scenarios11,12.
Two phase-I/II umbrella trials, one in Germany and one in the USA, investigated four candidate RNA–lipid nanoparticle vaccines. Preliminary clinical data from these studies on two candidates, BNT162b113,14 and BNT162b22, have previously been reported. Both of the candidates are pharmacologically optimized15,16, N1-methylpseudouridine nucleoside-modified mRNAs17 that are administered intramuscularly in a prime–boost regimen 21 days apart. BNT162b1 encodes a trimerized, secreted version of the receptor-binding domain (RBD) of S, whereas BNT162b2 encodes full-length SARS-CoV-2 S stabilized in the prefusion conformation18. BNT162b2 was selected as pivotal candidate on the basis of the totality of data obtained in the two phase-I/II trials and challenge studies in non-human primates2,18.
In the phase-I/II trial in the USA (NCT04368728), immunization with BNT162b2 at dose levels of up to 30 μg was associated with generally mild-to-moderate local reactions at the injection site as well as systemic events, such as fatigue, headache and myalgia2. Robust concentrations of S1-binding immunoglobulin G (IgG) and neutralizing titres against a SARS-CoV-2 strain with the wild-type (Wuhan-Hu-1) S sequence were elicited. Geometric mean 50% neutralizing titres (GMTs) of sera drawn from younger (18–55 years) and older (65–85 years) adults seven days after the booster dose of 30 μg BNT162b2 were 3.8-fold and 1.6-fold, respectively, the GMT of samples from individuals who had recovered from COVID-19. Here we provide data from the phase-I/II trial in Germany (NCT04380701, EudraCT: 2020-001038-36) that provide insights into vaccine-induced immune responses after prime–boost vaccination with 1, 10, 20 and 30 μg BNT162b2 in participants of 19–55 years of age. In addition to reporting neutralizing-antibody GMTs up to day 85 after dose 1 and cross-neutralizing-antibody GMTs against newly emerging SARS-CoV-2 strains, this study provides a characterization of the T cell responses elicited by BNT162b2, including the identification of epitopes that are recognized by the CD8+ T cells induced by a COVID-19 vaccine.
Safety and tolerability
We observed no related serious adverse events, no grade-4 reactions and no withdrawals owing to related adverse events. Local reactions (predominantly pain at the injection site) were mild-to-moderate (grades 1 and 2) and of similar frequency and severity after the priming and booster doses (Extended Data Fig. 2a, Extended Data Table 3a). The most common systemic adverse events were fatigue and headache, and only two participants reported mild fever (Extended Data Fig. 2b, Extended Data Table 3b). Transient chills were more common after the boost, were dose-dependent and were occasionally severe. Muscle pain and joint pain were also more common after the boost and showed dose-dependent severity. Reactions had their onset within 24 h of immunization, peaked on the day after immunization and mostly resolved within 2 or 3 days, and either did not require treatment or could be managed with simple measures (such as paracetamol).
No clinically relevant changes in routine clinical laboratory values occurred. We observed a mild drop in blood lymphocyte counts and an increase in C-reactive protein, which are known pharmacodynamic markers of mRNA vaccines19,20,21,22,23; both of these were transient, dose-dependent and within, or close to, laboratory-normal levels (Extended Data Fig. 3).
Vaccine-induced antibody response
We assessed S1- and RBD-binding IgG concentrations and SARS-CoV-2 neutralizing titres on day 1 (pre-dose), day 8 and day 22 (1 and 3 weeks after the priming dose, respectively), and on day 29, day 43, day 50 and day 85 (1, 3, 4 and 9 weeks after the booster dose, respectively) (Fig. 1, Extended Data Fig. 4, Extended Data Table 2).

Participants were immunized with BNT162b2 on days 1 and 22 (n = 12 per dose cohort; from day 22 onwards, n = 11 for the 1-μg and 10-μg dose cohorts). Arrowheads indicate days of vaccination. Pre-dose responses (pre) across all dose levels were combined. Samples from individuals who had recovered from infection with SARS-CoV-2 or COVID-19 (‘human convalescent samples’ (HCS)) (n = 38) were obtained at least 14 days after PCR-confirmed diagnosis and at a time at which the donors were no longer symptomatic. Each serum was tested in duplicate and geometric mean 50% (pseudo)neutralizing titres (GMTs) were plotted. a, SARS-CoV-2 50% neutralization titres (VNT50). For values below the lower limit of quantification (LLOQ; 20), LLOQ/2 values are plotted. Group GMTs (values above bars) with 95% confidence intervals. b, Pseudovirus 50% neutralization titres (pVNT50) across a panel of pseudoviruses displaying SARS-CoV-2 S variants, including Wuhan-Hu-1 (wild type), B.1.1.298 with four point mutations (B.1.1.298 (Δ4)) and B.1.351 with all ten lineage-defining mutations (B.1.351 (Δ10)) or eight of those mutations (B.1.351 (Δ8)); 30-μg dose cohort, n = 1 for day 29, n = 11 for day 43.
All participants who received dose levels greater than 1 μg had detectable antigen-binding antibody concentrations and virus neutralizing serum titres after the booster dose. On day 22, geometric mean concentrations (GMCs) of S1-binding IgG had increased in all dose cohorts and were in the range of 49 to 1,161 U ml−1 (Extended Data Fig. 4a). We observed a dose-level dependency only between the 1- and 10-μg dose levels. On day 29, S1-binding IgG GMCs showed a strong booster response that ranged from 691 to 8,279 U ml−1. S1-binding antibody GMCs declined to a range of 1,384 to 2,991 U ml−1 at day 85, which is well above the level observed in individuals who had recovered from COVID-19 (631 U ml−1). We made similar observations when using only the RBD as the target antigen (Extended Data Fig. 4a).
SARS-CoV-2 GMTs of sera increased modestly in a proportion of participants after the priming dose (day 22) (Fig. 1a). After the booster dose (day 29), GMTs increased substantially to 169, 195 or 312 in participants immunized with 10 μg, 20 μg or 30 μg BNT162b2, respectively, but increased only minimally in participants immunized with 1 μg BNT162b2 (GMT of 25). GMTs initially decreased thereafter, and remained stable from day 43 up to day 85 for participants who were vaccinated with BNT162b2 dose levels of 10 to 30 μg. At day 85, GMTs ranged from 120 to 181, and were 1.3- to 1.9-fold those of individuals who had recovered from COVID-19 (GMT of 94). All participants immunized with 30 μg BNT162b2 remained well above a GMT of 40 throughout the entire follow-up period (until day 85) (Extended Data Fig. 4b).
For dose levels of 10 μg and greater, the S1-binding IgG GMCs gradually declined from a peak on day 29, which is a typical response of B cells that are cognately activated by either natural infection or vaccination (reflecting an initial over-proliferation followed by contraction)24,25. By contrast, GMTs initially decreased after their peak on day 29 and stabilized around day 43, which implies the selection and affinity maturation of functional antibodies. Neutralizing-antibody GMTs correlated strongly with S1-binding IgG GMCs (Extended Data Fig. 4c).
We investigated the breadth of inhibition of virus entry by BNT162b2-elicited antibodies using a vesicular stomatitis virus (VSV)-based SARS-CoV-2 pseudovirus neutralization assay (pVNT). We investigated 22 pseudoviruses: 19 of these contained SARS-CoV-2 S with a single mutation that has been identified in one of the common circulating virus strains26,27, and 3 displayed S with sets of mutations that are found in either the mink-related SARS-CoV-2 variant B.1.1.298 that was first identified in Denmark28 or the SARS-CoV-2 variant B.1.351 that was first identified in South Africa29. We conducted the single- and multiple-mutant pVNTs using different protocols, and the resulting neutralization titres are not comparable. Sera collected from BNT162b2-vaccinated participants on day 29 had high neutralizing titres to each of the SARS-CoV-2 S variants with a single amino acid altered (Extended Data Fig. 4d). Likewise, BNT162b2-immune sera collected on day 29 or 43 neutralized pseudovirus bearing the S of B.1.1.298 with four point mutations as efficiently as they did pseudovirus with the S of SARS-CoV-2 Wuhan-Hu-1 (wild type) (Fig. 1b). Pseudoviruses with the S of B.1.351 with either ten mutations or a reduced set of eight mutations were neutralized at lower GMTs than the wild-type strain (33 and 30, respectively, as compared to 150). All of the BNT162b2-immune sera that we tested neutralized all the pseudoviruses, and no pseudovirus escaped neutralization.
Vaccine-induced T cell responses
We analysed the T cell responses of 37 participants immunized with BNT162b2 from the 1-, 10-, 20- and 30-μg dose cohorts on day 1 (pre-prime) and 29 (one week after the boost) and from six 30-μg-dosed participants on day 85 (nine weeks after the boost) using an ex vivo IFNγ enzyme-linked immunosorbent spot (ELISpot) assay (Extended Data Table 2). SARS-CoV-2 S is composed of a signal peptide (amino acids 1–13), the N-terminal S1 protease fragment (amino acids 14–685) containing the RBD (amino acids 319–541) and the C-terminal S2 protease fragment (amino acids 686–1273). We stimulated CD4+ or CD8+ T cell effectors overnight with overlapping pools of peptides representing the N-terminal ‘S pool 1’ (amino acids 1–643), the C-terminal ‘S pool 2’ (amino acids 633–1273) and the ‘RBD’ (amino acids 1–16 fused to amino acids 327–528 of S) of SARS-CoV-2 S.
After the booster dose (day 29), we detected robustly expanded SARS-CoV-2 S-specific CD4+ T cells in all 37 participants at all BNT162b2 dose levels (Fig. 2a, Extended Data Fig. 5a, b). Thirty of the 34 participants with available pre-vaccination peripheral blood mononuclear cells (PBMCs) (88.2%) had de novo CD4+ T cell responses against both of the S pools. One participant had a de novo response only against S pool 2. The remaining three participants had de novo responses against S pool 1 and low numbers of pre-existing S-pool-2-reactive CD4+ T cells. In these three participants, the pre-existing S-pool-2 responses were amplified by vaccination in the range of 3-, 5- or 13-fold. In conclusion, in 94.1% (32 out of 34) of participants, two doses of BNT162b2 induced poly-epitopic CD4+ T cell responses (de novo or amplified) directed against both N- and C-terminal portions of S.

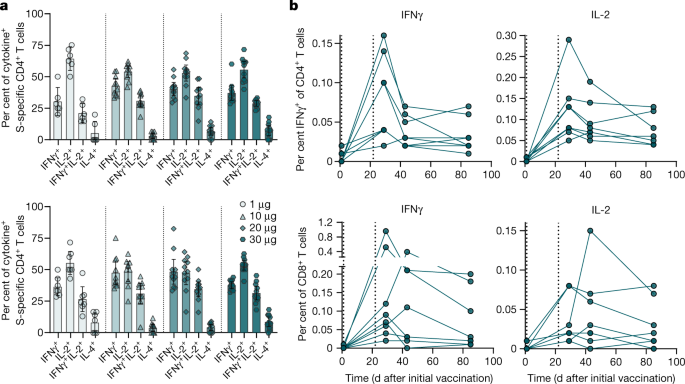
a–c, PBMCs obtained on day 1 (pre), day 29 (dose cohorts of 1, 10 and 20 μg, n = 9 each; 30 μg, n = 10) and day 85 (30-μg dose cohort) were enriched for CD4+ or CD8+ T cells and separately stimulated overnight with overlapping peptide pools representing the wild-type sequence of SARS-CoV-2 S (S pool 1 and S pool 2), CMV, EBV, influenza virus and tetanus toxoid (CEFT) or CMV, EBV and influenza virus (CEF) pools for assessment by IFNγ ELISpot. Cumulative responses to both S pools are shown in b, c. Each data point represents the normalized mean spot count from duplicate wells for one study participant, after subtraction of the non-stimulated control. Numbers above each dataset in a, c represent the number of participants with a positive T cell response over the number of participants tested. a, S-specific CD4+ (top) and CD8+ (bottom) T cell responses for each dose cohort for S pool 1 (left panels) and S pool 2 (right panels). Spot count data from two participants from the 20-μg dose cohort could not be normalized and are not plotted. b, CD4+ (left) and CD8+ (right) T cell responses to S and recall antigens (CEF or CEFT) in all participants with a positive response on day 29 after initial vaccination. Horizontal bars indicate median values. c, Kinetics of CD4+ (left) and CD8+ (right) T cell responses in six participants from the 30-μg dose cohort. Vertical dotted lines indicate days of vaccination.
At dose levels of 10 μg or higher, the magnitude of CD4+ T cell responses was not dose-dependent and varied between individuals. In the strongest-responding individuals, the S-specific CD4+ T cell responses were more than tenfold the individual memory responses to common viruses and recall antigens (cytomegalovirus (CMV), Epstein–Barr virus (EBV), influenza virus and tetanus toxoid) (Fig. 2b, Extended Data Fig. 5c).
The majority of vaccine-induced S-specific CD8+ T cell responses that we detected in 34 of 37 participants (91.9%) were strong, with magnitudes comparable to individual memory responses against CMV, EBV and influenza virus (Fig. 2a, b, Extended Data Fig. 5a–c).
De novo S-specific CD8+ T cell responses were induced in 33 participants. These were directed against both (22 participants) or one of the S pools (S pool 1 in 10 participants and S pool 2 in 2 participants), indicating a poly-epitopic response that included non-RBD S-specific T cells (Extended Data Fig. 5d). In seven participants, we detected pre-existing CD8+ T cell responses to S pool 2 that were not further augmented by vaccination. Six out of these seven participants had a concurrent de novo response to S pool 1, which did not differ in strength from those responses that we observed in individuals without pre-existing responses to S pool 2 (Extended Data Fig. 5e). Of note, the strongest responses (higher than third quartile) against S pool 1 among the 34 participants with detectable CD8+ T cell responses were observed in those without pre-existing S-pool-2-specific responses.
Both the CD4+ and the CD8+ T cell responses contracted after day 29 in participants vaccinated with 30 μg BNT162b2, and were higher than or in the range of recall antigen memory responses on day 85 (Fig. 2c, Extended Data Fig. 5f).
The magnitude of S-specific CD4+ T cell responses correlated positively with S1-binding IgG (Extended Data Fig. 6a) and, consistent with the concept of intramolecular help30, also with the strength of S-specific CD8+ T cell responses (Extended Data Fig. 6b). S-specific CD8+ T cell responses correlated with S1-binding IgG (Extended Data Fig. 6c), which implies a convergent development of the humoral and cellular adaptive immunity.
Polarization of T cell responses
We determined cytokine secretion in response to stimulation with S pool 1, S pool 2 and RBD pool by intracellular staining in PBMCs of 41 participants immunized with BNT162b2 (Extended Data Table 2). A considerable fraction of vaccine-induced, S-specific CD4+ T cells secreted IFNγ, IL-2 or both, whereas we barely detected T cells secreting the T helper 2 cell cytokine IL-4 (Fig. 3a, Extended Data Fig. 7a–c). S-specific CD8+ T cells secreted predominantly IFNγ, and lower levels of IL-2, in response to S pool 1 and S pool 2 stimulation. Fractions of IFNγ+CD8+ T cells specific to S pool 1 constituted up to about 1% of total peripheral blood CD8+ T cells (Extended Data Fig. 7d). Confirming ELISpot findings, seven participants displayed pre-existing S-pool-2-specific CD8+ T cell responses, which were not further amplified by vaccination in six participants. We detected a strong pre-existing S-pool-2-specific IFNγ+CD4+ T cell response in one participant (Extended Data Fig. 7b). The fraction of IFNγ and IL-2 cytokine-producing T cells induced by the vaccine strongly increased by day 29, declined until day 43 and stabilized towards day 85 (Fig. 3b, Extended Data Fig. 7e).
a, b, PBMCs obtained on day 1 (pre), day 29 (dose cohorts 1 μg, n = 8; 10, 20 and 30 μg, n = 11 each), day 43 and day 85 (30-μg dose cohort, n = 8) were stimulated overnight with overlapping peptide pools representing the wild-type sequence of SARS-CoV-2 S (S pool 1 and S pool 2) for assessment by flow cytometry (gating strategy in Supplementary Fig. 1). Participant PBMCs were tested without replicates. a, S-specific CD4+ T cells producing the indicated cytokine as a fraction of total cytokine-producing S-specific CD4+ T cells on day 29 after initial vaccination, for S pool 1 (top) and S pool 2 (bottom). CD4 non-responding individuals (<0.03% total cytokine-producing T cells: 1 μg, n = 2 (S pool 1) and n = 1 (S pool 2); 10 μg, n = 1) were excluded. Arithmetic means with 95% confidence intervals are shown. Pre-vaccination values from all analysed participants are plotted in Extended Data Fig. 7b. b, Kinetics of S-pool-1-specific CD4+ (top) and CD8+ (bottom) T cell responses producing IFNγ (left) or IL-2 (right) as a fraction of total circulating T cells of the same subset. Vertical dotted lines indicate days of vaccination.
In both assay systems, the cytokine production of CD4+ and CD8+ T cells in response to peptide pools comprising full SARS-CoV-2 S exceeded the responses against the RBD peptide pool, which further confirms the poly-specific nature of T cell responses elicited by BNT162b2. The mean fraction of S-specific IFNγ+ or IL-2+ CD4+ and CD8+ T cells induced by BNT162b2 within total circulating T cells was higher than that we detected in individuals who had recovered from COVID-19 (Extended Data Fig. 7b, d).
Specificity and phenotype of CD8+ T cells
We investigated epitope-specific CD8+ T cell responses in the PBMCs of three participants vaccinated with BNT162b2 with individual peptide–MHC (pMHC) multimer cocktails by flow cytometry analysis. Twenty-three (4 for HLA-B*0702 and 19 for HLA-A*2402), 14 (all HLA-B*3501) and 23 (7 for HLA-B*4401 and 16 for HLA-A*0201) pMHC allele pairs were used for participants 1, 2 and 3, respectively. We identified several epitopes for each participant, representing eight different epitope–MHC pairs that were recognized by de novo-induced CD8+ T cells and were spread across the full length of S (Fig. 4a, b). All eight epitopes are fully conserved in the B.1.351, the B.1.1.7 (first identified in the UK) and P.1 (first identified in Brazil) lineages (Extended Data Fig. 7f). In the B.1.1.298 lineage, one epitope was altered in a single amino acid.

a, c, PBMCs obtained on day 1 (pre), day 29 and day 85 of three vaccinated participants (dose cohorts 10 μg, n = 1; 30 μg, n = 2) were analysed for CD8+ T cell epitope specificity (a) and phenotype (c) by flow cytometry (gating strategy in Supplementary Fig. 2). Peptide sequences above dot plots indicate pMHC class I multimer epitope specificity. Numbers above dot plots indicate the amino acid positions within S. b, Location of identified MHC class I-restricted epitopes within S.
The magnitude of epitope-specific CD8+ T cell responses ranged from 0.02 to 2.92% of peripheral CD8+ T cells, with the most notable expansion for HLA-A*0201–YLQPRTFLL, HLA-A*2402–QYIKWPWYI and HLA-B*3501–QPTESIVRF, and contracted to 0.01 to 0.28% by day 85.
Compared to the pMHC multimer assay (which non-comprehensively samples discrete, predefined T cell reactivities), we found that the CD8+ responses determined by ELISpot and intracellular staining in bulk PBMCs underestimated the true magnitude of the poly-specific cellular immune response (Extended Data Fig. 7g).
The pMHC multimer+ S-specific CD8+ T cells that we identified were of an early-differentiated, central or effector memory phenotype on day 29 (Fig. 4c). On day 85, epitope-specific CD8+ T cells were unchanged in participants 1 and 2 and differentiated towards CD45RA re-expressing cells with CD27 and CD28 co-expression in participant 3, which suggests an early-differentiated state.
Discussion
Effectors of the adaptive immune system have complementary roles in virus defence. Antibodies neutralize free virus, whereas CD8+ cytotoxic T lymphocytes clear the intracellular virus compartment; CD4+ T cells exert various functions, including providing cognate help to B and T cells, promoting memory generation and indirect (for example, via IFNγ) or direct (against MHC-class-II-expressing target cells) cytotoxic activity.
The sufficiency of neutralizing antibodies alone for full and long-lasting protective immunity to SARS-CoV-2, and the contribution of SARS-CoV-2-specific T cells, remain unclear. An increasing amount of data supports a role of T cells31,32,33, such as case reports of patients with critical COVID-19 who lack S1-reactive CD4+ T cells34 and of asymptomatic virus exposure being associated with cellular immune responses and without seroconversion29.
We show that BNT162b2 induces a broad immune response with SARS-CoV-2 S-specific neutralizing antibodies and poly-specific CD4+ and CD8+ T cells. All evaluable participants vaccinated with BNT162b2 mounted de novo S-specific CD4+ T cell responses, and almost 90% of participants mounted de novo CD8+ T cell responses. We observed potent memory T cell responses for the full observation period (of nine weeks after the booster dose). The magnitude of the T cell responses varied between individuals and, above a dose level of 1 μg, was independent of dose level. Robust expression of IFNγ and IL-2, and low levels of IL-4, in BNT162b2-induced CD4+ T cells indicated a T helper 1 cell profile.
Although CD8+ T cell responses against the S1 subunit were not detected at baseline, several individuals had pre-existing immune responses against the S2 subunit, most probably owing to the similarity of its sequence to corresponding seasonal-coronavirus sequences and pre-existing cross-reactive CD8+ T cells35,36.
T cell recognition of epitopes spread across the entire length of S was one of the reasons to favour BNT162b2 over BNT162b114. In three participants, we identified single S epitopes that were recognized by vaccine-induced CD8+ T cells and were highly conserved across various circulating SARS-CoV-2 variants. The set of single-epitope-reactive T cells for each individual was identified by a candidate approach that was not designed to capture the full spectrum of the vaccine-induced reactivities of that individual across all their restriction elements. Consequently, the pMHC multimers visualize only a fraction of the full vaccine-induced repertoire for each of the three participants. Nonetheless, in each participant the magnitude of the sum of the identified single-epitope T cell responses exceeded their overall T cell response measured by ELISpot and intracellular staining assay, as these assays stimulate with peptide pools in which the immunogenic epitopes compete with each other and thus yield lower T cell frequencies as compared to single-peptide analyses.
A high proportion of boosted CD8+ T cells were early-differentiated central effector and memory cells; the T cell population contracted and further differentiated towards an early-differentiated memory phenotype with co-expression of CD27 and CD28. This favourable phenotype has the potential to respond rapidly to infection, but has a limited capacity to produce IFNγ, and thus is less likely to be detected in functional T cell assays with PBMCs. Although SARS-CoV-2 S-derived CD8+ T cell epitopes after natural infection have previously been published (including the immunodominant HLA-A*0201-restricted peptide YLQPRTFLL that is also identified in this Article)37,38, to our knowledge this is the first report of epitopes recognized by vaccine-induced T cells.
The breadth and poly-specific nature of CD8+ and CD4+ T cell responses, and the linear nature of T cell epitopes that make them less susceptible to the secondary conformation-driven effects of a single amino acid variation, may mitigate the risk of immune escape of new variant strains. All eight S epitopes recognized by BNT162b2-elicited CD8+ T cells were shared by the vaccine-targeted SARS-CoV-2 isolate, and by B.1.1.7, P.1 and B.1.351 lineages. In the B.1.1.298 lineage, which has not demonstrated sustained human-to-human transmission, only one of the eight CD8+ T cell epitopes showed a single-point mutation (which may or may not affect its binding to the respective MHC molecule).
As reported for the phase-I/II trial in the USA2, prime–boost vaccination with 10 to 30 μg of BNT162b2 elicited GMTs of sera that—after an initial decline—remained stable for the entire follow-up of nine weeks after the booster dose, in the range of or higher than GMTs in individuals who had recovered from COVID-19.
Of the 22 pseudotyped viruses with the S mutations of circulating SARS-CoV-2 variants, almost all were efficiently neutralized by BNT162b2-immune sera. Although neutralizing-antibody GMTs against the two pseudoviruses representing B.1.351-lineage S proteins were neutralized at reduced GMTs, no escape from neutralization was noted. Together with recent reports of the preserved neutralization of SARS-CoV-2 with key S mutations found in the B.1.1.7 and the B.1.351 lineage39,40, and neutralization of pseudovirus bearing the full set of mutations of B.1.1.7 S41, our data indicate broad BNT162b2-elicited immune recognition2,13,14.
Phase-III trial data1 and real-world data3,4,5 show that a single 30-μg dose of BNT162b2, although associated with low neutralizing antibody titres, confers partial disease protection. Potential explanations may be that S1-binding antibodies exert antiviral effects by other mechanisms, such as antibody-dependent cytotoxicity or phagocytosis, or by the contribution of vaccine-induced T cells.
The limitations of our clinical study include the small sample size, the lack of representation of populations of interest and limited availability of blood samples for a more in-depth T cell analysis. These are being addressed by the ongoing clinical programme and emerging real-world data.
Methods
The experiments were not randomized, and investigators were not blinded to allocation during experiments and outcome assessment.
Clinical trial design
Study BNT162-01 (NCT04380701) is an ongoing, umbrella-type first-in-human, phase-I/II, open-label, dose-ranging clinical trial to assesses the safety, tolerability and immunogenicity of ascending dose levels of various intramuscularly administered BNT162 mRNA vaccine candidates in healthy men and non-pregnant women of 18 to 55 years (amended to add 56–85 years) of age. The principal end points of the study are safety and immunogenicity. Key exclusion criteria include previous clinical or microbiological diagnosis of COVID-19; receipt of medications to prevent COVID-19; previous vaccination with any coronavirus vaccine; a positive serological test for SARS-CoV-2 IgM and/or IgG; and a SARS-CoV-2 nucleic acid amplification test-positive nasal swab; increased risk for severe COVID-19; and immunocompromised individuals.
The presented data are from the BNT162b2-immunized healthy adults 19 to 55 years of age exposed to dose levels 1, 10, 20 or 30 μg. The data are based on a preliminary analysis (data extraction date of 23 October 2020 for safety and antibody analysis, and 28 January 2021 and 17 February 2021 for T cell analysis (ELISpot and intracellular staining (ICS), respectively)) and are focused on the analysis of vaccine-induced immunogenicity descriptively summarized at the various time points, and on reactogenicity. All participants with data available were included in the immunogenicity analyses. This part of the study was performed at one site in Germany with 12 healthy participants per dose level in a dose-escalation and de-escalation design. Sentinel dosing was performed in each dose-escalation cohort. Progression in that cohort and dose escalation required data review by a safety review committee. Participants received a BNT162b2 priming dose on day 1, and a booster dose on day 22 ± 2 (on day 28 for one participant from the 10-μg dose cohort). Serum for antibody and neutralization assays was obtained on day 1 (pre-prime), 8 ± 1 (post-prime), 22 ± 2 (pre-boost), 29 ± 3, 43 ± 4, 50 ± 4 and 85 ± 7 (post-boost; for all dose levels except 1 μg). PBMCs for T cell studies were obtained on day 1 (pre-prime), 29 ± 3, 43 ± 4 and 85 ± 7 (post-boost) (Extended Data Fig. 1). Follow-up of participants is ongoing and includes assessment of antibody and T cell responses at later time points. Reactogenicity was assessed by patient diary. One participant (1-μg dose cohort) withdrew before the booster dose for reasons unrelated to the study drug and was not available for further follow-up. Another participant (10-μg dose cohort) presented with concurrent moderate nasopharyngitis unrelated to the study drug when the booster dose was due; this participant did not receive the booster dose but remained on the study for follow-up. The trial was carried out in Germany in accordance with the Declaration of Helsinki and Good Clinical Practice Guidelines and with approval by an independent ethics committee (Ethik-Kommission of the Landesärztekammer Baden-Württemberg, Stuttgart, Germany) and the competent regulatory authority (Paul-Ehrlich Institute, Langen, Germany). All participants provided written informed consent.
mRNA vaccine manufacturing
BNT162b2 incorporates a Good Manufacturing Practice-grade, codon-optimized mRNA drug substance that encodes trimerized SARS-CoV-2 S derived from the Wuhan-Hu-1 isolate (GenBank: QHD43416.1; amino acids 1–1273) and carrying mutations K986P and V987P (S stabilized in its prefusion conformation (P2 S)). The RNA is generated from a DNA template by in vitro transcription in the presence of 1-methylpseudouridine-5′-triphosphate (Thermo Fisher Scientific) instead of uridine-5′-triphosphate. Capping is performed co-transcriptionally using a trinucleotide cap 1 analogue ((m27,3′-O)Gppp(m2′-O)ApG) (TriLink). The antigen-encoding RNA contains sequence elements that increase RNA stability and translation efficiency in human dendritic cells15,16. The mRNA is formulated with lipids (ALC-3015, ALC-0159, DSPC and cholesterol) in an aqueous solution of sucrose, NaCl, KCl, Na2HPO4 and KH2PO4 to obtain the RNA–lipid nanoparticle drug product. The vaccine was transported and supplied as a buffered-liquid solution for intramuscular injection and was stored at −80 °C.
Proteins and peptides
Two pools of 15-mer peptides overlapping by 11 amino acids and together covering the whole sequence of wild-type (no P2 S mutation) SARS-CoV-2 S (Wuhan-Hu-1, GenBank: QHD43416.1; S pool 1 featuring amino acids 1–643, S pool 2 featuring amino acids 633–1273) and one pool covering SARS-CoV-2 RBD (amino acids 327–528) with the signal peptide of S (amino acids 1–16) fused to its N terminus were used for ex vivo stimulation of PBMCs for flow cytometry and IFNγ ELISpot. CEF (CMV, EBV and influenza virus; HLA class I epitope peptide pool) and CEFT (CMV, EBV, influenza virus and tetanus toxoid; HLA class II epitope peptide pool) were used to benchmark the magnitude of memory T cell responses. All peptides were obtained from JPT Peptide Technologies. The 8–12-amino-acid-long peptides used in the easYmer assays were produced at BioNTech US.
Human convalescent serum and PBMC panel
Sera from individuals (n = 38) who had been infected with SARS-CoV-2 or recovered from COVID-19 were drawn from donors 18–83 years of age at least 14 days after PCR-confirmed diagnosis and at a time at which the participants were asymptomatic. The mean age of the donors was 45 years. GMTs in subgroups of the donors were as follows: symptomatic infections, 90 (n = 35); asymptomatic infections, 156 (n = 3); hospitalized, 618 (n = 1). Sera were obtained from Sanguine Biosciences, the MT Group and Pfizer Occupational Health and Wellness. The data presented for these sera have previously been reported2,13,14. PBMC samples from individuals (n = 18) who had been infected with SARS-CoV-2 or recovered from COVID-19 were collected from donors 22–79 years of age 30–62 days after PCR-confirmed diagnosis, when donors were asymptomatic. PBMC donors had asymptomatic or mild infections (n = 16, clinical score 1 and 2) or had been hospitalized (n = 2, clinical score 4 and 5). Blood samples were obtained from the Frankfurt University Hospital.
Cell culture and primary cell isolation
HEK293T/17 cells (American Type Culture Collection (ATCC) CRL-11268), Vero cells (ATCC CCL-81), Vero E6 cells (ATCC CRL-1586) and Vero 76 cells (ATCC CRL-1587) were cultured in Dulbecco’s modified Eagle’s medium (DMEM) with GlutaMAX (Gibco) supplemented with 10% fetal bovine serum (FBS) (Sigma-Aldrich). Cell lines were tested for mycoplasma contamination after receipt and before expansion and cryopreservation. PBMCs were isolated by Ficoll-Paque PLUS (Cytiva) density gradient centrifugation and cryopreserved before analysis.
S1- and RBD-binding IgG assay
To enable the comparison of vaccine-induced S1- and RBD-binding IgG responses to previously reported data on the BioNTech–Pfizer RNA vaccines for COVID-19, sera were analysed as previously described2,13,14. In brief, recombinant SARS-CoV-2 S1 or RBD containing a C-terminal Avitag (Acro Biosystems) were bound to streptavidin-coated Luminex microspheres. Heat-inactivated participant sera were diluted 1:500, 1:5,000 and 1:50,000. Following an overnight incubation at 2–8 °C while shaking, plates were washed in a solution containing 0.05% Tween-20. A secondary fluorescently labelled goat anti-human polyclonal antibody (Jackson Labs) was added for 90 min at room temperature while shaking, before plates were washed once more in a solution containing 0.05% Tween-20. Data were captured as median fluorescent intensities using a Bioplex200 system (Bio-Rad) and converted to U ml−1 antibody concentrations using a reference standard curve with arbitrarily assigned concentrations of 100 U ml−1 and accounting for the serum dilution factor. The reference standard was composed of a pool of 5 serum samples from individuals who had recovered from COVID-19 obtained >14 days after COVID-19 PCR diagnosis and was diluted sequentially in antibody-depleted human serum. Three dilutions were used to increase the likelihood that at least one result for any sample would fall within the useable range of the standard curve. Assay results were reported in U ml−1 of IgG. The final assay results were expressed as the geometric mean concentration of all sample dilutions that produced a valid assay result within the assay range.
SARS-CoV-2 neutralization assay
To enable the comparison of vaccine-induced serum neutralizing titres to those previously reported for BioNTech–Pfizer RNA vaccines for COVID-19, sera were analysed as previously described2,13,14. In brief, the neutralization assay used a previously described strain of SARS-CoV-2 (USA_WA1/2020) that had been rescued by reverse genetics and engineered by the insertion of an mNeonGreen (mNG) gene into open reading frame 7 of the viral genome42. The USA_WA1/2020 strain S is identical in sequence to the wild-type SARS-CoV-2 S (Wuhan-Hu-1 isolate). The reporter virus generates similar plaque morphologies and indistinguishable growth curves from wild-type virus. Viral master stocks (2 × 10⁷ plaque forming units (PFU) per ml) were grown in Vero E6 cells as previously described42. With sera from patients who had recovered from COVID-19, the fluorescent neutralization assay produced comparable results to the conventional plaque reduction neutralization assay43. Serial dilutions of heat-inactivated sera were incubated with the reporter virus (2 × 10⁴ PFU per well to yield a 10–30% infection rate of the Vero CCL81 monolayer) for 1 h at 37 °C before inoculating Vero CCL81 cell monolayers (targeted to have 8,000 to 15,000 cells in a central field of each well at the time of seeding, 24 h before infection) in 96-well plates to allow accurate quantification of infected cells. Total cell counts per well were enumerated by nuclear stain (Hoechst 33342) and fluorescent virally infected foci were detected 16–24 h after inoculation with a Cytation 7 Cell Imaging Multi-Mode Reader (BioTek) with Gen5 Image Prime version 3.09. Titres were calculated in GraphPad Prism version 8.4.2 by generating a four-parameter logistical fit of the per cent neutralization at each serial serum dilution. The VNT50 is reported as the interpolated reciprocal of the dilution yielding a 50% reduction in fluorescent viral foci.
VSV-SARS-CoV-2 S pseudovirus neutralization assay for single-amino-acid-exchange S
VSV-SARS-CoV-2-S pseudoparticle generation and neutralization assays were performed as previously described26. In brief, human codon optimized SARS-CoV-2 S-encoding DNA (GenBank: MN908947.3) was synthesized (Genscript) and cloned into an expression plasmid. SARS-CoV-2 complete genome sequences representing circulating variants were downloaded from the GISAID nucleotide database (https://www.gisaid.org) late in the spring of 2020. Sequences were curated, and the genetic diversity of the S-encoding gene was assessed across high-quality genome sequences using custom pipelines. The most abundant amino acid substitutions identified were cloned into the S expression plasmid using site-directed mutagenesis. HEK293T cells (ATCC CRL-3216) were seeded (culture medium: DMEM high glucose (Life Technologies) supplemented with 10% heat-inactivated FBS (Life Technologies) and penicillin, streptomycin and l-glutamine (Life Technologies)), and transfected the following day with S expression plasmid using Lipofectamine LTX (Life Technologies) following the manufacturer’s protocol. At 24 h after transfection at 37 °C, cells were infected with VSV glycoprotein (VSV-G) trans-complemented VSV encoding the mNeonGreen fluorescent reporter gene instead of the native viral glycoprotein (VSVΔG:mNeon/VSV-G) diluted in Opti-MEM (Life Technologies) at a multiplicity of infection of 1. Cells were incubated 1 h at 37 °C, washed to remove residual input virus and overlaid with infection medium (DMEM high glucose supplemented with 0.7% low IgG bovine serum albumin (Sigma), sodium pyruvate (Life Technologies) and 0.5% gentamicin (Life Technologies)). After 24 h at 37 °C, the medium containing VSV-SARS-CoV-2-S pseudoparticles was collected, centrifuged at 3,000g for 5 min to clarify and stored at −80 °C until further use.
For pseudovirus neutralization assays, Vero cells (ATCC CCL-81) were seeded in 96-well plates in culture medium and allowed to reach approximately 85% confluence before use in the assay (24 h later). Sera were serially diluted 1:2 in infection medium starting with a 1:300 dilution. VSV-SARS-CoV-2-S pseudoparticles were diluted 1:1 in infection medium for a fluorescent focus unit count in the assay of about 1,000. Serum dilutions were mixed 1:1 with pseudoparticles for 30 min at room temperature before addition to Vero cells and incubation at 37 °C for 24 h. Supernatants were removed and replaced with PBS (Gibco), and fluorescent foci were quantified using the SpectraMax i3 plate reader with MiniMax imaging cytometer (Molecular Devices). Neutralization titres were calculated in GraphPad Prism version 8.4.2 by generating a four-parameter logistical fit of the per cent neutralization at each serial serum dilution. The pVNT50 is reported as the interpolated reciprocal of the dilution yielding a 50% reduction in fluorescent viral foci.
VSV-SARS-CoV-2 S pseudovirus neutralization assay for multiple-site mutations
A recombinant replication-deficient VSV vector that encodes green fluorescent protein (GFP) and luciferase (Luc) instead of VSV-G was pseudotyped with Wuhan-Hu-1 isolate SARS-CoV-2 S (GenBank: QHD43416.1) variants according to published pseudotyping protocols44. One variant had four mutations from S of the B.1.1.298 lineage (also referred to as SARS-CoV-2/hu/DK/CL-5/1) (Y453F/D614G/I692V/M1229I)28. Two variants had either eight (D80A/D215G/Δ242–244/K417N/E484K/N501Y/D614G/A701V) or ten mutations (L18F/D80A/D215G/R246I/Δ242–244/K417N/E484K/N501Y/D614G/A701V) found in S of the B.1.351 lineage (also referred to as 20C/501Y.V2)40. In brief, HEK293T/17 monolayers transfected to express SARS-CoV-2 S with the C-terminal cytoplasmic 19 amino acids (SARS-CoV-2-S(CΔ19)) truncated were inoculated with the VSVΔG–GFP/Luc vector. After incubation for 1 h at 37 °C, the inoculum was removed, and cells were washed with PBS before medium supplemented with anti-VSV-G antibody (clone 8G5F11, Kerafast) was added to neutralize residual input virus. VSV-SARS-CoV-2 pseudovirus-containing medium was collected 20 h after inoculation, 0.2-μm filtered and stored at −80 °C.
For pseudovirus neutralization assays, 40,000 Vero 76 cells were seeded per 96-well. Sera were serially diluted 1:2 in culture medium starting with a 1:10 dilution (dilution range of 1:10 to 1:2,560). VSV-SARS-CoV-2-S pseudoparticles were diluted in culture medium for a fluorescent focus unit count in the assay of about 1,000. Serum dilutions were mixed 1:1 with pseudovirus for 30 min at room temperature before addition to Vero 76 cell monolayers in 96-well plates and incubation at 37 °C for 24 h. Supernatants were removed, and the cells were lysed with luciferase reagent (Promega). Luminescence was recorded, and neutralization titres were calculated by generating a four-parameter logistical fit of the per cent neutralization at each serial serum dilution. The pVNT50 is reported as the interpolated reciprocal of the dilution yielding a 50% reduction in luminescence.
IFNγ ELISpot
IFNγ ELISpot analysis was performed ex vivo using PBMCs depleted of CD4+ and enriched for CD8+ T cells (CD8+ effectors) or depleted of CD8+ and enriched for CD4+ T cells (CD4+ effectors). Tests were performed in duplicate and with a positive control (anti-CD3 monoclonal antibody CD3-2 (1:1,000; Mabtech)). Multiscreen filter plates (Merck Millipore) pre-coated with IFNγ-specific antibodies (ELISpotPro kit, Mabtech) were washed with PBS and blocked with X-VIVO 15 medium (Lonza) containing 2% human serum albumin (CSL-Behring) for 1–5 h. Per well, 3.3 × 10⁵ effector cells were stimulated for 16–20 h with overlapping peptide pools that are described in ‘Vaccine-induced T cell responses’. Bound IFNγ was visualized using a secondary antibody directly conjugated with alkaline phosphatase followed by incubation with 5-bromo-4-chloro-3′-indolyl phosphate and nitro blue tetrazolium substrate (ELISpotPro kit, Mabtech). Plates were scanned using an AID Classic Robot ELISPOT Reader and analysed by AID ELISPOT 7.0 software (AID Autoimmun Diagnostika). Spot counts were displayed as mean values of each duplicate.
Peptide-stimulated spot counts were compared to effectors incubated with medium only as negative control using an in-house ELISpot data analysis tool, based on two statistical tests (distribution-free resampling) according to previous publications45,46.
To account for varying sample quality reflected in the number of spots in response to anti-CD3 antibody stimulation, we applied a normalization method that enabled direct comparison of spot counts and strength of response between individuals. This dependency was modelled in a log-linear fashion with a Bayesian model including a noise component (R.H., unpublished). For a robust normalization, each normalization was sampled 10,000 times from the model and the median taken as normalized spot count value. Likelihood of the model: log(λE) = αlog(λP) + log(βj) + σε, in which λE is the normalized spot count of the sample; α is a stable factor (normally distributed) common among all positive controls, λP; βj is a sample-j-specific component (normally distributed); and σε is the noise component, of which σ is Cauchy distributed and ε is Student’s-t distributed. βj ensures that each sample is treated as a different batch.
Intracellular cytokine staining by flow cytometry
Cytokine-producing T cells were identified by intracellular cytokine staining. PBMCs, thawed and rested for 4 h in OpTmizer medium supplemented with 2 μg ml−1 DNase I (Roche), were restimulated with different portions of the wild-type sequence of SARS-CoV-2 S in peptide pools described in ‘IFNγ ELISpot’ (2 μg per ml per peptide) (JPT Peptide Technologies) in the presence of GolgiPlug (BD) for 18 h at 37 °C. Controls were treated with dimethyl sulfoxide (DMSO)-containing medium. Cells were stained for viability and surface markers (CD3 BV421, 1:250; CD4 BV480, 1:50; CD8 BB515, 1:100; all BD Biosciences) in flow buffer (DPBS (Gibco) supplemented with 2% FBS (Sigma), 2 mM EDTA (Sigma-Aldrich)) and Brilliant Staining Buffer Plus (BSB Plus, BD Horizon, according to the manufacturer’s instructions) or in Brilliant Staining Buffer (BD Horizon) for 20 min at 4 °C. Afterwards, samples were fixed and permeabilized using the Cytofix/Cytoperm kit according to manufacturer’s instructions (BD Biosciences). Intracellular staining (CD3 BV421, 1:250; CD4 BV480, 1:50; CD8 BB515, 1:100; IFNγ PE–Cy7, 1:50 (for samples from individuals who had recovered from COVID-19); IFNγ BB700, 1:250 (for participants in the trial); IL-2 PE, 1:10; IL-4 APC, 1:500; all BD Biosciences) was performed in Perm/Wash buffer supplemented with BSB Plus (BD Horizon, according to the manufacturer’s instructions) for 30 min at 4 °C. Samples were acquired on a fluorescence-activated cell sorter (FACS) VERSE instrument (BD Biosciences) and analysed with FlowJo software version 10.6.2 (FlowJo, BD Biosciences). S- and RBD-specific cytokine production was corrected for background by subtraction of values obtained with DMSO-containing medium. Negative values were set to zero. Cytokine production in Fig. 3a was calculated by summing up the fractions of all CD4+ T cells positive for either IFNγ, IL-2 or IL-4, setting this sum to 100% and calculating the fraction of each specific cytokine-producing subset. Pseudocolor plot axes are in log10 scale. Data presented here for 15 of the 18 individuals who had recovered from COVID-19 who donated PBMCs have previously been reported14.
pMHC multimer staining by flow cytometry
To select MHC-class-I epitopes for multimer analysis, we applied a mass-spectrometry-based binding and presentation predictor47,48 to 8–12-amino-acid-long peptide sequences from S derived from the GenBank reference sequence for SARS-CoV-2 (accession: NC_045512.2, https://www.ncbi.nlm.nih.gov/nuccore/NC_045512) and paired with 18 MHC-class-I alleles with >5% frequency in the European population. Top predicted epitopes were identified by setting thresholds to the binding per cent rank (≤1%) and presentation scores (≥10−2.2). Peptides were manufactured at >90% purity. pMHC complexes were refolded with the easYmer technology (easYmer kit, ImmuneAware Aps), and complex formation was validated in a bead-based flow cytometry assay according to the manufacturer’s instructions49,50. Combinatorial labelling was used for investigating the antigen specificity of T cells using two-colour combinations of five different fluorescent labels to enable detection of up to ten different T cell populations per sample51. For tetramerization, streptavidin (ST)-fluorochrome conjugates were added: ST BV421, ST BV711, ST PE, STPE–Cy7, ST APC (all BD Biosciences). For three participants vaccinated with BNT162b2, individualized pMHC multimer staining cocktails contained up to ten pMHC complexes, with each pMHC complex encoded by a unique two-colour combination. PBMCs (2 × 10⁶) were stained ex vivo for 20 min at room temperature with each pMHC multimer cocktail at a final concentration of 4 nM in BSB Plus (BD Horizon). Surface and viability staining was carried out in flow buffer (DPBS (Gibco) with 2% FBS (Sigma), 2 mM EDTA (Sigma-Aldrich)) supplemented with BSB Plus for 30 min at 4 °C (CD3 BUV395, 1:50; CD45RA BUV563, 1:200; CD27 BUV737, 1:200; CD8 BV480, 1:200; CD279 BV650, 1:20; CD197 BV786, 1:15; CD4 BB515, 1:50; CD28 BB700, 1:100; CD38 BUV805, 1:300; HLA-DR APC-R700, 1:150 (all BD Biosciences); CD57 BV605, 1:600 (Biolegend); DUMP channel: CD14 APC–eFluor780, 1:100; CD16 APC–eFluor780, 1:100; CD19 APC–eFluor780, 1:100; fixable viability dye eFluor780, 1:1,667 (all ThermoFisher Scientific)). Cells were fixed for 15 min at 4 °C in 1× stabilization fixative (BD), acquired on a FACSymphony A3 flow cytometer (BD Biosciences) and analysed with FlowJo software version 10.6.2 (FlowJo, BD Biosciences). CD8+ T cell reactivities were considered positive, when a clustered population was observed that was labelled with only two pMHC multimer colours.
Sequence alignment
To assess the conservation of the T cell epitopes assayed with pMHC multimers, multiple sequence alignment of four variants of concern (B.1.1.298, B.1.1.7, B.1.351 and P.1) and the BNT162b2 sequence was performed using the MAFFT online tool52.
Statistical analysis
The sample size for the reported part of the study was not based on statistical hypothesis testing. All participants with data available were included in the safety and immunogenicity analyses. The statistical method of aggregation used for the analysis of antibody concentrations and titres is the geometric mean and the corresponding 95% confidence interval. Using the geometric mean accounts for non-normal distribution of antibody concentrations and titres that span several orders of magnitude. Spearman correlation was used to evaluate the monotonic relationship between non-normally distributed datasets. All statistical analyses were performed using GraphPad Prism software version 9.
Reporting summary
Further information on research design is available in the Nature Research Reporting Summary linked to this paper.
Data availability
The data that support the findings of this study are available from the corresponding author upon reasonable request. Upon completion of this clinical trial, summary-level results will be made public and shared in line with data-sharing guidelines.
References
Polack, F. P. et al. Safety and efficacy of the BNT162b2 mRNA Covid-19 vaccine. N. Engl. J. Med. 383, 2603–2615 (2020).
Walsh, E. E. et al. Safety and immunogenicity of two RNA-based Covid-19 vaccine candidates. N. Engl. J. Med. 383, 2439–2450 (2020).
Dagan, N. et al. BNT162b2 mRNA Covid-19 vaccine in a nationwide mass vaccination setting. N. Engl. J. Med. 384, 1412–1423 (2021).
Amit, S., Regev-Yochay, G., Afek, A., Kreiss, Y. & Leshem, E. Early rate reductions of SARS-CoV-2 infection and COVID-19 in BNT162b2 vaccine recipients. Lancet 397, 875–877 (2021).
Petter, E. et al. Initial real world evidence for lower viral load of individuals who have been vaccinated by BNT162b2. Preprint at https://doi.org/10.1101/2021.02.08.21251329 (2021).
BioNTech SE. Real-world evidence confirms high effectiveness of Pfizer-BioNTech COVID-19 vaccine and profound public health impact of vaccination one year after pandemic declared, https://investors.biontech.de/news-releases/news-release-details/real-world-evidence-confirms-high-effectiveness-pfizer-biontech (2021).
Pardi, N. et al. Nucleoside-modified mRNA vaccines induce potent T follicular helper and germinal center B cell responses. J. Exp. Med. 215, 1571–1588 (2018).
Rauch, S., Jasny, E., Schmidt, K. E. & Petsch, B. New vaccine technologies to combat outbreak situations. Front. Immunol. 9, 1963 (2018).
Pardi, N. et al. Expression kinetics of nucleoside-modified mRNA delivered in lipid nanoparticles to mice by various routes. J. Control. Release 217, 345–351 (2015).
Sahin, U., Karikó, K. & Türeci, Ö. mRNA-based therapeutics—developing a new class of drugs. Nat. Rev. Drug Discov. 13, 759–780 (2014).
Pardi, N., Hogan, M. J., Porter, F. W. & Weissman, D. mRNA vaccines – a new era in vaccinology. Nat. Rev. Drug Discov. 17, 261–279 (2018).
Maruggi, G., Zhang, C., Li, J., Ulmer, J. B. & Yu, D. mRNA as a transformative technology for vaccine development to control infectious diseases. Mol. Ther. 27, 757–772 (2019).
Mulligan, M. J. et al. Phase I/II study of COVID-19 RNA vaccine BNT162b1 in adults. Nature 586, 589–593 (2020).
Sahin, U. et al. COVID-19 vaccine BNT162b1 elicits human antibody and TH1 T cell responses. Nature 586, 594–599 (2020).
Holtkamp, S. et al. Modification of antigen-encoding RNA increases stability, translational efficacy, and T-cell stimulatory capacity of dendritic cells. Blood 108, 4009–4017 (2006).
Orlandini von Niessen, A. G. et al. Improving mRNA-based therapeutic gene delivery by expression-augmenting 3′ UTRs identified by cellular library screening. Mol. Ther. 27, 824–836 (2019).
Karikó, K. et al. Incorporation of pseudouridine into mRNA yields superior nonimmunogenic vector with increased translational capacity and biological stability. Mol. Ther. 16, 1833–1840 (2008).
Vogel, A. B. et al. BNT162b vaccines protect rhesus macaques from SARS-CoV-2. Nature 592, 283–289 (2021).
Kamphuis, E., Junt, T., Waibler, Z., Forster, R. & Kalinke, U. Type I interferons directly regulate lymphocyte recirculation and cause transient blood lymphopenia. Blood 108, 3253–3261 (2006).
Tsai, M. Y. et al. Effect of influenza vaccine on markers of inflammation and lipid profile. J. Lab. Clin. Med. 145, 323–327 (2005).
Taylor, D. N. et al. Development of VAX128, a recombinant hemagglutinin (HA) influenza-flagellin fusion vaccine with improved safety and immune response. Vaccine 30, 5761–5769 (2012).
Doener, F. et al. RNA-based adjuvant CV8102 enhances the immunogenicity of a licensed rabies vaccine in a first-in-human trial. Vaccine 37, 1819–1826 (2019).
Destexhe, E. et al. Evaluation of C-reactive protein as an inflammatory biomarker in rabbits for vaccine nonclinical safety studies. J. Pharmacol. Toxicol. Methods 68, 367–373 (2013).
Kaech, S. M., Wherry, E. J. & Ahmed, R. Effector and memory T-cell differentiation: implications for vaccine development. Nat. Rev. Immunol. 2, 251–262 (2002).
Pérez-Mazliah, D., Ndungu, F. M., Aye, R. & Langhorne, J. B-cell memory in malaria: myths and realities. Immunol. Rev. 293, 57–69 (2020).
Baum, A. et al. Antibody cocktail to SARS-CoV-2 spike protein prevents rapid mutational escape seen with individual antibodies. Science 369, 1014–1018 (2020).
Zhang, L. et al. SARS-CoV-2 spike-protein D614G mutation increases virion spike density and infectivity. Nat. Commun. 11, 6013 (2020).
Lassaunière, R. et al. Working paper on SARS-CoV-2 spike mutations arising in Danish mink, their 2 spread to humans and neutralization data, https://files.ssi.dk/Mink-cluster-5-short-report_AFO2 (2020).
Tegally, H. et al. Detection of a SARS-CoV-2 variant of concern in South Africa. Nature 592, 438–443 (2021).
Sette, A. et al. Selective CD4+ T cell help for antibody responses to a large viral pathogen: deterministic linkage of specificities. Immunity 28, 847–858 (2008).
Ni, L. et al. Detection of SARS-CoV-2-specific humoral and cellular immunity in COVID-19 convalescent individuals. Immunity 52, 971–977 (2020).
Grifoni, A. et al. Targets of T cell responses to SARS-CoV-2 coronavirus in humans with COVID-19 disease and unexposed individuals. Cell 181, 1489–1501 (2020).
Giménez, E. et al. SARS-CoV-2-reactive interferon-γ-producing CD8+ T cells in patients hospitalized with coronavirus disease 2019. J. Med. Virol. 93, 375–382 (2021).
Braun, J. et al. SARS-CoV-2-reactive T cells in healthy donors and patients with COVID-19. Nature 587, 270–274 (2020).
Liu, W. J. et al. T-cell immunity of SARS-CoV: implications for vaccine development against MERS-CoV. Antiviral Res. 137, 82–92 (2017).
Lu, R. et al. Genomic characterisation and epidemiology of 2019 novel coronavirus: implications for virus origins and receptor binding. Lancet 395, 565–574 (2020).
Shomuradova, A. S. et al. SARS-CoV-2 epitopes are recognized by a public and diverse repertoire of human T cell receptors. Immunity 53, 1245–1257.e5 (2020).
Peng, Y. et al. Broad and strong memory CD4+ and CD8+ T cells induced by SARS-CoV-2 in UK convalescent individuals following COVID-19. Nat. Immunol. 21, 1336–1345 (2020).
Xie, X. et al. Neutralization of SARS-CoV-2 spike 69/70 deletion, E484K and N501Y variants by BNT162b2 vaccine-elicited sera. Nat. Med. 27, 620–621 (2021).
O’Toole, Á. et al. Tracking the international spread of SARS-CoV-2 lineages B.1.1.7 and B.1.351/501Y–V2, https://virological.org/t/tracking-the-international-spread-of-sars-cov-2-lineages-b-1–1-7-and-b-1–351–501y-v2/592 (2021).
Muik, A. et al. Neutralization of SARS-CoV-2 lineage B.1.1.7 pseudovirus by BNT162b2 vaccine-elicited human sera. Science 371, 1152–1153 (2021).
Xie, X. et al. An infectious cDNA clone of SARS-CoV-2. Cell Host Microbe 27, 841–848 (2020).
Muruato, A. E. et al. A high-throughput neutralizing antibody assay for COVID-19 diagnosis and vaccine evaluation. Nat. Commun. 11, 4059 (2020).
Berger Rentsch, M. & Zimmer, G. A vesicular stomatitis virus replicon-based bioassay for the rapid and sensitive determination of multi-species type I interferon. PLoS ONE 6, e25858 (2011).
Moodie, Z., Huang, Y., Gu, L., Hural, J. & Self, S. G. Statistical positivity criteria for the analysis of ELISpot assay data in HIV-1 vaccine trials. J. Immunol. Methods 315, 121–132 (2006).
Moodie, Z. et al. Response definition criteria for ELISPOT assays revisited. Cancer Immunol. Immunother. 59, 1489–1501 (2010).
Abelin, J. G. et al. Mass spectrometry profiling of HLA-associated peptidomes in mono-allelic cells enables more accurate epitope prediction. Immunity 46, 315–326 (2017).
Poran, A. et al. Sequence-based prediction of SARS-CoV-2 vaccine targets using a mass spectrometry-based bioinformatics predictor identifies immunogenic T cell epitopes. Genome Med. 12, 70 (2020).
Svitek, N. et al. Use of “one-pot, mix-and-read” peptide-MHC class I tetramers and predictive algorithms to improve detection of cytotoxic T lymphocyte responses in cattle. Vet. Res. 45, 50 (2014).
Leisner, C. et al. One-pot, mix-and-read peptide-MHC tetramers. PLoS ONE 3, e1678 (2008).
Hadrup, S. R. et al. Parallel detection of antigen-specific T-cell responses by multidimensional encoding of MHC multimers. Nat. Methods 6, 520–526 (2009).
Katoh, K., Rozewicki, J. & Yamada, K. D. MAFFT online service: multiple sequence alignment, interactive sequence choice and visualization. Brief. Bioinform. 20, 1160–1166 (2019).
US Department of Health and Human Services, Food and Drug Administration & Centers for Biologics Evaluation and Research. Toxicity grading scale for healthy adult and adolescent volunteers enrolled in preventive vaccine clinical trials, https://www.fda.gov/regulatory-information/search-fda- guidance-documents/toxicity-grading-scale-healthy-adult-and-adolescent-volunteers-enrolled-preventive- vaccine-clinical (2007).
Acknowledgements
We thank M. Dolsten for advice during drafting of the manuscript; P. Adams-Quack, C. Anders, C. Anft, N. Beckmann, K. Bissinger, P. Cienskowski, K. Clarke, C. Ecker, A. Engelmann, M. Fierek, D. Harjanto, A. Heinen, M. Hossainzadeh, S. Jägle, L. Jeck, O. Kahl, D. Kallin, M. Knezovic, T. Kotur, M. Kretschmer, A. Kruithof, J. Mc Gee, B. Mehlhase, C. Müller, S. Murphy, L.-M. Schmid, K. Schmoldt, R. Schulz, L. Srinivasan, B. Sänger, M. Vehreschild, A.-K. Wallisch, T. Weisenburger and S. Wessel for technical support, project management and advice; K. Swanson, H. Cai, W. Chen and R. Sarkar for synthesizing an S-encoding gene used for pseudovirus neutralization testing against the B.1.351-lineage S; S. Rothmeier for data analysis; O. Kistner, S. Liebscher, J. Loschko and K. Swanson for expert advice; J. Absalon for manuscript advice; the CRS Team (Mannheim and Berlin) for study conduct (S. Armani, M. Berse, M. Casjens, B. Ehrlich, F. Seitz and M. Streckebein); W. Kalina, I. Scully and the Pfizer Vaccines Clinical Assays Team and the Pfizer Aviation Team for technical and logistical support of serology analyses; and the GISAID nucleotide database for sharing of SARS-CoV-2 complete genome sequences. BioNTech is the sponsor of the study and responsible for the design, data collection, data analysis, data interpretation and writing of the report. Pfizer advised on the study and the manuscript, generated serological data and contracted for the generation of serological data. The authors had full access to all of the data in the study and had final responsibility for the decision to submit the data for publication. All study data were available to all authors. This study was not supported by any external funding at the time of submission.
Author information
Authors and Affiliations
Contributions
U.S. conceived the work and strategy, supported by Ö.T. Experiments were planned or supervised by N.B., E.D., C.F.-G., C.A.K., U.L., A.M., J.Q., P.-Y.S., A.U. and I.V. A.B., N.B., D.C., M.C., C.F.-G., K.E.P., J.Q., A.U. and P.-Y.S. performed experiments. D.B., S. Brachtendorf, E.D., P.R.D., J.G., K.U.J., A.-K.E., P.K., M.T., L.M.K., M.-C.K., V.L., A.M., J.Q., J.S., N.B., A.U., I.V. and M.V. analysed data. A.P. prioritized epitopes for pMHC multimer assay. J.Z.D. supervised the manufacturing and delivery of peptides for pMHC multimer assay. D.M. planned and supervised dashboards for the analysis of clinical trial data. R.H. was responsible for data normalization and adaption. C.B., L.H. and C.R. were responsible for the management of the biomarker and research and development programmes. G.B., K.K., A.J.M., J.R. and G.T.S. optimized mRNA characteristics. A.K.-B., S. Baumann, A.S., D.L., M.B., S. Bolte and T.P. coordinated operational conduct of the clinical trial. J.L.P. advised on the trial. U.S. and Ö.T., supported by M.B., N.B., E.D., P.R.D., K.U.J., L.M.K., A.M., A.U., I.V. and M.V., interpreted data and wrote the manuscript. All authors supported the review of the manuscript.
Corresponding author
Ethics declarations
Competing interests
Ö.T. and U.S. are management board members and employees at BioNTech SE (Mainz, Germany); A.K.-B., A.M., A.J.M., A.-K.E., A.U., C.R., D.B., D.L., D.M., E.D., G.B., G.T.S., I.V., J.G., J.Q., J.R., J.S., K.K., L.H., L.M.K., M.-C.K., M.V., N.B., P.K., R.H., S. Bolte, S. Brachtendorf, T.P., U.L. and V.L. are employees at BioNTech SE; A.P. and J.Z.D. are employees at BioNTech US; M.B. is an employee at Bexon Clinical Consulting LLC; A.B., C.A.K. and K.E.P. are employees of Regeneron Pharmaceuticals Inc; A.M., K.K., Ö.T. and U.S. are inventors on patents and patent applications related to RNA technology and COVID-19 vaccines; A.K.-B., A.M., A.J.M., A.P., C.R., D.B., D.L., E.D., G.B., I.V., J.Z.D., J.G., K.K., L.H., L.M.K., M.V., N.B., Ö.T., R.H., S. Bolte, U.L. and U.S. have securities from BioNTech SE; D.C., J.L.P., K.U.J., M.C. and P.R.D. are employees at Pfizer and may have securities from Pfizer; C.A.K. is an officer at Regeneron Pharmaceuticals, Inc; A.B., C.A.K. and K.E.P. have securities from Regeneron Pharmaceuticals, Inc; C.F.-G. and P.-Y.S. received compensation from Pfizer to perform the neutralization assay; the authors declare that there are no other relationships or activities that could appear to have influenced the submitted work.
Additional information
Peer review information Nature thanks Antonio Bertoletti and the other, anonymous, reviewer(s) for their contribution to the peer review of this work.
Publisher’s note Springer Nature remains neutral with regard to jurisdictional claims in published maps and institutional affiliations.
Extended data figures and tables
Extended Data Fig. 1 Vaccination schedule and sample collection.
Study participants received a priming dose with BNT162b2 on day 1 and a booster dose on day 22 ± 2. Sera were obtained on day 1 (pre-prime), day 8 ± 1 (post-prime), day 22 ± 2 (pre-boost), day 29 ± 3, day 43 ± 4, day 50 ± 4 and day 85 ± 7 (post-boost). PBMCs were obtained on day 1 (pre-prime), day 29 ± 3, day 43 ± 4 and day 85 ± 7 (post-boost).
Extended Data Fig. 2 Solicited adverse events.
a, b, Number of participants with local (a) or systemic (b) solicited adverse events. Participants were immunized with BNT162b2 on day 1 and day 22 (prime: n = 12 per dose cohort except for boost of the 1- and 100μg dose cohorts, for which n = 11); participants discontinued for non-vaccine-related reasons). Grey shading indicates number of participants at each time point. As per protocol, adverse events were recorded up to one week after each immunization (days 1–7 and 22–28) to determine reactogenicity; for some participants, data from 1–3 additional days of follow-up were available and are presented. Grading of adverse events was performed according to US Food and Drug Administration recommendations53.
Extended Data Fig. 3 Pharmacodynamic markers.
a, b, Participants were immunized with BNT162b2 on day 1 and day 22 (n = 12 per dose cohort). One participant in the 1-μg dose cohort (outlier on day 8 in a and highest dataset in b) presented with a non-treatment-related gastroenteritis on days 6–8. a, Kinetics of C-reactive protein (CRP) level. b, Kinetics of lymphocyte counts. c, Kinetics of neutrophil counts. Dotted lines indicate upper and lower limit of reference range. In a, for values below the LLOQ (of 0.3), LLOQ/2 values were plotted.
Extended Data Fig. 4 BNT162b2-induced antibody responses.
Vaccination schedule and serum sampling are described in Extended Data Fig. 1. Participants were immunized with BNT162b2 on day 1 and day 22 (n = 12 per dose cohort; from day 22 onwards n = 11 for the 1-μg and 10-μg dose cohorts). Arrowheads indicate days of vaccination. Pre-dose responses across all dose levels were combined. Samples from individuals who had been infected with SARS-CoV-2 or had recovered from COVID-19 (HCS) (n = 38) were obtained at least 14 days after PCR-confirmed diagnosis and at a time at which the donors were no longer symptomatic. a–d, Each serum was tested in duplicate and IgG GMCs (a, c) and geometric mean 50% (pseudo)neutralizing titres (GMTs) (c, d) were plotted. For values below the LLOQ (1.27 (S1 IgG), 1.15 (RBD IgG) (a), 20 (VNT50) (c) and 300 (pVNT50) (d)), LLOQ/2 values were plotted. a, Recombinant S1- and RBD-binding IgG group GMCs (values above bars) with 95% confidence intervals. b, Fraction of participants with ≥4-fold-increased 50% serum neutralizing response above baseline (from Fig. 1a) at each time point. Fractions with exact 95% Clopper–Pearson confidence intervals. c, Non-parametric Spearman correlation of recombinant S1-binding IgG GMCs (from a) with VNT50 from day 29 sera (from Fig. 1a) with data points for participants with GMCs and GMTs below the LLOQ (open circles) excluded. d, pVNT50 across a pseudovirus panel displaying 19 SARS-CoV-2 S variants on a Wuhan-Hu-1 strain background, including 18 with RBD single-nucleotide-exchange mutations and the dominant D614G variant (1-, 10- and 30-μg dose cohorts, n = 1 or 2 representative sera each; day 29).
Extended Data Fig. 5 BNT162b2-induced S-specific CD4+ and CD8+ T cells.
CD4+ or CD8+ T cell effector-enriched fractions of PBMCs obtained from trial participants on day 1 (pre) and day 29 (1-, 10- and 20-μg dose cohorts, n = 9 each; 30-μg dose cohort, n = 10) were stimulated overnight with overlapping peptide pools covering the wild-type SARS-CoV-2 S (S pool 1 and S pool 2) or RBD for assessment by IFNγ ELISpot. Each data point represents the normalized mean spot count from duplicate wells for one study participant, after subtraction of the medium-only control. Spot count data from two participants from the 20-μg dose cohort could not be normalized and are not plotted. a, b, RBD-specific (a) and S-specific (b) CD4+ and CD8+ T cell responses for each dose cohort. T cell responses against S pool 1 and S pool 2 were combined for each participant. Numbers above each dataset represent the number of participants with a positive T cell response over the total number of participants tested. c, ELISpot example of CD4+ and CD8+ T cell responses for a 30-μg dose cohort participant on day 1 (pre) and day 29 (post). d, Mapping of vaccine-induced responses of participants with evaluable baseline data (n = 34 for CD4+ and n = 37 for CD8+ T cell responses) to different portions of S on day 29. De novo-induced or amplified responses are classified as BNT162b2-induced responses; no responses or pre-existing responses that were not amplified by the vaccinations are classified as no vaccine response (none). e, Response to S pool 1 on day 29 in individuals with or without a pre-existing response to S pool 2. Data from the 1-μg dose cohort are excluded, as no baseline response to S pool 2 was present in this cohort. Horizontal bars represent the median of each group. f, ELISpot example of CD4+ and CD8+ T cell responses on day 85.
Extended Data Fig. 6 Correlation of antibody and T cell responses induced by BNT162b2.
a–c, Data are plotted for all prime–boost-vaccinated participants (1-, 10-, 20- and 30-μg dose cohorts) from day 29, with data points for participants with no detectable T cell response (open circles; b, c) excluded from correlation analysis. S1-specific IgG responses from Fig. 1a, S-specific T cell responses from Extended Data Fig. 5a (n = 37). Non-parametric Spearman correlations are shown. a, Correlation of S1-specific IgG responses with S-specific CD4+ T cell responses. b, Correlation of S-specific CD4+ with CD8+ T cell responses. c, Correlation of S1-specific IgG responses with S-specific CD8+ T cell responses.
Extended Data Fig. 7 Cytokine profiles and reactivities of BNT162b2-induced T cells.
a–e, PBMCs obtained on day 1 (pre), day 29 (dose cohorts 1 μg, n = 8; 10, 20 and 30 μg, n = 11 each) (a–d), day 43 and day 85 (30-μg dose cohort, n = 8) (e) and donors who had recovered from COVID-19 (HCS) (n = 18) (b, d) were stimulated overnight with three overlapping peptide pools representing different portions of the wild-type sequence of SARS-CoV-2 S (N-terminal pools S pool 1 and RBD, and the C-terminal S pool 2), and analysed by flow cytometry (gating strategy in Supplementary Fig. 1). Participant PBMCs were tested without replicates (b–e). a, Examples of pseudocolour flow cytometry plots of cytokine-producing CD4+ and CD8+ T cells from a participant in the 30-μg dose cohort in response to S pool 1 and S pool 2 on day 1 (pre) and day 29 (post). b, S-specific CD4+ T cells (S pool 1, S pool 2 and RBD) producing the indicated cytokine as a fraction of total circulating T cells of the same subset on day 29. Values above data points indicate mean fractions per dose cohort. c, Fraction of vaccine-induced, S-specific IFNγ+ CD4+ T cells plotted against IL-4+ CD4+ T cells on day 29. ICS stimulation was performed using a peptide mixture of S pool 1 and S pool 2. Each data point represents one study participant (dose cohorts 1 μg, n = 8; 10 and 30 μg, n = 11; 20 μg, n = 10). One participant from the 20-μg dose cohort with a strong pre-existing CD4+ T cell response to S pool 2 was excluded. d, S-specific CD8+ T cells (S pool 1, S pool 2 and RBD) producing the indicated cytokine as a fraction of total circulating T cells of the same subset on day 29. Values above data points indicate mean fractions per dose cohort. e, Response kinetics of S-specific CD4+ and CD8+ T cells stimulated with S pool 2 and producing the indicated cytokine as a fraction of total circulating T cells of the same subset. Vertical dotted lines indicate days of vaccination. f, Epitopes recognized by BNT162b2-induced T cells (from Fig. 4a) and aligned with the corresponding sequences in four SARS-CoV-2 lineages. Non-consensus amino acids are highlighted in red. g, Epitope-specific CD8+ T cell frequencies determined by pMHC class I multimer staining (per cent multimer+ of CD8+), ICS and ELISpot (per cent IFNγ+ of CD8+) from the three participants in Fig. 4. Signals for S pool 1 and S pool 2 were merged for each assay.
Supplementary information
Supplementary Figures
This file contains Supplementary Figures 1-2 which contain examples of the flow cytometry gating strategy.
Rights and permissions
About this article

Cite this article
Sahin, U., Muik, A., Vogler, I. et al. BNT162b2 vaccine induces neutralizing antibodies and poly-specific T cells in humans. Nature 595, 572–577 (2021). https://doi.org/10.1038/s41586-021-03653-6
Received:
Accepted:
Published:
Issue Date:
DOI: https://doi.org/10.1038/s41586-021-03653-6
This article is cited by
-
Inhalation of ACE2-expressing lung exosomes provides prophylactic protection against SARS-CoV-2
Nature Communications (2024)
-
A quest for universal anti-SARS-CoV-2 T cell assay: systematic review, meta-analysis, and experimental validation
npj Vaccines (2024)
-
Humoral and cellular immune responses to COVID-19 mRNA vaccines in immunosuppressed liver transplant recipients
Communications Medicine (2024)
-
Comparable safety and non-inferior immunogenicity of the SARS-CoV-2 mRNA vaccine candidate PTX-COVID19-B and BNT162b2 in a phase 2 randomized, observer-blinded study
Scientific Reports (2024)
-
Increased prevalence of erythema multiforme in patients with COVID-19 infection or vaccination
Scientific Reports (2024)
Comments
By submitting a comment you agree to abide by our Terms and Community Guidelines. If you find something abusive or that does not comply with our terms or guidelines please flag it as inappropriate.
