
Abstract
Approximately one-third of the world’s population suffers from allergies1. Exposure to allergens crosslinks immunoglobulin E (IgE) antibodies that are bound to mast cells and basophils, triggering the release of inflammatory mediators, including histamine2. Although IgE is absolutely required for allergies, it is not understood why total and allergen-specific IgE concentrations do not reproducibly correlate with allergic disease3,4,5. It is well-established that glycosylation of IgG dictates its effector function and has disease-specific patterns. However, whether IgE glycans differ in disease states or affect biological activity is completely unknown6. Here we perform an unbiased examination of glycosylation patterns of total IgE from individuals with a peanut allergy and from non-atopic individuals without allergies. Our analysis reveals an increase in sialic acid content on total IgE from individuals with a peanut allergy compared with non-atopic individuals. Removal of sialic acid from IgE attenuates effector-cell degranulation and anaphylaxis in several functional models of allergic disease. Therapeutic interventions—including removing sialic acid from cell-bound IgE with a neuraminidase enzyme targeted towards the IgE receptor FcεRI, and administering asialylated IgE—markedly reduce anaphylaxis. Together, these results establish IgE glycosylation, and specifically sialylation, as an important regulator of allergic disease.
Main
IgE antibodies bind to the surface of mast cells or basophils that express the high-affinity IgE receptor FcεRI (ref. 2). Subsequent exposure to allergens crosslinks cell-bound IgE, leading to cellular activation and the release of allergic mediators, including histamine, prostaglandins and leukotrienes2. This cascade culminates in the canonical symptoms of allergic diseases, the most severe of which is anaphylaxis. Although IgE that recognizes otherwise innocuous allergens is well-established as the causative agent of most allergic diseases1,2, clinical allergy diagnostics remain relatively inaccurate3,4,5, and curative therapies, including oral immunotherapy, are cumbersome and only partially effective7,8. Further, allergen-specific IgE is detected in many people who do not experience allergic symptoms3,5. Thus, while IgE is absolutely necessary for triggering the allergic cascade, it is not clear how IgE causes allergic disease in some circumstances and not others.
The composition of the glycans attached (via a single asparagine (N) residue) to immunoglobulin G markedly influences its biological activity, and affects the outcome of many diseases, including Dengue haemorrhagic fever9, Mycobacterium tuberculosis latency10, influenza vaccination11, rheumatoid arthritis6,12, and granulomatosis with polyangiitis13,14. There are seven N-linked glycosylation sites distributed across the heavy chains of human IgE (hIgE)6,15. However, whether particular IgE glycans are associated with allergic diseases, or affect IgE function, is unknown. IgE is the least abundant antibody class in circulation, and, as such, analysis of hIgE glycosylation has been restricted to samples from individuals with myelomas, hyper-IgE syndromes, hyperimmune syndromes pooled from multiple donors, or recombinant IgE15,16,17,18. These studies revealed that there is a single N-linked oligomannose glycan at N394 on IgE, that N383 is unoccupied, and that the remaining five sites are occupied by complex antennary glycans (Fig. 1a). Previously, the importance of glycans to IgE biology has been examined through treatment with glycosidases (enzymes that hydrolyse glycosidic bonds)17,19 and through mutation of glycosylation sites17,20. This revealed that the N394-linked oligomannose was required for appropriate IgE folding and FcεRI binding17,20 to initiate effector functions.
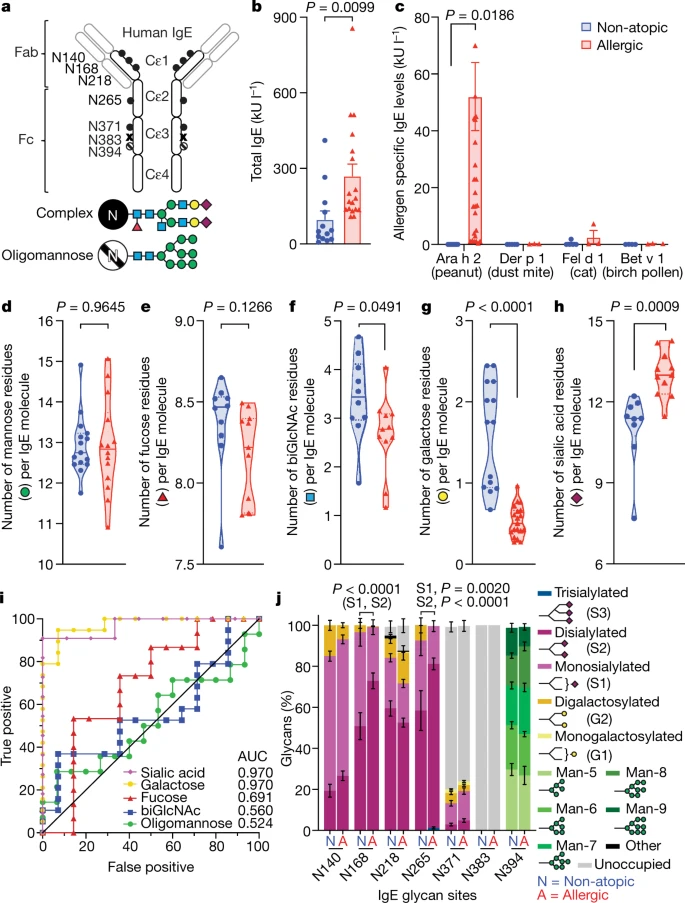
a, Human IgE with the Fab and Fc domains, as well as N-linked glycosylation sites, shown. Filled circles, complex biantennary glycans; hatched circles, oligomannose; X, unoccupied; blue squares, GlcNAc; green circles, mannose; red triangle, fucose; yellow circles, galactose; maroon diamonds, sialic acid. b, c, Total IgE titres (b) and allergen-specific IgE levels (c) in non-atopic individuals (blue, n = 17) and individuals with allergies (red, n = 13). d–h, Glycan moieties per IgE molecule, quantified by glycopeptide mass spectrometry (gMS), in non-atopic individuals (blue) and individuals with a peanut allergy (red): mannose (d; non-atopic, n = 15; allergic, n = 14); fucose (e; non-atopic, n = 10; allergic, n = 11); biGlcNAc (f; non-atopic, n = 10; allergic, n = 11); galactose (g; non-atopic, n = 14; allergic, n = 19); and sialic acid (h; non-atopic, n = 9; allergic, n = 11). i, ROC for total IgE glycan moieties isolated from individuals with allergies versus non-atopic individuals: sialic acid (non-atopic, n = 9; allergic, n = 11); galactose (non-atopic, n = 14; allergic, n = 19); fucose (non-atopic, n = 14; allergic, n = 15); biGlcNAc (non-atopic, n = 14; allergic, n = 19); and oligomannose (non-atopic, n = 15; allergic, n = 14). AUC, area under curve. j, gMS analysis of site-specific N-glycan structures on total IgE from non-atopic individuals (N140, n = 11; N168, n = 13; N218, n = 11; N265, N371, N394, n = 12) and individuals with allergies (N140, n = 11; N168, n = 15; N218, n = 17; N265, n = 18; N371, n = 14; N394, n = 12). Representative glycan structures per group are detailed in Extended Data Fig. 1h. Data shown are means ± s.e.m. (b, c, j), medians (solid lines) and interquartile ranges (dotted lines) (d–h); two-tailed unpaired t-test (b, d–h), two-way analysis of variance (ANOVA) with Sidak’s (c) or Tukey’s multiple comparison test (j).
Here we investigated whether allergic-disease-specific glycosylation patterns exist for IgE, and, if so, whether those patterns influence the biological activity of IgE. We characterized individuals as non-atopic if they reported no history of atopy, with low total IgE titres and little IgE reactivity to peanut allergen (Ara h 2), birch tree pollen allergen (Bet v 1), house dust mite allergen (Der p 1) or cat allergen (Fel d 1) (Fig. 1b, c, Extended Data Fig. 1a and Extended Data Table 1). Individuals with a peanut allergy reported multiple atopies, had approximately twofold higher total IgE titres and reactivity to peanut allergen (Ara h 2) but not to other tested allergens, and were confirmed by clinician-supervised oral challenge (Fig. 1b, c, Extended Data Fig. 1a and Extended Data Table 1)8. We sensitized human LAD2 mast cells with similar amounts of total IgE enriched from the sera of these cohorts and activated the cells by anti-IgE crosslinking. We observed less degranulation—as measured by β-hexosaminidase release—in mast cells sensitized with IgE isolated from sera of non-atopic individuals compared with patients with a peanut allergy (Extended Data Fig. 1c), despite similar surface IgE loading (Extended Data Fig. 1d, e). This suggested intrinsic functional differences between non-atopic and allergic IgE, independent of allergen specificity.
Next, we analysed the N-glycans on total IgE enriched from these two cohorts by mass spectrometry16,18,21 (Extended Data Figs. 2, 3). The mannose content on oligomannose moieties was similar between total non-atopic and allergic IgE (Fig. 1d). Fucose, N-acetyl glucosamine (GlcNAc), galactose and sialic acid can be attached to complex glycans (Fig. 1a). Although the total fucose content was similar between non-atopic and allergic IgE (Fig. 1e), substantially increased levels of bisecting GlcNAc (biGlcNAc) and terminal galactose were found on non-atopic IgE (Fig. 1f, g), whereas increased terminal sialylation was detected on allergic IgE (Fig. 1h).
To determine whether the glycan differences on total IgE were predictive of allergic disease, we assessed the variable glycan content on non-atopic and allergic IgE using receiver operating characteristics (ROC) curves (Fig. 1i). We found that the galactose and sialic acid contents of IgE were uniquely strong predictors of allergic disease. Of note, differences in IgE sialylation were not sex- or age-dependent (Extended Data Fig. 1f, g). Glycosylation-site analysis showed that N140, N168, N265 and N394 of IgE were fully occupied by N-linked glycans, N218 and N371 were partially occupied (75% and 30% respectively), and N383 was completely unoccupied (Fig. 1j and Extended Data Fig. 4a), consistent with previous results15,16,18. N394-linked oligomannose structures (Fig. 1j and Extended Data Fig. 4b) and the N140-, N168-, N265- and N371-linked fucose and biGlcNAc contents (Fig. 1j and Extended Data Fig. 4c, d) were similar between samples. However, N140- and N265-linked complex glycans terminating in galactose were enriched on non-atopic IgE, while terminal sialic acids, particularly disialylated glycans, were greatly enriched at N168 and N265 on allergic IgE (Fig. 1j and Extended Data Figs. 1h, 4e, f). Together, these results reveal that specific glycosylation patterns distinguish allergic from non-atopic total IgE.
Sialylation has been implicated in regulating several antibody classes, including the anti-inflammatory activity of IgG1 (ref.22), IgA-induced nephropathy and influenza neutralization23,24, and IgM-induced inhibitory signalling on B and T cells25,26. We found that sialic acid is attached in α2,6 linkages on hIgE and mouse IgE (mIgE), as determined by neuraminidase (NEU) digestion assays and lectin blotting (Fig. 2a and Extended Data Fig. 5a–c), consistent with previous studies6,15,17. Thus, we treated mIgE with NEU and digestion buffer or with digestion buffer alone to generate mIgEs of identical allergen specificity that differed only in sialic acid content (Fig. 2a). In a model of passive cutaneous anaphylaxis (PCA), we sensitized mice with phosphate-buffered saline (PBS), ovalbumin (OVA)-specific sialylated mIgE (SiamIgE), or OVA-specific asialylated IgE (AsmIgE) intradermally in the ears. The next day, we challenged the mice with allergen (OVA) in Evan’s blue dye intravenously. Forty minutes after challenge, we quantified the amount of blue dye in the ear as a surrogate of histamine-mediated vascular leakage. PBS injection elicited little blue dye accumulation in the ear injection site, while substantial blue colouration was observed in SiamIgE-sensitized ears (Fig. 2b and Extended Data Fig. 5d). Notably, AsmIgE-sensitized ears exhibited markedly reduced blue colouration, indicative of attenuated anaphylaxis (Fig. 2b and Extended Data Fig. 5d). To confirm that removal of sialic acid was responsible for reduced PCA reactivity, we reattached sialic acid to AsmIgE in vitro (Re-siamIgE). Re-siamIgE triggered a robust PCA reaction (Fig. 2b), demonstrating that IgE sialylation affects the magnitude of anaphylaxis. Flow cytometry analysis of mast cells recovered from the mouse ears revealed no differences in IgE loading following sensitization with SiamIgE or AsmIgE (Fig. 2c and Extended Data Fig. 5e), and that SiamIgE and AsmIgE bound allergen similarly, as determined by enzyme-linked immunosorbent assay (ELISA) (Extended Data Fig. 5f). Thus, the attenuation of cutaneous anaphylaxis by AsmIgE was independent of IgE loading on mast cells in vivo or allergen recognition.

a, Blot for Sambucus nigra (SNA) lectin (top) and Coomassie-stained gel (bottom) of OVA-specific SiamIgE and AsmIgE. b, Left, quantification of ear blue colouration, and right, representative ear images following OVA-induced PCA by PBS, OVA-specific SiamIgE, AsmIgE or Re-SiamIgE (n = 2, 8, 12 and 4 mouse ears respectively). OD620, optical density at 620 nm. c, Left, mean fluorescence intensity (MFI), and right, representative histograms of anti-mIgE determined by fluorescence-activated cell sorting (FACS) on dermal mouse ear mast cells following sensitization with PBS, OVA-specific SiamIgE or AsmIgE (n = 5, 6 and 6 mouse ears, respectively, from two independent experiments). FITC, fluorescein isothiocyanate. d, e, Temperature change (d) and serum histamine levels (e) following DNP-induced PSA in mice sensitized with PBS, DNP-specific SiamIgE or AsmIgE (n = 3, 5 and 5 mice, respectively). f, Serum levels of DNP-specific SiamIgE (n = 4 mice) or AsmIgE (n = 5 mice) after intraperitoneal administration. g, Temperature change following passive food anaphylaxis elicited by oral TNP–OVA administration in mice sensitized with PBS, TNP-specific SiamIgE or AsmIgE (n = 2, 4 and 4, respectively). h, SNA lectin blot and Coomassie-stained gel of OVA-specific SiahIgE and AshIgE. i–k, OVA-induced degranulation in LAD2 mast cells (i), peripheral blood mononuclear cell derived human mast cells (j) or basophils (k) sensitized with PBS (i, n = 3; k, n = 1), OVA-specific SiahIgE or AshIgE (i, n = 3; j, n = 3; k, n = 4). n is the number of technical replicates and is representative of three biologically independent experiments. PE, phycoerythrin. l, m, Binding kinetics of OVA-specific SiahIgE or AshIgE to hFcεRIα (l) or OVA (m). KD, equilibrium dissociation constant. Data shown are means ± s.e.m. (b–g, i–k) and are representative of two (f) or three (a, b, d, e, g–m) independent experiments. One-way ANOVA with Tukey’s (b), or two-way ANOVA with Tukey’s (d, e, i, k) or Sidak’s (g, j) multiple comparison test. For gel source data, see Supplementary Fig. 1.
Next, we systemically sensitized mice with SiamIgE, AsmIgE or PBS and challenged them with allergen the following day in a model of passive systemic anaphylaxis (PSA). SiamIgE-sensitized mice elicited a robust anaphylactic response underscored by a marked temperature loss 20 min after allergen challenge (Fig. 2d and Extended Data Fig. 5g, h). However, minimal temperature drop was observed in AsmIgE- or PBS-sensitized mice (Fig. 2d and Extended Data Fig. 5g, h). Consistent with this, we detected a systemic increase in histamine in SiamIgE-sensitized animals following challenge, but not in AsmIgE- or PBS-treated mice (Fig. 2e). Asialylated glycoproteins have a decreased serum half-life27, and we therefore compared the levels of SiamIgE and AsmIgE in circulation following systemic administration. However, sialic acid removal had little effect on IgE half-life (Fig. 2f and Extended Data Fig. 5i). To extend these findings to a model of passive food allergy, we sensitized mice systemically with PBS, SiamIgE or AsmIgE, and challenged them with allergen orally the following day. Sensitization to SiamIgE, but not to AsmIgE or PBS, resulted in a marked temperature loss following oral allergen challenge (Fig. 2g).
We next asked whether sialylation similarly regulated hIgE, and sensitized human LAD2 mast cells with PBS or with sialylated or asialylated hIgE (SiahIgE or AshIgE, respectively; Fig. 2h). The cells were stimulated with allergen, and degranulation was quantified in β-hexosaminidase-release assays. AshIgE-sensitized cells showed markedly reduced degranulation following allergen challenge, compared with SiahIgE-sensitized cells (Fig. 2i). We examined LAD2 mast cells after sensitization by flow cytometry, finding comparable hIgE loading following SiahIgE or AshIgE sensitization (Extended Data Fig. 6a). Similar findings were observed in human mast cells derived from primary peripheral blood CD34+ cell culture, where AshIgE-sensitized cells had markedly reduced allergen-specific degranulation compared with SiahIgE-sensitized cells (Fig. 2j and Extended Data Fig. 6b). In parallel, we sensitized primary basophils with PBS, SiahIgE and AshIgE and stimulated them with allergen (Extended Data Fig. 6c). AshIgE-sensitized basophils elicited reduced degranulation after allergen stimulation—as measured by surface staining of the granule marker CD63—compared with basophils sensitized with SiahIgE (Fig. 2k). Although mast-cell loading was similar between mouse and human SiaIgE and AsIgE (Fig. 2c and Extended Data Fig. 6a), we investigated whether sialylation altered the kinetics of hIgE binding to its receptor, FcεRI. Biolayer interferometry (BLI) assays revealed no difference in SiahIgE and AshIgE interactions with FcεRI (Fig. 2l). Sialylation also did not alter IgE binding to the allergen (Fig. 2m). Thus, removing sialic acid from IgE attenuates its effector functions in vivo and in vitro, while binding to allergen, mast cells and FcεRI remains intact.
Because sialylation does not alter IgE interactions with allergen and receptor, we examined whether signalling downstream of FcεRI is affected. LAD2 mast cells sensitized with SiahIgE or AshIgE were stimulated with allergen, and cellular lysates were collected at defined intervals. Western blotting of mast-cell lysates for the tyrosine kinase Syk revealed reduced phosphorylation in cells sensitized with AshIgE at 5 min and 30 min after stimulation (Fig. 3a). Similarly, calcium flux was reduced in AshIgE-sensitized LAD2 mast cells following allergen stimulation compared with SiahIgE-sensitized cells (Fig. 3b). We then asked whether a surrogate asialylated glycoprotein could attenuate anaphylaxis similarly to asialylated IgE. LAD2 mast cells were sensitized with SiahIgE, and supplemented with either sialylated fetuin (SiaFetuin) or asialylated fetuin (AsFetuin) (Extended Data Fig. 5b). Quantifying allergen-specific degranulation revealed that addition of sialylated fetuin had no effect, while asialylated fetuin inhibited allergen-induced mast-cell degranulation (Fig. 3c). Together, these results suggest that removal of sialic acid exposes an inhibitory glycan that dampens FcεRI signalling.

a, Immunoblots of phosphorylated (p)Syk, total Syk and β-actin in LAD2 mast cells sensitized with PBS, OVA-specific SiahIgE or AshIgE after OVA stimulation. b, OVA-induced Ca2+ flux traces (left) and maximum values (right) in LAD2 cells sensitized with PBS (black), OVA-specific SiahIgE (maroon) or AshIgE (gold). n = 5 biologically independent samples from three independent experiments. F, fluorescence ; F0, fluorescence at time 0; Fmax, maximum fluorescence. c, OVA-elicited degranulation in LAD2 cells sensitized with OVA-specific SiahIgE and treated with SiaFetuin (maroon) or AsFetuin (gold). n = 3 technical replicates. d, Quantification of ear blue colouration (bottom left) and representative images (bottom right) following OVA-induced PCA in mice sensitized with PBS, OVA-specific SiamIgE, OVA-specific SiamIgE plus OVA-specific AsmIgE, or OVA-specific SiamIgE plus SiamIgE isotype control (n = 2, 6, 3 and 3 mouse ears, respectively). Top, the experimental protocol; i.d., intradermal; i.v, intravenous. e, Temperature change following DNP-induced PSA in mice receiving DNP-specific SiamIgE on day 0 and PBS, OVA-specific SiamIgE or AsmIgE on day 1 (n = 6, 7 and 7, respectively, from two independent experiments). f, Illustration of NEUFcε. g, OVA-induced degranulation in LAD2 cells sensitized with OVA-specific SiahIgE or PBS and treated with NEUFcε, heat-inactivated NEUFcε (H-I NEUFcε) or IgE isotype control. h, Peanut-induced degranulation in LAD2 cells sensitized with peanut-allergic SiahIgE or PBS and treated with NEUFcε or IgE isotype control. g, h, n = 3 technical replicates. i, Temperature changes following OVA-induced PSA in mice receiving OVA-specific SiamIgE on day 0 and PBS, NEUFcε or IgE isotype control on day 1. n = 4 mice per group. Data are means ± s.e.m. (b–e, g–i) and are representative of two (a, d) and three (c, g–i) independent experiments. Two-tailed paired t-test (b), one-way ANOVA with Tukey’s (d), or two-way ANOVA with Sidak’s (c) or Tukey’s multiple comparison test (e, g–i). For gel source data, see Supplementary Fig. 1.
These observations indicated that AsIgE can actively inhibit anaphylaxis in vivo. We therefore sensitized mice intradermally in the ears with PBS, OVA-specific SiamIgE, a combination of OVA-specific SiamIgE and tenfold more OVA-specific AsmIgE, or a combination of OVA-specific SiamIgE and tenfold more trinitrophenyl (TNP)-specific SiamIgE isotype control. The next day we challenged mice with OVA, and quantified blue colouration of the ears. Extensive vascular leakage occurred in ears sensitized with OVA-specific SiamIgE alone (Fig. 3d). However, co-sensitization of OVA-specific SiamIgE with either OVA-specific AsmIgE or TNP-specific SiamIgE both resulted in greatly reduced vascular leakage (Fig. 3d). Next, we systematically sensitized mice with 2,4-dinitrophenyl (DNP)-specific SiamIgE on day 0, and then PBS, OVA-specific SiamIgE or OVA-specific AsmIgE on day 1, finally challenging them with DNP conjugated to human serum albumin (HSA) on day 2. Mice that were sensitized with DNP-specific SiamIgE on day 0 and PBS or OVA-specific SiamIgE on day 1 exhibited a robust temperature loss after allergen challenge. However, DNP-specific SiamIgE-sensitized mice that received OVA-specific AsmIgE on day 1 had a greatly attenuated temperature loss upon allergen challenge (Fig. 3e). Systemic challenge of these treatment groups with OVA revealed that only sensitization with OVA-specific SiamIgE resulted in a temperature drop, while all other groups were unaffected (Extended Data Fig. 7a). These results suggest that AsmIgE attenuates anaphylaxis by occupying FcεRI, but can actively dampen systemic anaphylaxis.
As removal of sialic acid attenuates IgE effector functions, we explored whether targeting sialic acid on IgE-bearing cells represents a viable strategy for attenuating allergic inflammation. Thus, we genetically fused a neuraminidase to the N terminus of IgE Fc Cε2–4 domains (NEUFcε; Fig. 3f and Extended Data Fig. 7b) to direct sialic acid removal specifically to IgE-bearing cells. This fusion protein retained binding to FcεRI (Extended Data Fig. 7c), could be loaded on mast cells (Extended Data Fig. 7d), and had neuraminidase activity (Extended Data Fig. 7e–h). We sensitized LAD2 mast cells with OVA-specific SiahIgE, incubated them briefly with increasing concentrations of NEUFcε, heat-inactivated NEUFcε, or an IgE isotype to control for FcεRI occupancy, and stimulated them with OVA. Treatment with NEUFcε, but not with heat-inactivated NEUFcε or the isotype control, attenuated OVA-induced degranulation in a dose-dependent manner (Fig. 3g). To extend our findings to allergic hIgE from patients with a peanut allergy, we sensitized LAD2 mast cells with peanut-allergic SiahIgE and treated them with NEUFcε or with an IgE isotype control. Consistently, allergen-induced degranulation was markedly attenuated by NEUFcε treatment of peanut-allergic SiahIgE-sensitized cells compared with IgE isotype control treatment (Fig. 3h). Unsensitized LAD2 mast cells treated with NEUFcε did not degranulate (‘No IgE plus NEUFcε’; Fig. 3g, h), indicating that NEUFcε treatment does not stimulate mast cells. We next explored the therapeutic potential of modulating sialic acid content in vivo. Mice were sensitized systemically with SiamIgE on day 0, and treated with PBS, NEUFcε or IgE isotype control on day 1. The following day, the mice were challenged systemically with allergen, and core body temperature was measured. SiamIgE-sensitized mice that received PBS or isotype control exhibited robust drops in temperature (Fig. 3i). NEUFcε treatment markedly attenuated the allergen-induced temperature drop (Fig. 3i), providing evidence of the therapeutic potential of targeting sialic acid on IgE-bearing cells.
IgE-mediated allergic diseases are multifactorial, with a broad range of clinical presentations, and paradoxically many individuals produce allergen-specific IgE without manifestation of disease. Further, there is a high rate of false-positive test results for food allergens3,5,8,28. Many non-mutually exclusive mechanisms for this discrepancy exist, including differences in IgE affinity or epitope diversity for allergens, mast-cell numbers, FcεRI expression levels, Syk signalling, allergen-specific IgG antibodies, anti-IgE antibodies, and numbers of regulatory T cells29. Here we have shown that the sialic acid content on total IgE distinguishes peanut-allergic and non-atopic IgE. Further, we have found that allergic reactions are attenuated by removing sialic acid from IgE or administering asialylated glycoproteins. Although the sialic acid content of IgE and its role in other contexts is unknown, we propose that sialylation is an additional factor that regulates its biology. Thus, exploitation of the IgE–sialylation axis presents a compelling diagnostic and therapeutic strategy.
Methods
IgE antibodies
All human samples were collected under Institutional Review Board (IRB)-approved protocols by Massachusetts General Hospital (MGH) and Research Blood Components, including informed consent obtained in accordance with relevant ethical regulations. Serum samples were obtained from individuals with a peanut allergy before treatment. Peanut allergy was confirmed by clinical history, allergen-specific IgE screening and double-blind placebo-controlled oral challenge (trial number NCT01750879/PNOIT2)8 (Extended Data Table 1). Non-atopic adults were recruited on the basis of self-identification as non-allergic donors. Non-atopy was confirmed by clinical history and allergen-specific IgE screening (Extended Data Table 1). Total IgE, Ara h 2-specific IgE, Fel d 1-specific IgE, Der p 1-specific IgE, and Bet v 1-specific IgE were determined by ImmunoCap Assay (Phalleon, Thermo Scientific) according to the manufacturer’s protocols. Primary IgE was enriched from serum samples by serially depleting IgG using protein G agarose (GE Healthcare) followed by anti-IgE conjugated N-hydroxysuccinimide (NHS) beads (GE Healthcare). IgE purity was confirmed by protein electrophoresis and Coomassie gel staining. Recombinant OVA-specific IgE was generated as described17. In brief, complementary DNA sequences for generating OVA-specific heavy (ε) and light (κ) chains of mouse and human IgE17 were cloned into plasmid pcDNA3.4 using restriction-enzyme sites XbaI and AgeI. To generate recombinant OVA-specific mouse or human IgE, plasmids containing OVA-specific heavy and light chains were transiently co-transfected at a 1:1 ratio using an Expi293 Expression System Kit (Life Technologies) according to the manufacturer’s protocol. Cells expressing IgE were selected by adding 400 μg ml−1 of the antibiotic G418 to the culture medium for two weeks, and maintained before expanding to a larger-scale production. OVA-specific IgE was purified from cell culture supernatant using OVA-coupled agarose beads17.
ELISA
Sandwich ELISA for quantifying mIgE and OVA-specific binding was conducted as described17. In brief, 96-well Nunc plates were coated with goat polyclonal anti-mouse IgE (Bethyl Laboratories) or OVA, and blocked with bovine serum albumin (BSA) in PBS (1% BSA for mIgE and 2% for OVA) before sample incubation. Samples were probed with goat polyclonal anti-mouse IgE conjugated to horseradish peroxidase (HRP; 2 ng ml−1; Bethyl Laboratories). The reactions were detected using 3,3,5,5-tetramethylbenzidine (TMB; Thermo Fisher Scientific) and stopped with 2 M sulfuric acid; absorbance was measured at 450 nm.
gMS and glycopeptide analysis
We quantified the site-specific glycosylation of IgE isolated from non-allergic donors and from donors with a peanut allergy by using nanoscale liquid chromatography with tandem mass spectrometry (LC-MS/MS) following enzymatic digestion of the proteins as described previously, with minor modifications16,17,18 (Extended Data Table 2). Isolated polyclonal primary hIgE and myeloma hIgE (Sigma Aldrich catalogue number AG30P) were prepared for proteolysis by denaturing the protein in 6 M guanidine HCl, followed by reduction with dithiothreitol, alkylation with iodoacetamide, and dialysis into 25 mM ammonium bicarbonate (pH 7.8). Proteolysis was carried out with either trypsin to quantify N218, N371 and N394, or chymotrypsin to quantify N140, N168 and N265. For the tryptic digest, IgE was incubated with trypsin (Trypsin Gold Promega) at a 1:50 enzyme-to-substrate ratio overnight at 37 °C. For the chymotryptic digest, IgE was incubated with chymotrypsin (Sequencing Grade Promega) at a 1:100 enzyme-to-substrate ratio for 4 h at 25 °C. Both enzymes were quenched with formic acid added to 2% w/w. The separation was performed on a Thermo EasySpray C18 nLC column (0.75 μm × 50 cm) using water and acetonitrile with 0.1% formic acid for mobile phase A and mobile phase B, respectively. A linear gradient from 1% to 35% mobile phase B was run over 75 min. Mass spectra were recorded on a Thermo Q Exactive mass spectrometer operated in positive mode using data-independent acquisition (DIA), targeting the masses shown in Extended Data Table 2. Glycopeptides were quantified on the basis of the extracted ion area of the Y1 ion (Extended Data Fig. 2). Relative abundances were calculated for all identified glycan species for each site. Myeloma IgE (Sigma Aldrich catalogue number AG30P) was run before paired sample sets to monitor retention-time shifts and to ensure consistency in the analytical results across the sample set. The number of sugar residues per site per IgE molecule was calculated using the relative abundance of each glycan. For example, if we determined a particular site to have 60% monosialylated and fucosylated glycans (A1F) and 40% of disialylated and fucosylated glycans (A2F), then the number of sialic acids at one site would be 1.4 ((0.6 × 1) + (0.4 × 2)), with a total of 2.8 sialic acids per molecule (accounting for two sites).
Generation of NEUFcε
We designed the neuraminidase fusion protein by fusing a κ light chain secretion signal sequence to the sialidase gene from Arthrobacter urefaciens (EC 3.2.1.18, gene AU104)30. The stop codon of AU104 was omitted; instead, a short flexible linker peptide (GGGGGG), the mouse IgE Cε2, Cε3 and Cε4 domains, and a 6× histidine tag were inserted into the carboxy terminus of the sialidase. The gene was codon-optimized for humans and synthesized by GenScript. The 288-kDa protein was then produced by WuXi biologics. Sialidase activity of NEUFcε was determined by the level of p-nitrophenol released from 250 μM 2-O-(p-nitrophenyl)-α-d-N-acetylneuraminic acid (Sigma) in 100 mM sodium phosphate (pH 5.5) for 10 min at 37 °C. The reaction was terminated by adding 0.5 M sodium carbonate and absorbance quantified at 405 nm.
Mice
Five- to six-week-old female BALB/c mice were purchased from the Jackson Laboratory and used here. All mice were housed in specific-pathogen-free conditions according to the National Institutes of Health (NIH), and all animal experiments were conducted under protocols approved by the MGH Institutional Animal Care and Use Committee (IACUC), in compliance with appropriate ethical regulations. For all experiments, the allocation of age- and sex-matched mice to experimental groups was randomized, with four to five mice per group, each experiment being repeated three independent times. No statistical method was used to determine sample size.
PCA was conducted as described17. In brief, monoclonal SiamIgE or AsmIgE specific for OVA or DNP (clone SPE-7, Sigma Aldrich) was injected intradermally into mouse ears. For experiments in which OVA-specific AsmIgE was added to OVA-specific SiamIgE, an mIgE isotype control (clone MEA-36, Biolegend) was included. The next day, mice were intravenously challenged with 125 μg OVA or DNP–HSA (both from Sigma Aldrich) and 2% Evans blue dye in PBS. Forty-five minutes after challenge, the ears were excised and minced before incubation in N,N-dimethyl-formamide (EMD Millipore) at 55 °C for 3 h. The degree of blue dye in the ears was quantified by absorbance at 595 nm.
PSA was elicited as described, with minor modifications31,32. In brief, mice were injected intravenously with monoclonal mIgE specific for OVA or DNP (clone SPE-7, Sigma Aldrich) in PBS, and challenged the next day intravenously with PBS containing 1 mg OVA or DNP–HSA (both from Sigma Aldrich). To examine the therapeutic potential of AsmIgE, on the first day we injected mice intravenously with 10 μg DNP-specific mIgE (clone SPE-7, Sigma Aldrich); on the second day we injected them intravenously with PBS, 20 μg OVA-specific SiamIgE or 20 μg OVA-specific AsmIgE; and on the third day we challenged them intravenously with 1 mg DNP–HSA or OVA (Sigma Aldrich). To test the therapeutic potential of NEUFcε, mice injected intravenously with 10 μg OVA-specific mIgE on the first day were further injected intravenously with PBS, 100 μg NEUFcε or 100 μg mIgE isotype control (clone MEA-36, Biolegend) the next day and challenged intravenously with 1 mg OVA (Sigma-Aldrich) the third day. Core temperature was recorded at the baseline and every 10 min after allergen challenge in a blinded manner with a rectal microprobe thermometer (Physitemp). Histamine in the blood was quantified using a histamine enzyme immunoassay kit (SPI-Bio) according to the manufacturer’s protocol. In brief, histamine in the blood was derivatized and incubated with plate precoated with monoclonal anti-histamine antibodies and histamine–acetylcholinesterase tracer at 4 °C for 24 h. The plate was washed and developed with Ellman’s reagent and absorbance measured at 405 nm.
Passive food anaphylaxis was elicited by adapting the PSA protocol described above. In brief, mice injected intravenously with 20 μg monoclonal mIgE specific for TNP (clone MEA-36, Biolegend) in PBS on the first day were administered with 20 mg TNP–OVA in PBS (Biosearch Technologies) by oral gavage the next day. Core temperature was recorded at the baseline and every 10 min after the challenge using a rectal microprobe thermometer (Physitemp) in a blinded manner.
To determine in vivo half-lives of SiamIgE or AsmIgE, we injected mice intraperitoneally with 30 μg DNP-specific SiamIgE or AsmIgE, and collected blood at the indicated times after injection into a Microtainer blood-collection tube with clot activator/serum separator tube (SST) gel (BD Diagnostics). We quantified the level of mIgE by mIgE ELISA as above.
Basophil activation tests
Basophil activation was performed as described33. Buffy coats of human blood from healthy, de-identified, consenting donors were obtained from the MGH Blood Transfusion Service. Peripheral blood mononuclear cells (PBMCs) were separated from buffy coats by density gradient centrifugation using Ficoll Paque Plus (GE Healthcare), and resuspended in 0.5% BSA in RPMI 1640 medium (GE Healthcare). PBMCs were incubated for 2 min with ice-cold lactic acid buffer (13.4 mM lactate, 140 mM NaCl, 5 mM KCl, pH 3.9) to remove endogenous human IgE on the cell surface before neutralization with 12% Tris (pH 8). Cells were then washed and incubated 1 h at 37 °C with 1 μg OVA-specific SiahIgE or AshIgE per 1 × 10⁶ cells in basophil activation buffer (0.5% BSA, 2 mM CaCl2 and 2 mM MgCl2 in RPMI 1640 medium). Sensitized cells were washed and resuspended in basophil activation buffer supplemented with 10 ng ml−1 human interleukin-3 (PeproTech) before activation with OVA for 30 min. Activation was stopped by addition of ice-cold 0.2 M EDTA in FACS buffer. Cells were washed and resuspended in FACS buffer before antibody staining (Extended Data Table 3) for activation markers (LAMP-3 or CD63+) on basophils (CD123+ HLADR−).
Culture and degranulation of human mast cells
The human LAD2 mast-cell line was a gift from D. D. Metcalfe (National Institute of Allergy and Infectious Diseases (NIAID), NIH) and was maintained as described17,34. In brief, LAD2 cells were cultured in StemPro-34 SFM medium (Life Technologies) supplemented with 2 mM l-glutamine, 100 U ml−1 penicillin, 100 μg ml−1 streptomycin and 100 ng ml−1 recombinant human stem cell factor (PeproTech). The cells were hemi-depleted each week with fresh medium and maintained at 2 × 10⁵ to 5 × 10⁵ cells per millilitre at 37 °C and 5% CO2.
Primary human mast cells were generated as described35. In brief, we separated PBMCs from buffy coats as above, before isolating CD34+ pluripotent haematopoietic cells using the EasySep human whole blood CD34-positive selection kit II (Stemcell Technologies). We cultured CD34+ cells in StemPro-34 SFM medium (Life Technologies) supplemented with 2 mM l-glutamine, 100 U ml−1 penicillin, 100 μg ml−1 streptomycin, 50 ng ml−1 recombinant human stem cell factor (PeproTech) and 50 ng ml−1 human interleukin-6 (PeproTech), and with 10 ng ml−1 human interleukin-3 (PeproTech) in the first week. After the first week we matured the cells in similar culture medium but without human interleukin-3 for ten weeks. Cultured mast cells were confirmed by FACS staining of CD45+, KIT+ and FcεRI+.
Degranulation assays were performed as described17. LAD2 or peripheral blood derived human mast cells were sensitized overnight with 1 μg ml−1 OVA-specific hIgE or 50 ng ml−1 peanut-allergic hIgE. The following day, the cells were pelleted by centrifugation, resuspended in HEPES buffer, plated in 96-well plates, and stimulated with allergen OVA or crude peanut extract at defined concentrations. Upon allergen challenge, mast cell degranulation was determined by the amount of substrate p-nitrophenyl N-acetyl-β-d-glucosamide digested by β-hexosaminidase release from mast cell granules at absorbance of 405 nm. To assess the effect of sialic acid removal on IgE-bound mast cells, we treated IgE-sensitized LAD2 cells with NEUFcε, heat-inactivated NEUFcε or mIgE isotype control (clone MEA-36, Biolegend) for 20 min before allergen challenge. To inactivate NEUFcε, we heated the enzyme at 95 °C for 10 min. To determine whether addition of a surrogate asialylated glycoprotein could recapitulate the phenotype of sialic acid removal from IgE, LAD2 cells sensitized with OVA-specific SiahIgE were incubated with sialylated fetuin (SiaFetuin) or asialylated fetuin (AsFetuin) at defined amounts for 20 min before allergen challenge.
Preparation of crude peanut extract
Unsalted dry-roasted peanuts (blanched jumbo runner cultivar, Planters) were ground to a smooth paste, then washed with 20 volumes of cold acetone, filtered using Whatman paper, and dried as described17. Protein was extracted by agitating the peanut flour overnight with PBS containing protease-inhibitor cocktail without EDTA (Roche). The peanut protein extracts were collected as the supernatant after centrifugation at 24,000g for 30 min.
IgE glycosylation engineering
To remove sialic acids on IgE, we digested IgE with glyko sialidase A (recombinant from A. urefaciens expressed in Escherichia coli, Prozyme) at 37 °C for 72 h according to the manufacturer’s instructions. To resialylate AsmIgE by in vitro sialylation, we incubated AsmIgE with human α-2,6 sialyltransferase 1 (ST6GAL1, provided by H. Meade, LFB-USA) at a ratio of 20 μg AsmIgE per μg of ST6GAL1 and 5 mM cytidine-5′-monophospho-N-acetylneuraminic acid (CMP-Neu5Ac2, Nacalai USA) in the sialylation buffer (150 mM NaCl, 20 mM HEPES, pH 7.4) overnight at room temperature as described36. Following reactions, OVA-specific SiaIgE or AsIgE was purified with OVA-coupled beads to remove glycosylation modifying enzymes as described17. All digestion or sialylation reactions were verified by lectin blotting or high-performance liquid chromatography (HPLC).
Protein gel stain and lectin blotting
Equal amounts of SiaIgE or AsIgE were resolved on 3–8% Tris-acetate protein gels (Life Technologies) in SDS–PAGE under nonreducing conditions. For protein staining, gels were incubated in AcquaStain protein gel stain (Bulldog Bio) for 1 h at room temperature and destained in distilled water. For lectin blotting, the protocol was conducted as described17. Briefly, after resolved proteins on the gel were transferred to Immobilon-PSQ polyvinylidene difluoride membranes (Millipore Sigma), the membranes were blocked with 0.2% BSA in Tris-buffered saline (TBS) for 1 h at room temperature, washed in TBS, and then incubated with biotinylated S. nigra (SNA) lectin (0.4 μg ml−1, Vector Laboratories) in TBS with 0.1 M Ca2+ and 0.1 M Mg2+ for 1 h at room temperature to determine the level of terminal α2,6-sialic acids on N-linked glycans of proteins. The membrane was then washed in TBS and incubated with alkaline-phosphatase-conjugated goat anti-biotin (1:5,000 dilution; Vector Laboratories) in TBS for 1 h at room temperature. Sialylated proteins on membranes were visualized by incubation with one-step nitro-blue tetrazolium chloride (NBT)/5-bromo-4-chloro-3′-indolyphosphate p-toluidine (BCIP) substrate solution (Thermo Scientific).
Flow cytometry
Details of antibodies used for surface staining are listed in Extended Data Table 3. To stain mouse cells, we incubated suspended cells with anti-mouse CD16/CD32 (clone 2.4G2, BD Biosciences) before antibody staining. Cells were incubated in FACS buffer with desired staining antibodies for 20 min at 4 °C. Cells were then washed in FACS buffer before being acquired by an LSRII flow cytometer (BD Biosciences) or CytoFLEX (Beckman Coulter). Data were analysed using FlowJo software version 10.4 software (Tree Star). To quantify OVA-specific hIgE loading following sensitization, we incubated PBS or 1 μg ml−1 OVA-specific SiahIgE or AshIgE with 2.5 × 10⁵ LAD2 cells per millilitre overnight, before washing with FACS buffer and staining with anti-Kit antibody and OVA-A647. To quantify native hIgE loading on LAD2 mast cells, we sensitized cells with 32 ng total non-atopic or allergic hIgE overnight before washing in FACS buffer and staining with anti-Kit and anti-hIgE antibodies. To quantify dermal mast cell IgE loading, we generated single-cell suspensions from mouse ears as described17. Ears were intradermally injected with 40 ng OVA-specific SiamIgE or AsmIgE. The following day, ears were removed, separated into dorsal and ventral halves, and minced before incubation in Dulbecco’s modified Eagle medium (DMEM) containing 2% fetal calf serum (FCS), 1% HEPES, 500 units ml−1 collagenase type 4 (Worthington), 0.5 mg ml−1 hyaluronidase (Sigma) and DNase I (Roche) at 37 °C for 1 h at 180 rpm. The digested sample was then subjected to disruption by gentleMACS and filtered through a 70-μm cell strainer followed by a 40-μm cell strainer in FACS buffer (2 mM EDTA and 0.5% BSA in PBS). mIgE loading was detected by FACS using anti-mIgE antibodies on dermal mast cells (CD45+ CD11b− CD11c− Gr1− Kit+).
Biolayer interferometric assays for binding
We studied binding kinetics and affinity of protein interaction using the Octet K2 system (Molecular Devices) with Octet buffer (PBS with 0.025% Tween and 1% BSA). To measure hFcεRIα interactions, 0.25 μg ml−1 histidine-tagged hFcεRIα (Acro Biosystems) was loaded onto anti-penta-histidine (HIS1K) biosensors (Molecular Devices). To analyse OVA interactions, we immobilized OVA (100 μg ml−1) onto amine-reactive second-generation (AR2G) biosensors in 10 mM sodium acetate, pH 5, using 1-ethyl-3-(3-dimethylaminopropyl)carbodiimide hydrochloride (EDC)/sulfo-NHS based chemistry. We determined association of analyte OVA-specific SiahIgE or AshIgE in threefold serial dilution from 90 nM to 1 nM, and of NEUFcε in threefold serial dilution from 24 nM to 0.3 nM in Octet buffer. Analyte dissociation was measured in Octet buffer. Analysis of binding kinetic parameters was performed by Octet data analysis software v.10.0, using interaction of ligand-loaded biosensor with no analyte during the association phase as the reference sensor.
Immunoblotting for Syk signalling
We sensitized 1.5 × 10⁶ LAD2 cells with PBS or 1 μg ml−1 OVA-specific SiahIgE or AshIgE. Sensitized cells were washed and resuspended in HEPES buffer the next day, and then stimulated with 10 μg ml−1 OVA at 37 °C for the indicated times. Cells were immediately centrifuged after OVA stimulation and the cell pellets lysed in ice-cold lysis buffer (RIPA buffer (Boston BioProducts), 1× Halt protease-inhibitor cocktail (Thermo Scientific), 1× Halt phosphatase-inhibitor cocktail (Thermo Scientific) and 2.5 mM EDTA) for 30 min on ice. After incubation on ice, lysed pellets were passed rapidly through a 27G needle on ice and centrifuged at 15,000 rpm at 4 °C for 15 min to clear the membrane and nuclei. The protein concentration was quantified using a Pierce BCA protein assay kit (Thermo Scientific) and 20 μg of protein lysate was loaded per well on 4–12% Bis-Tris protein gels (Life Technologies) in SDS–PAGE under denaturing and reducing conditions. Briefly, after protein transferred to PVDF membranes as above, the membranes were blocked with 5% milk in TBS with 0.1% Tween (TBST) for 1 h at room temperature, washed in TBST, and incubated with 1:2,000 rabbit anti-phospho-Syk (Tyr352) antibody (Cell Signaling Technology) in 5% BSA in TBST overnight at 4 °C. The membrane was washed in TBST, incubated with anti-rabbit-HRP for 1 h at room temperature, and washed again in TBST; this was followed by chemiluminescent detection using Immobilon western chemiluminescent HRP substrate (Millipore Sigma). To detect total Syk on the membrane, after chemiluminescent detection using autoradiography film, the membrane was stripped by incubation in stripping buffer (2% SDS and 0.1 M β-mercaptoethanol in Tris buffer) at 50 °C for 30 min. The stripped membranes were then blocked, washed as above, incubated with 1:2,000 rabbit anti-Syk antibody (Cell Signaling Technology) for 2 h in 5% BSA in TBST at room temperature, and washed again before being incubated with 1:30,000 anti-rabbit-HRP for 1 h at room temperature. To probe for β-actin, the membranes were incubated with 1:150,000 anti-β-actin HRP (Santa Cruz Biotechnology) for 1 h at room temperature and then washed; signal was determined by chemiluminescent detection.
Calcium flux
We sensitized 5 × 10⁵ LAD2 cells overnight with PBS or 500 ng ml−1 OVA-specific SiahIgE or AshIgE. The next day, sensitized cells were washed before loading with 2 μM Fluo-4-AM (Invitrogen) at 37 °C in HEPES buffer for 20 min. After loading, the cells were washed and resuspended in HEPES buffer. Fluorescence was filtered through the 530/30 bandpass filter and collected in FL-1/FITC. Baseline Ca2+ fluorescence levels were recorded for 1 min on the Accuri C6 (BD Biosciences) before adding the indicated allergen or buffer to each sample. At the end of allergen stimulation, 2 μM Ca2+ ionophore A23187 (Sigma) was added to cells as a positive control.
Statistical analyses
Results are shown as means ± s.e.m., except in the case of gMS-quantified glycan residues per IgE molecule (Fig. 1d–h), where results are presented as medians and interquartile ranges. The number of mice used in each experiment is indicated in the figure legends. The investigators were not blinded to allocation during experiments and outcome assessment, except during the measurement of rectal temperature in mice upon antigen challenge in passive systemic and food anaphylaxis. Visual examination of the data distribution as well as normality testing demonstrated that all variables appeared to be normally distributed. Statistical analyses were performed using Prism 8 (GraphPad software) with unpaired and paired Student’s t-test for assessing two unmatched and matched groups, respectively; two-way ANOVA with Sidak’s multiple comparison test for comparing two groups of multiple conditions; and one-way or two-way ANOVA with Tukey’s multiple comparison test for three or more groups. The P values noted throughout highlight biologically relevant comparisons. The accuracy of distinguishing allergic from non-atopic IgE by means of individual IgE glycan moieties was analysed by ROC curves using Prism 8 (GraphPad software). The area under each ROC curve (AUC) was calculated for each glycan moiety. AUCs are interpreted as follows: the maximum AUC (1) indicates that a particular glycan moiety can distinguish allergic IgE from non-atopic IgE; an AUC of 0.5 indicates that the differentiation capacity of a specific glycan moiety is poor.
Reporting summary
Further information on research design is available in the Nature Research Reporting Summary linked to this paper.
Data availability
Source Data are provided for Figs. 1–3 and Extended Data Figs. 1, 4–7. Full scans of all uncropped protein gel stains, lectin blots and western blots with size marker indications presented here can be found in the Supplementary Information. All other data supporting the findings of this study are available from the corresponding author upon request.
References
Gupta, R. S. et al. Prevalence and severity of food allergies among US adults. JAMA Netw. Open 2, e185630 (2019).
Gould, H. J. & Sutton, B. J. IgE in allergy and asthma today. Nat. Rev. Immunol. 8, 205–217 (2008).
Bird, J. A., Crain, M. & Varshney, P. Food allergen panel testing often results in misdiagnosis of food allergy. J. Pediatr. 166, 97–100 (2015).
Du Toit, G. et al. Randomized trial of peanut consumption in infants at risk for peanut allergy. N. Engl. J. Med. 372, 803–813 (2015).
Peters, R. L., Gurrin, L. C. & Allen, K. J. The predictive value of skin prick testing for challenge-proven food allergy: a systematic review. Pediatr. Allergy Immunol. 23, 347–352 (2012).
Arnold, J. N., Wormald, M. R., Sim, R. B., Rudd, P. M. & Dwek, R. A. The impact of glycosylation on the biological function and structure of human immunoglobulins. Annu. Rev. Immunol. 25, 21–50 (2007).
Bégin, P. et al. Phase 1 results of safety and tolerability in a rush oral immunotherapy protocol to multiple foods using omalizumab. Allergy Asthma Clin. Immunol. 10, 7 (2014).
Patil, S. U. et al. Peanut oral immunotherapy transiently expands circulating Ara h 2-specific B cells with a homologous repertoire in unrelated subjects. J. Allergy Clin. Immunol. 136, 125–134 (2015).
Wang, T. T. et al. IgG antibodies to dengue enhanced for FcγRIIIA binding determine disease severity. Science 355, 395–398 (2017).
Lu, L. L. et al. A functional role for antibodies in tuberculosis. Cell 167, 433–443 (2016).
Wang, T. T. et al. Anti-HA glycoforms drive B cell affinity selection and determine influenza vaccine efficacy. Cell 162, 160–169 (2015).
Parekh, R. B. et al. Association of rheumatoid arthritis and primary osteoarthritis with changes in the glycosylation pattern of total serum IgG. Nature 316, 452–457 (1985).
Espy, C. et al. Sialylation levels of anti-proteinase 3 antibodies are associated with the activity of granulomatosis with polyangiitis (Wegener’s). Arthritis Rheum. 63, 2105–2115 (2011).
Wang, T. T. & Ravetch, J. V. Functional diversification of IgGs through Fc glycosylation. J. Clin. Invest. 129, 3492–3498 (2019).
Arnold, J. N. et al. The glycosylation of human serum IgD and IgE and the accessibility of identified oligomannose structures for interaction with mannan-binding lectin. J. Immunol. 173, 6831–6840 (2004).
Plomp, R. et al. Site-specific N-glycosylation analysis of human immunoglobulin E. J. Proteome Res. 13, 536–546 (2014).
Shade, K. T. et al. A single glycan on IgE is indispensable for initiation of anaphylaxis. J. Exp. Med. 212, 457–467 (2015).
Wu, G. et al. Glycoproteomic studies of IgE from a novel hyper IgE syndrome linked to PGM3 mutation. Glycoconj. J. 33, 447–456 (2016).
Yamazaki, T. et al. Receptor-destroying enzyme (RDE) from Vibrio cholerae modulates IgE activity and reduces the initiation of anaphylaxis. J. Biol. Chem. 294, 6659–6669 (2019).
Jabs, F. et al. Trapping IgE in a closed conformation by mimicking CD23 binding prevents and disrupts FcεRI interaction. Nat. Commun. 9, 7 (2018).
Wuhrer, M. et al. Glycosylation profiling of immunoglobulin G (IgG) subclasses from human serum. Proteomics 7, 4070–4081 (2007).
Nimmerjahn, F. & Ravetch, J. V. Anti-inflammatory actions of intravenous immunoglobulin. Annu. Rev. Immunol. 26, 513–533 (2008).
Ding, J. X. et al. Aberrant sialylation of serum IgA1 was associated with prognosis of patients with IgA nephropathy. Clin. Immunol. 125, 268–274 (2007).
Maurer, M. A. et al. Glycosylation of human IgA directly inhibits influenza A and other sialic-acid-binding viruses. Cell Rep. 23, 90–99 (2018).
Colucci, M. et al. Sialylation of N-linked glycans influences the immunomodulatory effects of IgM on T cells. J. Immunol. 194, 151–157 (2015).
Collins, B. E., Smith, B. A., Bengtson, P. & Paulson, J. C. Ablation of CD22 in ligand-deficient mice restores B cell receptor signaling. Nat. Immunol. 7, 199–206 (2006).
Abe, K., Yamamoto, K. & Sinohara, H. Clearance of desialylated mouse alpha-macroglobulin and murinoglobulin in the mouse. J. Biochem. 108, 726–729 (1990).
Fleischer, D. M. et al. Oral food challenges in children with a diagnosis of food allergy. J. Pediatr. 158, 578–583 (2011).
Sampath, V. et al. Deciphering the black box of food allergy mechanisms. Ann. Allergy Asthma Immunol. 118, 21–27 (2017).
Christensen, S. & Egebjerg, J. Cloning, expression and characterization of a sialidase gene from Arthrobacter ureafaciens. Biotechnol. Appl. Biochem. 41, 225–231 (2005).
Dombrowicz, D. et al. Anaphylaxis mediated through a humanized high affinity IgE receptor. J. Immunol. 157, 1645–1651 (1996).
Dombrowicz, D., Flamand, V., Brigman, K. K., Koller, B. H. & Kinet, J. P. Abolition of anaphylaxis by targeted disruption of the high affinity immunoglobulin E receptor alpha chain gene. Cell 75, 969–976 (1993).
MacGlashan, D. Jr, Lavens-Phillips, S. & Katsushi, M. IgE-mediated desensitization in human basophils and mast cells. Front. Biosci. 3, d746–d756 (1998).
Kirshenbaum, A. S. et al. Characterization of novel stem cell factor responsive human mast cell lines LAD 1 and 2 established from a patient with mast cell sarcoma/leukemia; activation following aggregation of FcεRI or FcγRI. Leuk. Res. 27, 677–682 (2003).
Bandara, G., Metcalfe, D. D. & Kirshenbaum, A. S. Growth of human mast cells from bone marrow and peripheral blood-derived CD34+ pluripotent hematopoietic cells. Methods Mol. Biol. 1220, 155–162 (2015).
Anthony, R. M. et al. Recapitulation of IVIG anti-inflammatory activity with a recombinant IgG Fc. Science 320, 373–376 (2008).
Acknowledgements
We thank K. Jeffrey, F. Wermeling and A. Luster for constructive comments; T. Stanley and D. Hayden (Harvard Catalyst) for guidance in biostatistical analysis; N. Smith for technical assistance; and the patients participating in our studies. This work was supported by grants from the NIH (DP2AR068272 and R01AI139669) and FARE to R.M.A.; NIH T32 and K12 fellowships (T32AR007258 and K12HL141953) to K.C.S.; an NIH NIAID K23 grant (K23AI121491) to S.U.P.; an NIH NIAID U19 grant (5U19 AI095261-03) to W.G.S.; and a Sanofi iAward to M.E.C.
Author information
Authors and Affiliations
Contributions
K.C.S. conducted mouse experiments, performed functional assays, developed methods, and generated resources, along with D.J.H.; M.K. cloned, generated and characterized NEUFcε; M.E.C. purified samples and analysed data, along with E.L.; N.W. performed mass spectrometry on purified samples; S.U.P. and W.G.S. acquired patient sample resources; S.U.P. and W.G.S. provided collected clinical samples; and R.M.A. conceived and supervised the study, and wrote the manuscript along with K.C.S., M.E.C., S.U.P. and W.G.S.
Corresponding author
Ethics declarations
Competing interests
The authors declare no competing interests.
Additional information
Peer review information Nature thanks Steve Galli, Kari Nadeau and Jim Paulson for their contribution to the peer review of this work.
Publisher’s note Springer Nature remains neutral with regard to jurisdictional claims in published maps and institutional affiliations.
Extended data figures and tables
Extended Data Fig. 1 Characterization of non-atopic and allergic human IgE.
a, Allergen-specific IgE levels for Ara h 2 (peanut; non-atopic, n = 11; allergic, n = 30), Der p 1 (dust mite; n = 5, 3), Fel d 1 (cat; n = 5, 3) and Bet v 1 (birch pollen; n = 4, 3). b, Strategy for enriching IgE from human sera. c, Quantified degranulation of human LAD2 mast cells sensitized with PBS, non-atopic IgE or allergic IgE and stimulated with anti (α)-human IgE (PBS, n = 1; non-atopic, n = 4; allergic, n = 4). d, Quantified MFI (left) and representative histograms (right) of anti-hIgE FACS staining on human LAD2 mast cells sensitized with PBS, non-atopic hIgE or allergic hIgE (PBS, n = 3; non-atopic, n = 4; allergic, n = 3). APC, allophycocyanin. e, Anti-hIgE from c, d binds similarly to SiahIgE and AshIgE, as determined by hIgE ELISA assays. n = 2 technical replicates per group, representative of three experiments. f, g, IgE glycan distribution by sex (f; n = 9 males; n = 12 females) and age (g; 0–9 years, n = 2; 10–19, n = 2; 20–29, n = 6; 30–39, n = 7; 40–49, n = 1; 50–59, n = 2; 60–69, n = 1). h, Representative structures of complex N-linked glycans from Fig. 1j. Data shown are means ± s.e.m. (a, c, d, f, g). P-values were determined by two-tailed unpaired t-test (d, f) or two-way ANOVA with Sidak’s multiple comparison test (a, c, g). n represents biologically independent serum samples (a, c, d, f, g).
Extended Data Fig. 2 N-linked glycans observed on native human IgE.
a, Representative MS/MS spectrum for N265-linked A2F glycopeptide, showing the B ions (non-reducing end fragments) and Y ions (reducing end fragments containing the intact peptide) resulting from glycosidic-bond cleavage, and the b ions containing the peptide N terminus resulting from peptide-bond cleavage. The Y1 ion used for quantification of glycopeptides is circled (n = 18 biologically independent samples). b, Extracted ion chromatograms for IgE N265-linked sialylation variants from a patient with an allergy and a non-atopic donor. c, Extracted ion chromatograms for IgE N168-linked sialylation variants from a patient with an allergy and a non-atopic donor. AV, average (referring to the number of spectra averaged); BP, base peak; MA, manual integration; RT, retention time.
Extended Data Fig. 3 N-linked glycans observed on IgE myeloma standard.
a, b, Extracted ion chromatograms for site-specific N-linked glycosylation from chymotryptic (a) or tryptic (b) digest of the IgE myeloma sample used as a standard.
Extended Data Fig. 4 Site-specific characterization of resolved IgE glycans from non-atopic individuals and individuals with allergies.
a, Occupancy of N-linked glycosylation sites: N140 (non-atopic, n = 15; allergic, n = 13), N168 (n = 16, 14), N218 (n = 15, 15), N265 (n = 12, 15), N371 (n = 15, 15), N383 (n = 16, 15) and N394 (n = 13, 16). b, Percentage of oligomannose moieties at N394 (n = 23, 18). c, Number of fucose residues: N140 (n = 15, 13), N168 (n = 15, 17), N218 (n = 15, 19), N265 (n = 12, 18) and N371 (n = 15, 17). d, Number of biGlcNAc residues: N140 (n = 15, 13), N168 (n = 16, 17), N218 (n = 15, 19), N265 (n = 16, 20) and N371 (n = 16, 17). e, Number of galactose residues: N140 (n = 15, 14), N168 (n = 15, 17), N218 (n = 15, 19), N265 (n = 12, 19) and N371 (n = 15, 17). f, Number of sialic acid residues: N140 (n = 14, 13), N168 (n = 15, 13), N218 (n = 15, 17), N265 (n = 12, 19) and N371 (n = 15, 17). Data plotted are means ± s.e.m. P values were determined by two-way ANOVA with Sidak’s multiple comparison test. n represents biologically independent serum samples (a–f).
Extended Data Fig. 5 Removal of sialic acid from IgE.
a, Protein gel stain and lectin blots of IVIG, native human IgE purified from patients with allergies, and fetuin. MALI, Maackia amurensis lectin I. b, HPLC glycan traces of undigested (Utx) allergic hIgE and fetuin; of allergic hIgE and fetuin digested with sialidase from A. ureafaciens to release α2,3-, α2,6-, α2,8- and α2,9-linked sialic acids (α2-3, 6, 8, 9 NEU-tx); and allergic hIgE and fetuin digested with sialidase from Streptococcus pneumoniae to release α2,3-linked sialic acids (α2-3 NEU-tx). c, HPLC glycan traces of undigested or recombinant OVA-specific mIgE digested with sialidase from A. ureafaciens. d, Left, quantification of vascular leakage by Evan’s blue dye (n = 6 mouse ears per group) after PCA in mice sensitized with PBS or with SiamIgE or AsmIgE specific for DNP; right, representative ear images. e, Gating strategy for IgE loading on mouse skin ear mast cells. Shown are representative FACS plots used to identify mast cells in mouse ears and to determine IgE levels on mouse ear mast cells. SSC, side scatter. f, Binding of OVA-specific SiamIgE and AsmIgE to OVA, as determined by ELISA. n = 2 technical replicates per group, representative of three biologically independent experiments. g, h, OVA-elicited systemic anaphylaxis as measured by temperature drop in mice sensitized with PBS, OVA-specific SiamIgE (g, n = 4; h, n = 6) or OVA-specific AsmIgE (g, n = 5; h, n = 6) by intravenous (g) or intraperitoneal (h) injection. i, Serum levels of DNP-specific SiamIgE (n = 4) and AsmIgE (n = 3) in mice at defined times after systemic administration, determined by ELISA. Data are means ± s.e.m. and are representative of three experiments. P values determined by two-tailed paired t-test (d) or two-way ANOVA with Tukey’s multiple comparison test (g, h).
Extended Data Fig. 6 FACS analysis of loading of human mast cells with SiahIgE or AshIgE, phenotypic staining of PBMC-derived mast cells, and activation in primary basophils.
a, MFI (left) and representative histogram (right) of surface-bound hIgE on LAD2 mast cells following sensitization with PBS, OVA-specific SiahIgE or OVA-specific AshIgE (n = 3 technical replicates per group). Data are means ± s.e.m. and are representative of three independent experiments; one-way ANOVA with Tukey’s multiple comparison test. b, Representative phenotypic staining by FACS of primary human mast cells from peripheral blood derived CD34+ pluripotent haematopoietic cells (n = 2 technical replicates per group). c, Gating strategy for basophil activation assay, showing representative FACS plots used to determine basophil activation from PBMCs.
Extended Data Fig. 7 PSA for IgE isotype controls and characterization of NEUFcε.
a, Temperature change following OVA-induced PSA in mice receiving DNP-specific SiamIgE on day 0, and then PBS, OVA-specific SiamIgE or OVA-specific AsmIgE isotype controls (from Fig. 3e) on day 1. n = 4 mice for all groups; two-way ANOVA with Tukey’s multiple comparison test. b, Protein gel stain (left) and immunoblot (IB) for mIgE (right) of native and denatured NEUFcε. c, Binding kinetics of analyte NEUFcε to ligand hFcεRIα on biosensor. Kinetics of analytes of threefold serial dilution from 26.2 nM to 0.32 nM were analysed. d, FACS analysis of surface-bound NEUFcε on LAD2 mast cells following 30 min of sensitization at 37 °C. n = 3 technical replicates per group, representative of two independent experiments. e–h, Neuraminidase activity of NEUFcε determined by digestion of mIgE or fetuin overnight (e–g), and detection of protein loading by Coomassie blue (e), terminal α2,6-sialic acid by SNA (f), and terminal galactose by Erythrina cristagalli lectin (ECL) (g) or by the amount of substrate 2-O-(p-nitrophenyl)-α-d-N-acetylneuraminic acid digested by NEUFcε in a colorimetric assay (h; n = 3 technical replicates per group, representative of two independent experiments). Data are means ± s.e.m.
Supplementary information
Supplementary Figure 1
Full scans of uncropped protein gel stains, lectin, or western blots with size marker indications presented in this manuscript.
Rights and permissions
About this article

Cite this article
Shade, KT.C., Conroy, M.E., Washburn, N. et al. Sialylation of immunoglobulin E is a determinant of allergic pathogenicity. Nature 582, 265–270 (2020). https://doi.org/10.1038/s41586-020-2311-z
Received:
Accepted:
Published:
Issue Date:
DOI: https://doi.org/10.1038/s41586-020-2311-z
This article is cited by
-
Mechanism of glycoform specificity and in vivo protection by an anti-afucosylated IgG nanobody
Nature Communications (2023)
-
Impact of ultra-low temperature storage on serum sIgE detection and allergic disease biobank feasibility
Scientific Reports (2023)
-
Risk factors and postnatal biomarkers for acute placental inflammatory lesions and intrauterine infections in preterm infants
European Journal of Pediatrics (2022)
-
B cells and the microbiota: a missing connection in food allergy
Mucosal Immunology (2021)
-
FUT6 deficiency compromises basophil function by selectively abrogating their sialyl-Lewis x expression
Communications Biology (2021)
Comments
By submitting a comment you agree to abide by our Terms and Community Guidelines. If you find something abusive or that does not comply with our terms or guidelines please flag it as inappropriate.
