
Global CO2 emissions in 2021 were only 1% less than the record levels of 2019, driven by increases in power- and industry-related emissions from China and India and a return of the carbon intensity of electricity to pre-pandemic levels. Is this resumed growth in fossil energy, or a final fleeting surge before a long decline?
Four years after the Paris Agreement was adopted, global fossil-fuel emissions reached a record high of more than 35 Gt CO2 in 2019 (ref. 1). Widespread disruptions in human activity and energy use caused by the COVID-19 pandemic then led to an unprecedented 6% drop in 2020 emissions, to 33.3 Gt CO2 (refs. 2,3). In turn, this remarkable decrease in emissions led analysts to speculate about longer-term changes in the way that energy is generated and used worldwide, and — given persistently high growth rates of renewable energy and increasingly ambitious climate commitments — about whether 2019 could even have been the high-water mark of global emissions4,5,6. Specifically, analysts expect the long-term decline of fossil energy to begin when annual increases in renewables and other non-fossil sources of energy entirely meet new energy demand — a time that may be hastened by both pandemic-related decreases in energy demand (–4% in global energy demand in 2020 (ref. 7)) and stimulus-driven increases in the growth rate of renewable energy.
However, the latest estimates of the Carbon Monitor (an international collaboration that was initiated in 2020 to track global, regional and sectoral emissions in near real-time), based on assimilated activity data from major countries and sectors8, reveal a strong rebound of emissions in 2021. Emissions between 1 January and 31 December 2021 were only 1% less than those of the same period in 2019 (Fig. 1). Global emissions in 2021 reached 34.9 ± 0.3 Gt CO2 — a 4.8% increase on the year, which brought emissions just shy of 2019 levels. Our estimate is very similar to recent independent International Energy Agency projections of a 4.8% increase in 2021 (ref. 7). These emissions are an integrated measure of the race between rebound and non-fossil sources of energy, and at a global level they suggest that energy demand is resurgent and outpacing efforts to ‘build back better’.

a, Long-term increases in global CO2 emissions have been punctuated by decreases in some years related to global crises such as the COVID-19 pandemic. b–d, The pandemic-related decreases in emissions were greatest in mid-2020 and rebounded strongly in 2021 (b), although changes in emissions have varied across regions (c) and sectors (d). EU, European Union; RoW, rest of world.
Yet the patterns of emissions decrease and rebound for 2019–2020 have varied widely across regions and sectors (Fig. 1c,d). The emissions decrease in the United States was larger than in any other individual country (–9.5% in 2020), but the rebound has also been strong (+6.5% in 2021; blue bars). The combined reductions in 2020 emissions from smaller countries were also quite large (brown bars), but in contrast there has been little recovery in these countries’ emissions in 2021. Meanwhile, in India, Russia and Brazil, 2021 emissions exceeded those in 2019 by 0.7%, 3.0% and 8.2%, respectively (dark green, orange and yellow bars), and in China annual emissions did not decrease at all, but grew by 0.9% in 2020 and increased by a further 5.7% in 2021 (red bars). These differences are noteworthy indicators of both the magnitude and persistence of pandemic-related disruptions in different regions. In particular, 2021 emissions would have probably exceeded 2019 emissions if not for the mostly low-income ‘rest of world’ countries that have not recovered from the pandemic.
Similarly, emissions from road transportation and aviation decreased substantially in 2020 (Fig. 1d; road transportation by –10.9% in orange, and domestic and international aviation by –30.8% and –56.0% in dark green and blue, respectively) and are on track to remain below 2019 levels in 2021 (although they have all rebounded somewhat as lockdowns have lifted around the world). Meanwhile, power- and industry-sector emissions recovered from substantial drops during 2020, with their emissions in 2021 1.5% greater and 0.2% less, respectively, than in 2019 (light green and yellow bars). Increases in power-related emissions relative to 2019 underscore the strong rebound of fossil energy within the sector most amenable to decarbonization.
Further analysing the changes in power-related emissions in major countries shows that the largest decreases in the second quarter of 2020 were driven by reductions in the carbon intensity of electricity, but that corresponding increases in carbon intensity also underlie increases in power-sector emissions in 2021 (Fig. 2). This suggests that the carbon intensity of the global power sector is highly sensitive to electricity demand at present — when demand declined, use of fossil fuels plummeted, but as demand has rebounded, fossil generators have just as quickly resumed operations. Moreover, despite gradual increases in the share of non-fossil electricity in major countries, the carbon intensity of electricity has increased markedly in late 2021 (Fig. 2c), reflecting a resurgence in coal-based generation as natural gas prices have recently risen9.
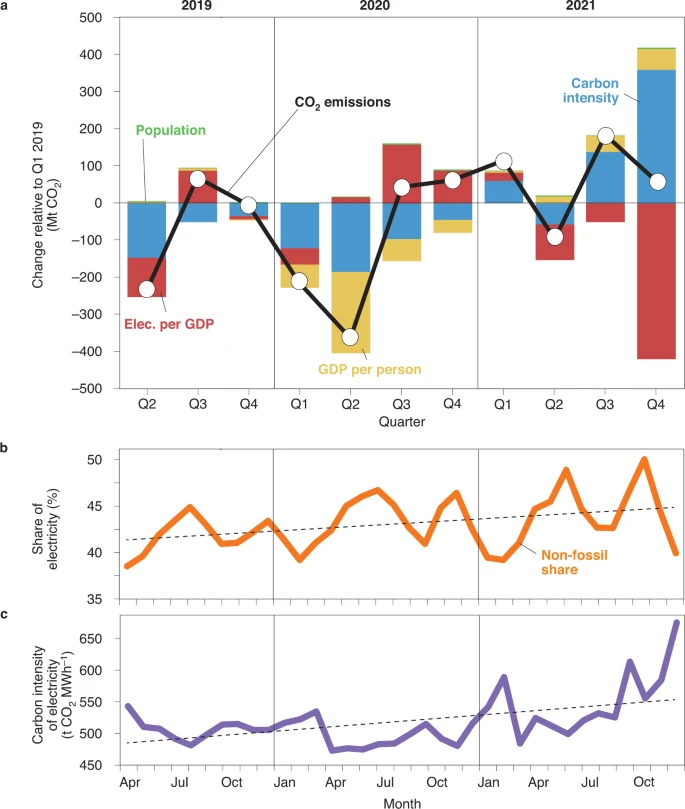
a, Changes in electricity-related CO2 emissions from China, India, the EU, the United States, Japan, Brazil and Russia (a, black line) relative to the beginning of 2019 have most often been driven by changes in carbon intensity (CO2 per unit electricity consumed; blue bars), with the largest decreases during the second quarter of 2020 and rebounds in 2021 also influenced by changes in economic activity (gross domestic product (GDP) per person; yellow bars). b,c, Although the share of non-fossil electricity has been gradually increasing over the period (b), the overall carbon intensity of electricity also increased in 2021, reflecting decreases in gas and oil electricity and increases in coal.
Thus, the latest estimates cast doubt on the prospect that 2019 was the high point of global fossil-fuel emissions. Although solar and wind energy continue to grow much faster than fossil sources (for example, renewables accounted for 83% of new power capacity in 2020 (ref. 10) and only China installed substantial new coal capacity11), overall energy use and emissions are recovering rapidly in many places, and some tallies show that more energy-related stimulus has gone to fossil fuels than to renewables10. Despite this, decades-long trends in non-fossil energy and large fluctuations in the carbon intensity of electricity during the pandemic indicate that the long dominance of fossil fuels is now precarious. When and how quickly the use of such fuels will decline, however, will depend on how successful countries are in moderating increases in energy demand, curtailing further growth of fossil energy12, and accelerating growth of non-fossil energy sources. Although many of the mitigation scenarios recently produced by integrated assessment models, energy system models and industry groups project fossil emissions to increase for years to come13,14, such models have routinely and systematically underestimated the falling costs and related growth of modern renewables such as solar photovoltaics15,16 — and may be doing so again17. If so, as world leaders look to implement agreements from COP26, and as the latest IPCC reports are released, the most important task may be to remove barriers to the deployment of renewables. In any event, the coming year should reveal whether 2021 was a fleeting spike at the beginning of a long downward trend in emissions, or whether fossil-fuel emissions have more years of growing to do.
References
Friedlingstein, P. et al. Earth Syst. Sci. Data 12, 3269–3340 (2020).
Quéré, C. L. et al. Nat. Clim. Change 10, 647–653 (2020).
Liu, Z. et al. Nat. Commun. 11, 5172 (2020).
Kikstra, J. S. et al. Nat. Energy 6, 1114–1123 (2021).
Quéré, C. L. et al. Nat. Clim. Change 11, 197–199 (2021).
Henbest, S. et al. New Energy Outlook (BloombergNEF, 2021).
Global Energy Review 2021 (IEA, 2021).
Liu, Z. et al. Sci. Data 7, 392 (2020).
Plumer, B. How spiking energy prices complicate the fight against global warming. The New York Times (2 February 2022).
Renewables 2021 Global Status Report (REN21, 2021).
Shearer, C. et al. Boom and Bust: Tracking the Global Coal Plant Pipeline (CoalSwarm, Sierra Club, Greenpeace, 2016).
Littlecott, C. et al. No New Coal by 2021: The Collapse of the Global Coal Pipeline (E3G, 2021).
World Energy Outlook 2016 (IEA, 2016).
DeAngelo, J. et al. Nat. Commun. 12, 6096 (2021).
Davis, S. J. Nat. Energy 3, 257–258 (2018).
Creutzig, F. et al. Nat. Energy 2, 17140 (2017).
Way, R. et al. Empirically Grounded Technology Forecasts and the Energy Transition (Oxford Martin School, 2021).
Acknowledgements
S.J.D. and C.H. were supported by Climate Imperative and a grant from the US National Science Foundation and US Department of Agriculture (EAR 1639318). P.C. was supported by the VERIFY H2020 project. The authors also acknowledge support from the National Natural Science Foundation of China (grant nos 41921005 and 71874097), Beijing Natural Science Foundation (JQ19032) and the Qiu Shi Science & Technologies Foundation.
Author information
Authors and Affiliations
Corresponding authors
Ethics declarations
Competing interests
The authors declare no competing interests.
Rights and permissions
About this article

Cite this article
Davis, S.J., Liu, Z., Deng, Z. et al. Emissions rebound from the COVID-19 pandemic. Nat. Clim. Chang. 12, 412–414 (2022). https://doi.org/10.1038/s41558-022-01332-6
Published:
Issue Date:
DOI: https://doi.org/10.1038/s41558-022-01332-6
This article is cited by
-
The impact of COVID-19 fiscal spending on climate change adaptation and resilience
Nature Sustainability (2024)
-
Time and frequency analysis of daily-based nexus between global CO2 emissions and electricity generation nexus by novel WLMC approach
Scientific Reports (2024)
-
Causal Linkage Effect on Chinese Industries via Partial Cross Mapping Under the Background of COVID-19
Computational Economics (2024)
-
Monitoring global carbon emissions in 2022
Nature Reviews Earth & Environment (2023)
-
A Review on CO2 Sequestration: The Indian Scenario
Journal of the Geological Society of India (2023)
