
Abstract
Tumour cells exhibit greater metabolic plasticity than normal cells and possess selective advantages for survival and proliferation with unclearly defined mechanisms. Here we demonstrate that glucose deprivation in normal hepatocytes induces PERK-mediated fructose-1,6-bisphosphatase 1 (FBP1) S170 phosphorylation, which converts the FBP1 tetramer to monomers and exposes its nuclear localization signal for nuclear translocation. Importantly, nuclear FBP1 binds PPARα and functions as a protein phosphatase that dephosphorylates histone H3T11 and suppresses PPARα-mediated β-oxidation gene expression. In contrast, FBP1 S124 is O-GlcNAcylated by overexpressed O-linked N-acetylglucosamine transferase in hepatocellular carcinoma cells, leading to inhibition of FBP1 S170 phosphorylation and enhancement of β-oxidation for tumour growth. In addition, FBP1 S170 phosphorylation inversely correlates with β-oxidation gene expression in hepatocellular carcinoma specimens and patient survival duration. These findings highlight the differential role of FBP1 in gene regulation in normal and tumour cells through direct chromatin modulation and underscore the inactivation of its protein phosphatase function in tumour growth.
This is a preview of subscription content, access via your institution
Access options
Access Nature and 54 other Nature Portfolio journals
Get Nature+, our best-value online-access subscription
$29.99 / 30 days
cancel any time
Subscribe to this journal
Receive 12 print issues and online access
$209.00 per year
only $17.42 per issue
Buy this article
- Purchase on Springer Link
- Instant access to full article PDF
Prices may be subject to local taxes which are calculated during checkout


Data availability
ChIP–seq data that support the findings of this study have been deposited in the Gene Expression Omnibus (GEO) under accession codes GSE207844. The human HCC data were derived from the TCGA Research Network: http://xena.ucsc.edu/. The dataset derived from this resource that supports the findings of this study is available in the following link: https://xenabrowser.net/datapages/?dataset=TCGA.LIHC.sampleMap%2FHiSeqV2&host=https%3A%2F%2Ftcga.xenahubs.net&removeHub=https%3A%2F%2Fxena.treehouse.gi.ucsc.edu%3A443. All other data supporting the findings of this study are available from the corresponding author on reasonable request. Source data are provided with this paper.
References
Li, X., Egervari, G., Wang, Y., Berger, S. L. & Lu, Z. Regulation of chromatin and gene expression by metabolic enzymes and metabolites. Nat. Rev. Mol. Cell Biol. 19, 563–578 (2018).
Sivanand, S., Viney, I. & Wellen, K. E. Spatiotemporal control of acetyl-CoA metabolism in chromatin regulation. Trends Biochem. Sci. 43, 61–74 (2018).
Wang, Y. et al. KAT2A coupled with the α-KGDH complex acts as a histone H3 succinyltransferase. Nature 552, 273–277 (2017).
Xu, D. et al. The evolving landscape of noncanonical functions of metabolic enzymes in cancer and other pathologies. Cell Metab. 33, 33–50 (2021).
Lu, Z. & Hunter, T. Metabolic kinases moonlighting as protein kinases. Trends Biochem. Sci. 43, 301–310 (2018).
Dasgupta, S. et al. Metabolic enzyme PFKFB4 activates transcriptional coactivator SRC-3 to drive breast cancer. Nature 556, 249–254 (2018).
Xu, D. et al. The gluconeogenic enzyme PCK1 phosphorylates INSIG1/2 for lipogenesis. Nature 580, 530–535 (2020).
Liu, R. et al. Choline kinase α 2 acts as a protein kinase to promote lipolysis of lipid droplets. Mol. Cell 81, 2722–2735 e2729 (2021).
Pao, L. I., Badour, K., Siminovitch, K. A. & Neel, B. G. Nonreceptor protein-tyrosine phosphatases in immune cell signaling. Annu Rev. Immunol. 25, 473–523 (2007).
Tonks, N. K. Protein tyrosine phosphatases: from genes, to function, to disease. Nat. Rev. Mol. Cell Biol. 7, 833–846 (2006).
Tejwani, G. A. Regulation of fructose-bisphosphatase activity. Adv. Enzymol. Relat. Areas Mol. Biol. 54, 121–194 (1983).
Huangyang, P. et al. Fructose-1,6-bisphosphatase 2 inhibits sarcoma progression by restraining mitochondrial biogenesis. Cell Metab. 31, 174–188 e177 (2020).
Li, B. et al. Fructose-1,6-bisphosphatase opposes renal carcinoma progression. Nature 513, 251–255 (2014).
Li, F. et al. FBP1 loss disrupts liver metabolism and promotes tumorigenesis through a hepatic stellate cell senescence secretome. Nat. Cell Biol. 22, 728–739 (2020).
Liao, K. et al. A feedback circuitry between polycomb signaling and fructose-1, 6-bisphosphatase enables hepatic and renal tumorigenesis. Cancer Res. 80, 675–688 (2020).
Li, X., Qian, X. & Lu, Z. Local histone acetylation by ACSS2 promotes gene transcription for lysosomal biogenesis and autophagy. Autophagy 13, 1790–1791 (2017).
Yang, W. et al. ERK1/2-dependent phosphorylation and nuclear translocation of PKM2 promotes the Warburg effect. Nat. Cell Biol. 14, 1295–1304 (2012).
Ke, H. M., Zhang, Y. P. & Lipscomb, W. N. Crystal structure of fructose-1,6-bisphosphatase complexed with fructose 6-phosphate, AMP, and magnesium. Proc. Natl Acad. Sci. USA 87, 5243–5247 (1990).
Slawson, C. & Hart, G. W. O-GlcNAc signalling: implications for cancer cell biology. Nat. Rev. Cancer 11, 678–684 (2011).
Ferrer, C. M., Sodi, V. L. & Reginato, M. J. O-GlcNAcylation in cancer biology: linking metabolism and signaling. J. Mol. Biol. 428, 3282–3294 (2016).
Fan, W. & Evans, R. PPARs and ERRs: molecular mediators of mitochondrial metabolism. Curr. Opin. Cell Biol. 33, 49–54 (2015).
McKenna, N. J., Lanz, R. B. & O’Malley, B. W. Nuclear receptor coregulators: cellular and molecular biology. Endocr. Rev. 20, 321–344 (1999).
Mukherji, A., Kobiita, A. & Chambon, P. Shifting the feeding of mice to the rest phase creates metabolic alterations, which, on their own, shift the peripheral circadian clocks by 12 hours. Proc. Natl Acad. Sci. USA 112, E6683–E6690 (2015).
Choe, J.-Y., Fromm, H. J. & Honzatko, R. B. Crystal structures of fructose 1,6-bisphosphatase: mechanism of catalysis and allosteric inhibition revealed in product complexes. Biochemistry 39, 8565–8574 (2000).
Rossetto, D., Avvakumov, N. & Cote, J. Histone phosphorylation: a chromatin modification involved in diverse nuclear events. Epigenetics 7, 1098–1108 (2012).
Denu, J. M., Stuckey, J. A., Saper, M. A. & Dixon, J. E. Form and function in protein dephosphorylation. Cell 87, 361–364 (1996).
Walton, K. M. & Dixon, J. E. Protein tyrosine phosphatases. Annu. Rev. Biochem. 62, 101–120 (1993).
Metzger, E. et al. Phosphorylation of histone H3 at threonine 11 establishes a novel chromatin mark for transcriptional regulation. Nat. Cell Biol. 10, 53–60 (2008).
Yang, W. et al. PKM2 phosphorylates histone H3 and promotes gene transcription and tumorigenesis. Cell 150, 685–696 (2012).
Yang, W. & Lu, Z. Nuclear PKM2 regulates the Warburg effect. Cell Cycle 12, 3154–3158 (2013).
Carracedo, A., Cantley, L. C. & Pandolfi, P. P. Cancer metabolism: fatty acid oxidation in the limelight. Nat. Rev. Cancer 13, 227–232 (2013).
Corbet, C. & Feron, O. Cancer cell metabolism and mitochondria: nutrient plasticity for TCA cycle fueling. Biochim. Biophys. Acta 1868, 7–15 (2017).
Du, L. et al. β-Catenin induces transcriptional expression of PD-L1 to promote glioblastoma immune evasion. J. Exp. Med. https://doi.org/10.1084/jem.20191115 (2020).
Qian, X. et al. Conversion of PRPS hexamer to monomer by AMPK-mediated phosphorylation inhibits nucleotide synthesis in response to energy stress. Cancer Discov. 8, 94–107 (2018).
Qian, X. et al. PTEN suppresses glycolysis by dephosphorylating and inhibiting autophosphorylated PGK1. Mol. Cell 76, 516–527 e517 (2019).
Qian, X. et al. KDM3A senses oxygen availability to regulate PGC-1α-mediated mitochondrial biogenesis. Mol. Cell 76, 885–895 e887 (2019).
Olsson, M. H., Sondergaard, C. R., Rostkowski, M. & Jensen, J. H. PROPKA3: consistent treatment of internal and surface residues in empirical pKa predictions. J. Chem. Theory Comput. 7, 525–537 (2011).
Maier, J. A. et al. ff14SB: improving the accuracy of protein side chain and backbone parameters from ff99SB. J. Chem. Theory Comput. 11, 3696–3713 (2015).
Li, X. et al. Nuclear PGK1 alleviates ADP-dependent inhibition of CDC7 to promote DNA replication. Mol. Cell https://doi.org/10.1016/j.molcel.2018.09.007 (2018).
Zheng, Y. et al. Secreted and O-GlcNAcylated MIF binds to the human EGF receptor and inhibits its activation. Nat. Cell Biol. 17, 1348–1355 (2015).
Zheng, Y. et al. Ras-induced and extracellular signal-regulated kinase 1 and 2 phosphorylation-dependent isomerization of protein tyrosine phosphatase (PTP)-PEST by PIN1 promotes FAK dephosphorylation by PTP-PEST. Mol. Cell. Biol. 31, 4258–4269 (2011).
Xu, D. et al. The protein kinase activity of fructokinase A specifies the antioxidant responses of tumor cells by phosphorylating p62. Sci. Adv. 5, eaav4570 (2019).
Zhao, Z. et al. Hepatic PPARα function is controlled by polyubiquitination and proteasome-mediated degradation through the coordinated actions of PAQR3 and HUWE1. Hepatology 68, 289–303 (2018).
Lee, J. H. et al. EGFR-phosphorylated platelet isoform of phosphofructokinase 1 promotes PI3K activation. Mol. Cell 70, 197–210 e197 (2018).
Li, X. et al. Nucleus-translocated ACSS2 promotes gene transcription for lysosomal biogenesis and autophagy. Mol. Cell 66, 684–697 e689 (2017).
McDonagh, B., Sakellariou, G. K., Smith, N. T., Brownridge, P. & Jackson, M. J. Differential cysteine labeling and global label-free proteomics reveals an altered metabolic state in skeletal muscle aging. J. Proteome Res 13, 5008–5021 (2014).
Guan, K. L. & Dixon, J. E. Evidence for protein-tyrosine-phosphatase catalysis proceeding via a cysteine-phosphate intermediate. J. Biol. Chem. 266, 17026–17030 (1991).
Yang, W. et al. Nuclear PKM2 regulates β-catenin transactivation upon EGFR activation. Nature 480, 118–122 (2011).
Li, X. et al. A splicing switch from ketohexokinase-C to ketohexokinase-A drives hepatocellular carcinoma formation. Nat. Cell Biol. 18, 561–571 (2016).
Acknowledgements
This study was supported by grants from the Ministry of Science and Technology of the People’s Republic of China (2021YFA0805600, D.X.; 2020YFA0803300, Z.L.), the National Natural Science Foundation of China (92157113 and 82072630, D.X.; 82173114, Z.W.; 82188102 and 82030074, Z.L.), Zhejiang Natural Science Foundation Discovery Project (LQ22H160023, Z.W.), Zhejiang Natural Science Foundation Key Project (LD22H160002, D.X.; LD21H160003, Z.L.), the Zhejiang University Research Fund (188020*194221901/029, Z.L.), and the Leading Innovative and Entrepreneur Team Introduction Program of Zhejiang (2019R01001, Z.L.). Z.L. is the Kuancheng Wang Distinguished Chair. The authors received no specific funding for this work.
Author information
Authors and Affiliations
Contributions
Z.L. conceptualized protein phosphatase activity of metabolic enzymes. Z.L. and D.X. conceived and designed the study and wrote the manuscript; Z.W., D.X. and Z.L. acquired the funding support and supervised the study; Z.W., M.L., S.L., F.S., H.H., Y.D., K.W., L.W., G.J., Y.S., L.L., P.Z. and B.D. performed the experiments and statistical analysis. Y.X., X.Q., D.G., J.F. and M.Z. reviewed and edited the manuscript; M. Yang, H.J., X.R., R.Y. and H.L. performed the peptide and protein docking analysis. M. Yan, T. Liu and T. Liang provided the HCC samples and support for IHC staining.
Corresponding authors
Ethics declarations
Competing interests
Z.L. owns shares in Signalway Biotechnology (Pearland, TX), which supplied the rabbit antibodies that recognize FBP1 pS170. Z.L.’s interest in this company had no bearing on its being chosen to supply these reagents. The remaining authors declare no competing interests.
Peer review
Peer review information
Nature Cell Biology thanks Lars Zender and the other, anonymous, reviewer(s) for their contribution to the peer review of this work.
Additional information
Publisher’s note Springer Nature remains neutral with regard to jurisdictional claims in published maps and institutional affiliations.
Extended data
Extended Data Fig. 1 PERK activation promotes the nuclear translocation of FBP1 under glucose deprivation conditions in normal human hepatocytes.
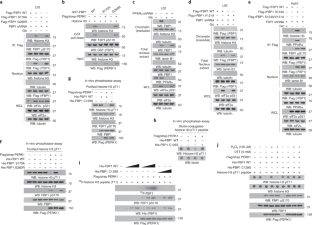
b–f, Immunoblotting analyses were performed with the indicated antibodies. (a) L02 cells expressing Flag-FBP1 or Flag-FBP2 were treated with or without glucose deprivation for 2 h. Immunofluorescence and DAPI staining were performed (upper). The nuclear distribution intensity of FBP1/2 upon glucose deprivation is shown (lower). At least n = 50 cells from each independent experiment were analyzed, and representative data are shown. Data are the mean ± SD, **P < 0.0001 by two-tailed Student t test. (b) L02 cells expressing Flag-FBP1 or Flag-FBP2 were treated with or without glucose deprivation for 2 h. Nuclear fractions were prepared. (c) L02 cells were pretreated with or without GSK2656157 (10 μM), SP600125 (20 μM), or SB203580 (10 μM) for 30 min before treated with or without glucose deprivation for 2 h. Nuclear fractions were prepared. SP600125, SB203580, and GSK2656157 blocked c-Jun N-terminal kinases (JNKs)-phosphorylated c-Jun, p38-phosphorylated MAP kinase-activated protein kinase 2 (MAPK/APK2), and PERK-phosphorylated eIF2α, respectively. (d) MEFs with or without PERK1/2 knockout were treated with or without 2-DG (25 mM) for 2 h. Nuclear fractions were prepared. (e) L02 cells expressing Flag-PERK1 WT or the K622A kinase-dead mutant were treated with or without glucose deprivation for 2 h. Nuclear fractions were prepared. (f) L02 cells expressing Flag-PERK1 WT or the K622A kinase-dead mutant were treated with or without 2-DG (25 mM) for 2 h. Nuclear fractions were prepared. All experiments were repeated three times independently with similar results.
Extended Data Fig. 2 FBP1 pS170 by PERK disassembles FBP1 tetramer and exposes the NLS.
a, d, g, h, k, Immunoblotting analyses were performed with the indicated antibodies. (a) L02 cells expressing Flag-PERK1 were treated with or without glucose deprivation (2 h) or 2-DG (25 mM, 2 h). Immunoprecipitation analyses with an anti-Flag antibody were performed. (b) An in vitro phosphorylation assay was performed by mixing purified PERK1 and purified His-FBP1. Liquid chromatography-tandem mass spectrometry/mass spectrometry (LC-MS/MS) analyses of a tryptic fragment at m/z 675.24536 Da (+3.44 mmu/+5.1 ppm), which was matched with the +1 charged peptide 169-GSATML-174 of FBP1, suggested that FBP1 Ser 170 was phosphorylated. The XCorr score was 1.81. (c) FBP1 S170 peptide sequences from different species were aligned. (d, e) L02 cells expressing Flag-FBP1 were treated with or without glucose deprivation for 2 h (d). Immunoblotting analyses (d) and immunohistochemical (IHC) analyses of HCC tissue (d) with an anti-FBP1 pS170 antibody were performed in the presence or absence of a peptide that blocked the phosphorylation of S170. (f) Flag-streptavidin -PERK1 WT and K622A purified from Huh7 cells were analyzed by SDS-PAGE. (g) L02 cells were treated with glucose deprivation for the indicated period of time in the presence or absence of GSK2656157 (10 μM). (h, i, k) L02 cells expressing the indicated Flag-FBP1 proteins were treated with or without 2-DG (25 mM) for 2 h. Nuclear fractions were prepared (h, k). Immunofluorescence and DAPI staining (i) was performed (left). The nuclear distribution intensity of FBP1 upon 2-DG treatment is shown (right). At least n = 50 cells from each independent experiment were analyzed, and representative data are shown. Data are the mean ± SD, **P < 0.0001 by two-tailed Student t test. (j) Amino acids 17–30 of FBP1 from different species were aligned. (l) The NLS in box is buried in the interface of the dimers of the FBP1 tetramer. S106 is shown in white box. (m) The molecular weight calibration standard was established for size-exclusion chromatography analysis.
Extended Data Fig. 3 Overexpressed OGT in HCC cells inhibits O-GlcNAcylation and nuclear translocation of FBP1.
a-d, f, g, i-k, Immunoblotting analyses were performed with the indicated antibodies. (a) L02 and Huh7 cells expressing Flag-rFBP1 were treated with or without glucose deprivation for 2 h. Nuclear fractions were prepared. (b) THLE-2 and Hep3B cells expressing Flag-rFBP1 were treated with or without glucose deprivation for 2 h. Nuclear fractions were prepared. (c) L02 and Huh7 cells expressing Flag-rFBP1 were treated with or without 2-DG (25 mM) for 2 h. Nuclear fractions were prepared. (d) THLE-2 and Hep3B cells expressing Flag-rFBP1 were treated with or without 2-DG (25 mM) for 2 h. Nuclear fractions were prepared. (e) Selected peptide hits of FBP1 immunoprecipitants of Huh7 cells identified through mass spectrometry are shown. (f) L02, THLE-2, Hep3B and Huh7 cells expressing Flag-rFBP1 were harvested for immunoprecipitation analysis. (g) Huh7 cells expressing Flag-FBP1 were treated with or without glucose deprivation or 2-DG (25 mM) for 2 h. Immunoprecipitation and immunoblotting analyses with the indicated antibodies were performed. (h) A TCGA dataset was used to analyze OGT expression levels in normal liver tissues and HCC tissues. Normal samples: minimum, 8.9311; maximum, 11.1164; and median 10.11875; HCC samples: minimum, 8.9688; maximum, 12.8082; and median, 10.7801. The horizontal lines mark the median, the box limits indicate the 25th and 75th percentiles. Statistical analyses were performed using a two-tailed unpaired Student’s t test. P < 0.001. (i) Immunoblotting analyses of the indicated cell lines were performed with the indicated antibodies. (j) Hep3B cells expressing OGT shRNA were treated with or without glucose deprivation for 2 h. Nuclear fractions were prepared. Immunoblotting analyses were performed with the indicated antibodies. (k) THLE-2 cells expressing Myc-OGT were treated with or without glucose deprivation for 2 h. Nuclear fractions were prepared. All experiments were repeated three times independently with similar results.
Extended Data Fig. 4 OGT-mediated FBP1 S124 O-GlcNAcylation in HCC cells inhibits nuclear translocation of FBP1.
c–f, Immunoblotting analyses were performed with the indicated antibodies. (a) An in vitro O-GlcNAcylation assay was performed by mixing purified OGT with purified His-FBP1 proteins. LC-MS/MS analyses suggested that S124 was O-GlcNAcylated. Mass spectrometric analysis of a tryptic fragment at m/z 795.33734 Da (+0.67 mmu/+0.85 ppm), which was matched with the +1 charged peptide 122-DGSSNI-127, suggested that FBP1 Ser 124 was O-GlcNAcylated. The XCorr score was 1.46. (b) FBP1 S124 peptide sequences from different species were aligned. (c) The indicated Flag-FBP1 proteins were expressed in Huh7 and Hep3B cells. Immunoprecipitation and immunoblotting analyses with the indicated antibodies were performed as indicated. (d) L02 cells expressing the indicated Flag-rFBP1 proteins and/or Myc-OGT were treated with or without glucose deprivation for 2 h. Immunoprecipitation and immunoblotting analyses with the indicated antibodies were performed as indicated. (e) L02 cells expressing the indicated Flag-rFBP1 proteins and/or Myc-OGT were treated with or without 2-DG (25 mM) for 2 h. Immunoprecipitation and immunoblotting analyses with the indicated antibodies were performed as indicated. (f) Huh7 cells expressing the indicated Flag-rFBP1 proteins were treated with or without 2-DG (25 mM) for 2 h. Nuclear fractions were prepared. Immunoprecipitation and immunoblotting analyses with the indicated antibodies were performed as indicated. All experiments were repeated three times independently with similar results.
Extended Data Fig. 5 PERK-phosphorylated FBP1 interacts with PPARα.
c-n, p, q, Immunoblotting or/and immunoprecipitation analyses were performed with the indicated antibodies. (a) L02 and Huh7 cells expressing Flag-FBP1 were treated with or without glucose deprivation for 2 h. An immunoprecipitation assay was performed using anti-Flag antibody, and immunoprecipitates of Flag-FBP1 were eluted with Flag peptide, separated using SDS–PAGE, and stained with Coomassie Brilliant Blue. (b) Selected peptide hits of FBP1 immunoprecipitants of L02 cells identified through mass spectrometry are shown. (c) THLE-2 and Hep3B cells expressing Flag-FBP1 (c) or MEFs with or without PERK1/2 knockout (d) were treated with or without glucose deprivation for 2 h. (e, f, g) L02 (e) or Huh7 (g) cells with endogenous FBP1 depletion and reconstituted expression of the indicated Flag-rFBP1 proteins were constructed. The indicated L02 cells were treated with or without glucose deprivation for 2 h. Nuclear fractions were prepared (f). (h, i) L02 cells expressing the indicated Flag-FBP1 proteins were treated with or without glucose deprivation for 2 h. (j, q) An in vitro kinase assay was performed by mixing purified PERK1 with the indicated bacterially purified GST-FBP1 proteins in the presence of ATP for 1 h. The PBS-washed GST-FBP1-conjugated beads were incubated with the indicated purified His-PPARα followed by a GST pull-down assay. (k, l) Endogenous FBP1-depleted Huh7 (k) or L02 (l) cells with reconstituted expression of the indicated Flag-FBP1 proteins were constructed. (m) L02 cells with depleted endogenous FBP1 and reconstituted expression of the indicated Flag-FBP1 proteins were treated with or without glucose deprivation for 2 h. (n) L02 cells were pretreated with or without GSK2656157 (10 μM) for 30 min before treated with or without glucose deprivation for 2 h. (o) Computationally determined binding mode of the FBP1 (cartoon in gray) bound with PPARα (surface in cyan). The V131 at FBP1 is shown in green, and residues from PPARα are shown in magenta. (p) L02 cells transfected with the indicated plasmids were treated with or without glucose deprivation for 2 h.
Extended Data Fig. 6 Nuclear FBP1 inhibits PPARα-mediated β-oxidation.
b,d, Immunoblotting analyses were performed with the indicated antibodies. (a-f) The data represent the mean ± SD of 3 independent experiments. *P < 0.01; **P < 0.001; ***P < 0.0001 by two-tailed Student t test; N.S.: not significant by two-tailed Student t test. (a-d) Huh7 (a) or L02 (b, c) cells with depleted endogenous FBP1 and reconstituted expression of the indicated Flag-rFBP1 proteins in the absence (a, c, d) or presence (b) of expression of β-galactosidase and an PPRE-driven luciferase reporter were treated with or without low glucose (0.5 mM) for 12 h (a–c). The relative mRNA levels of the indicated genes were determined (a, c). The relative PPRE luciferase activity is shown (n = 6) (b). The indicated cells were cultured with 13C-oleic acid for 12 h and treated with or without glucose deprivation for 2 h. The amounts of 13C-oleic acid-derived 13C2-citrate and 13C2-succinate were determined by mass spectrometry analyses (d). (e, f) Oxygen consumption rates (OCR) in Huh7 (e) or L02 (f) cells with depleted endogenous FBP1 and reconstituted expression of the indicated Flag-rFBP1 proteins were measured. (g) L02 cells were treated with glucose deprivation for 4 h. ChIP analysis were performed. Peak visualization of selected FBP1- and PPARα-associated gene regions using Integrated Genome Browser software was shown. (h) The binding sites of FBP1 and PPARα were divided into a series of bins with a size of 10 kb for each. The peak score of each bin was calculated and converted to the natural logarithm of (score + 1). The scatter plot was drawn to show the correlation between paired peak scores (from FBP1 ChIP-seq and PPARα ChIP-seq) of these bins. R is the Pearson’s correlation coefficient. (i) Alignment of the highest ranked de novo binding motif found within +/−50 bp of FBP1 (top) or PPARα (bottom) ChIP peak positions. (j) Mitochondrial and peroxisomal β-oxidation genes in L02 cells with glucose deprivation for 2 h were substantially enriched in the FBP1-targeted gene set. P-values were calculated by hypergeometic test. All experiments were repeated three times independently with similar results.
Extended Data Fig. 7 FBP1 dephosphorylates H3 pT11.
a, b, g, j, k, Immunoblotting or/and immunoprecipitation analyses were performed with the indicated antibodies. (a, b) An in vitro kinase assay was performed by mixing purified PERK1 with the indicated purified His-FBP1 proteins in the presence of ATP for 1 h. The PBS-washed His-FBP1-conjugated beads were incubated with purified histone H3 immunoprecipitated with the indicated anti-phospho-histone antibodies from Huh7 cells (a) or histone H3 pT11 peptides (b) for an in vitro dephosphorylation assay. (c) Enzymatic kinetic plot of purified S170-phosphorylated FBP1 toward synthesized histone H3 pT11 peptide. (d, e) Molecular dynamic simulation and docking analyses of FBP1 with or without S170 phosphorylation revealed altered FBP1 structure (d) and the docking of a histone H3 pT11 peptide into the catalytic domain of S170-phosphorylated FBP1. Phosphorylated T11 is in close proximity to FBP1 C129 (e). (f) The relative gluconeogenetic activities of the indicated purified FBP1 proteins were measured. The data represent the mean ± SD of 3 independent experiments. ***P < 0.0001. NS: not significant by two-tailed Student t test. (g) Purified GST-PRK1 (left) or His-PKM2 proteins (right) were incubated with histone H3 peptides in the presence of [γ-32P] ATP. Autoradiography analyses were performed. (h) Workflow to detect a covalent FBP1 phospho-cysteine intermediate during histone pT11 peptide catalysis. (i) PERK1-phosphorylated WT or C129S mutant of FBP1 was labeled with or without 25 mM NEM for 30 min before mass spectrometry analyses. Representative extracted chromatograms and fragmentation of peptide were shown. Tryptic fragments at m/z 533.94934 Da (+4.52 mmu/ +8.46 ppm) (left), 834.42633 Da (−0.39 mmu/−0.46 ppm) (middle), and 763.91479 Da (+0.5 mmu/+0.65 ppm) (right) were matched with +3 charged (left), +2 charged (middle), +2 charged (right) 128-DSLVSVGTIFGIYR-141 peptide with NEM-unlabeled Cys129 (Mascot score: 25) (left), NEM-labeled Cys129 (Mascot score: 83) (middle), and NEM-unlabeled C129S (Mascot score: 90) (right), respectively. (j, k) L02 (j) or Huh7 (k) cells with endogenous FBP1 depletion and reconstituted expression of the indicated Flag-rFBP1 proteins were analyzed. (l) A diagram displays the indicated FBP1 mutants and their functional changes. All experiments were repeated three times independently with similar results.
Extended Data Fig. 8 Suppressed FBP1 protein phosphatase activity promotes tumor cell survival and liver tumor growth.
a-c, h, j, k, l, m, Immunoblotting and IHC analyses were performed with the indicated antibodies. (c, d-g, I, k) The data represent the mean ± SD of 3 independent experiments. *P < 0.01, **P < 0.001; ***P < 0.0001; N.S.: not significant by two-tailed Student t test. (a, b) Huh7 (a) or L02 (b) cells with endogenous FBP1 depletion and reconstituted expression of the indicated Flag-rFBP1 proteins were treated with low glucose (0.5 mM) for 24 h. (c–g) Huh7 cells with endogenous FBP1 depletion and reconstituted expression of the indicated Flag-rFBP1 proteins were treated with or without low glucose (0.5 mM) and GW9578 (500 nM) for 24 h to examine apoptosis (c) or subcutaneously injected into athymic BALB/c nude mice (n = 6 per group) (d–g). The tumor sizes (d), volumes (e), and weights (f) were determined. A TUNEL assay was performed (g). Apoptotic cells in 10 microscope fields were quantified. (h, j) IHC analyses of the tumor tissues were performed. The representative images are shown. The regions in white boxes are shown at higher magnification on the right (h). (i) Huh7 cells with and without PPARα depletion was subcutaneously injected into athymic BALB/c nude mice (n = 6 per group) (left). The tumor sizes (middle) and volumes (right) were calculated. (k) IHC staining of 30 human HCC and matched non-tumor tissue samples was performed. Representative images of two cases are shown. The regions in white boxes are shown at higher magnification below. The indicated IHC staining scores of HCC and matched non-tumor liver samples were compared using Mann-Whitney U Test (two-tailed). (l, m) Immunoblotting analyses of representative two cases of human HCC with matched non-tumor tissue samples (l) or four different HCC samples (m) were performed. (n) IHC staining of human HCC samples with the indicated antibodies was scored, and correlation analyses were performed. A Pearson correlation test was used (two-tailed) (n = 40). Note that the scores for some samples overlap. Experiments were repeated at least twice independently with similar results.
Supplementary information
Supplementary Table
Supplementary Tables 1–5.
Source data
Source Data Fig. 1
Unprocessed WBs.
Source Data Fig. 1
Statistical source data.
Source Data Fig. 2
Unprocessed WBs.
Source Data Fig. 3
Unprocessed WBs.
Source Data Fig. 3
Statistical source data.
Source Data Fig. 4
Unprocessed WBs.
Source Data Fig. 4
Statistical source data.
Source Data Fig. 5
Unprocessed WBs.
Source Data Fig. 6
Statistical source data.
Source Data Fig. 7
Statistical source data.
Source Data Extended Data Fig. 1
Unprocessed WBs.
Source Data Extended Data Fig. 1
Statistical source data for Extended Data Fig. 1.
Source Data Extended Data Fig. 2
Unprocessed WBs.
Source Data Extended Data Fig. 2
Statistical source data for Extended Data Fig. 2.
Source Data Extended Data Fig. 3
Unprocessed WBs.
Source Data Extended Data Fig. 4
Unprocessed WBs.
Source Data Extended Data Fig. 5
Unprocessed WBs.
Source Data Extended Data Fig. 6
Unprocessed WBs.
Source Data Extended Data Fig. 6
Statistical source data for Extended Data Fig. 6.
Source Data Extended Data Fig. 7
Unprocessed WBs.
Source Data Extended Data Fig. 7
Statistical source data for Extended Data Fig. 7.
Source Data Extended Data Fig. 8
Unprocessed WBs.
Source Data Extended Data Fig. 8
Statistical source data for Extended Data Fig. 8.
Rights and permissions
Springer Nature or its licensor holds exclusive rights to this article under a publishing agreement with the author(s) or other rightsholder(s); author self-archiving of the accepted manuscript version of this article is solely governed by the terms of such publishing agreement and applicable law.
About this article

Cite this article
Wang, Z., Li, M., Jiang, H. et al. Fructose-1,6-bisphosphatase 1 functions as a protein phosphatase to dephosphorylate histone H3 and suppresses PPARα-regulated gene transcription and tumour growth. Nat Cell Biol 24, 1655–1665 (2022). https://doi.org/10.1038/s41556-022-01009-4
Received:
Accepted:
Published:
Issue Date:
DOI: https://doi.org/10.1038/s41556-022-01009-4
This article is cited by
-
METTL3 and METTL14-mediated N6-methyladenosine modification of SREBF2-AS1 facilitates hepatocellular carcinoma progression and sorafenib resistance through DNA demethylation of SREBF2
Scientific Reports (2024)
-
Fructose-1,6-bisphosphatase 1 dephosphorylates and inhibits TERT for tumor suppression
Nature Chemical Biology (2024)
-
AMPK-HIF-1α signaling enhances glucose-derived de novo serine biosynthesis to promote glioblastoma growth
Journal of Experimental & Clinical Cancer Research (2023)
-
Mesenchymal stem cells under epigenetic control – the role of epigenetic machinery in fate decision and functional properties
Cell Death & Disease (2023)
-
Repurposing FBP1: dephosphorylating IκBα to suppress NFκB
Cell Research (2023)
