
Abstract
Current microbiological water safety testing methods are not feasible in many settings because of laboratory, cost, and other constraints, particularly in low-income countries where water quality monitoring is most needed to protect public health. We evaluated two promising E. coli methods that may have potential in at-scale global water quality monitoring: a modified membrane filtration test followed by incubation on pre-prepared plates with dehydrated culture medium (CompactDryTM), and 10 and 100 ml presence–absence tests using the open-source Aquatest medium (AT). We compared results to membrane filtration followed by incubation on MI agar as the standard test. We tested 315 samples in triplicate of drinking water in Bangalore, India, where E. coli counts by the standard method ranged from non-detect in 100 ml samples to TNTC (>200). Results suggest high sensitivity and specificity for E. coli detection of candidate tests compared with the standard method: sensitivity and specificity of the 100 ml AT test was 97% and 96% when incubated for 24 h at standard temperature and 97% and 97% when incubated 48 h at ambient temperatures (mean: 27 °C). Sensitivity and specificity of the CompactDryTM test was >99 and 97% when incubated for 24 h at standard temperature and >99 and 97% when incubated 48 h at ambient temperatures. Good agreement between these candidate tests compared with the reference method suggests they are suitable for E. coli monitoring to indicate water safety.
Introduction
Water quality monitoring has the potential to serve as a critical feedback mechanism to support the development and operation of safe water supplies that promote public health1. In many settings, particularly in low- and middle-income countries (LMICs), water quality testing may be limited because the available methods for microbiological testing require dedicated hygienic laboratory space, specialized and expensive equipment, consumables that may be difficult or costly to source locally, and trained personnel. The resource constraints that limit laboratory testing are, in many cases, co-located with resource constraints that limit water safety. There is a pressing need for simple, scalable microbiological water safety tests that can be used in even the most basic settings by non-experts2,3,4,5.
Simpler, potentially low-cost alternatives to standard membrane filtration assays are now available for detection of Escherichia coli and other faecal indicator bacteria (FIB). Some are supported by systematic comparative testing6,7,8,9. Based on criteria of total cost per test of ≤US$2 per sample and a lower limit of detection of 1 colony-forming unit (cfu) E. coli in 100 ml of drinking-water by culture, we selected two novel assays for evaluation as microbial water safety tests in comparison with EPA Method 1604 (membrane filtration followed by incubation on MI agar)10. Our hypothesis was that candidate low-cost assays could yield E. coli detection data with high (≥90%) specificity and sensitivity compared with the reference test, both under standard and ambient incubation conditions. Such tests may hold promise for global water quality monitoring such as that required in documenting progress toward Sustainable Development Goal (SDG) 6, to “ensure availability and sustainable management of water and sanitation for all”11.
Results
Systematic comparison across methods
For systematic comparison testing between methods, we collected 315 bulk tap water samples, each assayed in triplicate by all methods (n = 945). According to the reference method, the arithmetic mean total coliform count was 70 cfu 100 ml−1 (standard deviation: 82 cfu 100 ml−1) and the arithmetic mean E. coli count was 57 cfu 100 ml−1 (standard deviation 75 cfu 100 ml−1). The range of recorded values was <1 cfu 100 ml−1 to 200 cfu 100 ml−1 as an upper limit of quantification; therefore, computed means using this upper limit are underestimates of the true mean. Approximately 35% of samples met criteria for “safe” (<1 cfu E. coli 100 ml−1) and 26% of samples for “high risk” (101+ cfu E. coli 100 ml−1), according to mean counts from MF-MI.
The proportion of samples positive for both CompactDryTM and the AT 100 ml test are shown in Fig. 1, stratified by log10 E. coli counts in the MF-MI reference assay. We plotted receiver-operator characteristic (ROC) curves comparing these two tests to samples taken at the same time and of the same water and assayed by membrane filtration (MF-MI), to provide a measure of replicability of the standard measure of E. coli in water (Fig. 2). The ROC curves show the diagnostic performance of the CompactDry and AT tests compared to the MF-MI reference method as the detection limit is varied from ≥1 per 100 mL to the upper limit of detection. We then calculated the Area Under the Curve (AUC), a measure of diagnostic performance based on the ROC curves. For both standard and ambient temperature incubation conditions, the AUC estimates for AT exceed 0.97 and 0.99 for CompactDryTM, indicating near-ideal performance compared with the reference method of MF-MI. Tables 1 and 2 provide an overview of test performance characteristics for CompactDryTM and AT assays, respectively. A comparison of results (of individual assays and means of assay replicates) with triplicate means of the reference test is provided in Supplementary Tables 1 and 2.
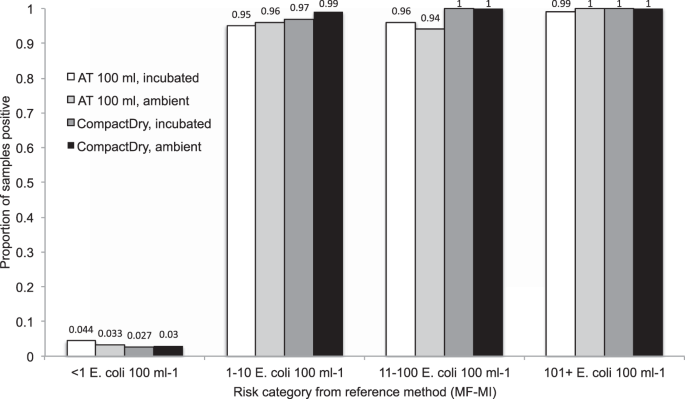
Proportion of samples positive with AT and CompactDry candidate test, incubated at 37 °C for 24 h or ambient temperature for 48 h, stratified by risk category of the reference test (MF-MI).

E. coli ROC curves for candidate tests versus the reference test (MF-MI).
In quantitative estimation, E. coli count estimates from the CompactDryTM method showed good agreement with the reference method across a wide range of values, as seen in raw count data plots (Fig. 3), log10 transformed count data (Fig. 4), and in Bland-Altman plots (Fig. 5). Spearman’s correlation coefficients and Bland-Altman 95% limits of agreement demonstrate that both the ambient temperature and standard incubation conditions yielded consistent agreement between CompactDryTM and MF-MI.

Scatter plot of E. coli count data from a CompactDryTM versus the reference test, incubated; b CompactDryTM versus the reference test, ambient; and c CompactDryTM incubated versus ambient.

Scatter plot of log10 transformed E. coli count data from a CompactDryTM versus the reference test, incubated; b CompactDryTM versus the reference test, ambient; and c CompactDryTM incubated versus ambient.

Bland-Altman plots showing log10-transformed microbial count data for a CompactDryTM versus the reference test, incubated; b CompactDryTM versus the reference test, ambient; and (c) CompactDryTM incubated versus ambient.
For both novel methods, we noted comparable sensitivity and specificity for sample duplicates incubated at ambient temperature in the testing space, generally (Tables 1 and 2), suggesting these ambient temperature conditions would yield equivalent results to standard incubation for these methods.
For 10 ml AT tests, poor sensitivity at both standard and ambient incubation temperatures (51.4 and 51.6%, respectively) suggests that 10 ml tests are not likely to be reliable for detection of E. coli counts at ≥11 cfu 100 ml−1 (the theoretical detection limit for a 10 ml test) when compared to a reference method using 100 ml samples. Among AT 10 ml tests, almost half (49%) of samples were negative when the reference method yielded counts of ≥11 cfu 100 ml−1 (Table 2).
Discussion
The SDGs aim to track global progress in drinking-water safety. SDG global targets include measurement of E. coli in drinking-water sources, a reasonably reliable and widely used indicator of microbiological water safety12,13,14. Current methods for measuring microbial water safety at scale are not feasible, given the specialized training, resources, and facilities required for E. coli assays used in water safety monitoring and regulation in economically rich countries2. New, globally scalable approaches are needed that can provide equivalent water safety information at lower cost where these resources are lacking.
Based on criteria of cost, specificity of culturable E. coli as a target, and ease of use, we identified two novel water quality tests that represent potential for scale in international monitoring programs. These two tests join a suite of available methods that may be suitable to measure progress toward SDG 6.1, which calls for “universal and equitable access to safe and affordable drinking water for all” by 2030. We hypothesized that these methods could yield sensitive and specific estimates of E. coli in drinking water samples compared with an internationally accepted standard method for E. coli enumeration. Overall, our results from the ROC analysis on 945 data points from drinking water sources in Bangalore, India, suggest that both candidate tests, at ambient temperature and standard-temperature incubation, yield comparable estimates for E. coli presence in 100 ml samples. The CompactDryTM method shows good quantitative agreement with MF-MI across risk categories, and both methods provide highly sensitive and specific information on the presence or absence of E. coli in 100 ml sample volumes. Because CompactDryTM requires the use of sterile membrane filtration or another concentration step for any assay volume greater than 1 ml, this method will probably find greatest use in applications where quantitative E. coli counts are the desired endpoint. A presence-absence 100 ml AT assay is likely to be the most efficient and field-ready15 option when quantal (presence-absence) data will suffice.
Our results also demonstrate the importance of using an appropriate volume for adequate sensitivity in quantal tests, as 10 ml was not sufficient for many of the samples tested in this study to yield information consistent with the reference method. Even though a 10 ml test should have a lower limit of detection of 10 cfu 100 ml−1, the performance of 10 ml quantal AT tests was poor in reliably detecting ≥11 cfu 100 ml−1 E. coli (medium or high risk) in drinking water samples. This finding has potential implications for other methods that have been proposed for use in field surveillance, including a similar novel 10 ml E. coli method16 and a 30 ml H2S test17 proposed as lower-cost alternatives to more standard methods. Though these methods may be important tools for rapid surveys and to identify high-risk sources, any test using less than 100 ml assay volume will not be able to yield reliable estimates of drinking water safety at scale where the normative goal remains absence of culturable E. coli in 100 ml samples.
Our results are consistent with and complementary to one recent study comparing the use of AT for E. coli monitoring in environmental waters in Switzerland and Uganda18. This study compared quantitative results from AT with other, more standard tests: IDEXX Colilert-18®, m-TEC, and m-ColiBlue24®. In the previous study, AT showed high sensitivity (≥97%) for E. coli detection compared with reference methods, with an estimated 6% of AT samples being false positives. In our study, sensitivity of 100 ml AT tests was 97.1% among samples at standard incubation temperature and 96.7% under ambient incubation conditions, with 14 (4.2%) and 11 (3.3%) false positives, respectively. A finding that is potentially divergent between the studies, however, relates to performance at ambient temperatures. In Bangalore, where the range of ambient incubation temperatures was 25–30 °C (mean: 27 °C), we observed good agreement between test results at the two temperatures with ambient-temperature plates read at 48 h, concluding that ambient temperature incubation consistent with these conditions would yield comparable E. coli count data. Genter et al.18 reported reduced performance at lower than standard incubation temperatures, though the condition tested was 24 °C with plates counted at 42 h post-inoculation. A comparison of results between these studies suggests that 25 °C may be a minimum recommended threshold for ambient temperature incubation using AT media. If possible, incubation at 37 °C for 24 h is likely to yield optimal results.
Methods
Sample collection and processing
We collected drinking water samples from 14 locations in Peenya, approximately 11 km from the city centre of Bangalore, India. Peenya has a resident population of ~800,000 people and a population density of ~1300 people per square km. We collected water samples from taps at businesses and public taps across an area of 15 km2; all sources were from the mains water supply serving residential, commercial, and industrial areas. We collected samples across 37 non-consecutive sampling days in 2017–2018, typically visiting 10 or fewer tap sources per day. At each sample point, we collected three samples of water totalling ~2000 ml from the tap into sterile Whirl-Pak bags containing sodium thiosulfate. Following collection, samples were placed on ice until microbiological testing by all methods within 5 h of collection. Each sample was tested in triplicate by (1) the standard reference method (MF-MI), (2) the AT presence-absence test (100 and 10 ml volumes), (3) and a modified CompactDryTM test. On each sample day, we ran negative controls of each method using sterile dilution water.
As a standard method and basis for comparison, we measured E. coli in samples by filtering undiluted and diluted samples through 47-mm diameter, 0.45 µm pore size cellulose ester filters in sterile magnetic membrane filter funnels; membranes were incubated on MI agar for 24 h at 35 °C (this method is abbreviated throughout as “MF-MI”). MI agar detects E. coli by cleavage of a chromogenic β-galactoside substrate to detect total coliforms (TC) and a fluorogenic β–glucuronide substrate to detect E. coli, producing distinctive color TC colonies and blue fluorescing E. coli colonies under long-wave UV light at 366 nm19,20,21. Our methods conform to EPA Method 160410, widely used globally as a standard method for detection of E. coli in water. E. coli and TC count data were reported as colony forming units (cfu) per unit volume of water. As the sources tested were drinking water sources, we assayed only 100 ml volumes, assigning an upper limit of quantification of 200 cfu per plate, deeming colonies “too numerous to count” beyond this number (TNTC).
The AT presence-absence E. coli test was developed and piloted as part of a behavior-change randomized controlled trial (RCT) in rural India1. The semi-quantitative test uses the open-source Aquatest (AT) broth medium22 with a resorufin methyl ester chromogen23 (Biosynth AG, Switzerland) and subsequent incubation. Briefly, water samples are measured to 10 and 100 ml volumes using single-use volumetric cylinders containing pre-measured AT medium. Following incubation for 24 h at 37 °C or 48 hat ambient temperature (mean: 27 °C, range 25–30 °C), a color change from yellow-beige to pink-red indicates the presence of E. coli, and the combination of the two containers is used to determine the test result. Results can be interpreted as <1 E. coli per 100 ml (both containers negative, “safe”); 1–10 E. coli per 100 ml (large container positive, small container negative, “unsafe–low to medium risk”); or ≥10 E. coli per 100 ml (small container positive, “unsafe–medium to high risk”).
The CompactDry™ E. coli test (Nissui Pharmaceutical, Japan) used membrane filtration as in Method 160410, except 99 ml of sample water was filtered through the filter and this was placed on a pre-sterilized, single-use plate with dehydrated culture medium. The method allows for straightforward identification of E. coli and total coliforms (TC) via chromogenic media24,25,26. Plates were rehydrated with 1 ml of sample water (for 100 ml sample volume), allowing for computation of cfu per 100 ml. When testing 10 ml samples, 9 ml of sample was filtered and the filter placed on the plate rehydrated with 1 ml of sample water. As in the reference method, the use of a filtration column is necessary, requiring the use of a suction pump, sidearm flask or manifold, and sterile filtration column for each sample. By using inexpensive, single-use, pre-sterilized plates, however, the method does not require the preparation and sterilization of microbiological media or the re-sterilization of plates. Results were recorded after 24 h incubation at 35+/−2 °C and after 48 h at ambient temperature (mean: 27 °C, range 25–30 °C). As for MF-MI, E. coli and TC count data were reported as colony forming units (cfu) per 100 ml sample. Values above 200 cfu were recorded as TNTC and assigned a figure of 200 cfu when used in computing means.
Statistical analysis
We performed each method in triplicate in each bulk tap water sample. Our primary analysis assesses comparability of the methods across all individual replicates in parallel. We also compared data from each candidate test with the arithmetic means of three replicates of the reference test as a “true” value for that sample. We calculated sensitivity, specificity, and positive predictive values for detection of E. coli (≥1 E. coli per 100 ml) in both candidate tests and for both temperatures compared with the reference method.
After entering all data in Excel, we used Stata 16 (StataCorp, College Station, TX, USA) for primary data analysis, with further visualization and calculations in R. Descriptive statistics were used to characterize the water quality testing results from standard-temperature‐ and ambient-temperature-incubated samples using both continuous and categorical data, in unmodified and log10 form. Of particular interest were the correlations between estimates within a priori risk strata for E. coli: <1 cfu 100 ml−1 (very low risk), 1–10 cfu 100 ml−1 (low risk), 11–100 cfu 100 ml−1 (moderate risk), 101+ cfu 100 ml−1 (high risk). These categories are commonly used to indicate levels of waterborne disease risk; existing evidence suggests an association between E. coli counts and diarrheal disease though the correlation may be non-monotonic, weak, and not necessarily always present12,13,14,27.
We used Bland-Altman and scatter plots to visualize results across tests. In data analysis of log10-transformed counts, we replaced non-detects with an integer value of “1” as the lower detection limit in assays. In Bland-Altman plots, we used linear regression to calculate mean differences accounting for replicate samples. To further compare results of candidate tests with the reference method, we used receiver operating characteristic (ROC) curves28. The ROC curves describe how the sensitivity and specificity of CompactDry and AT tests vary as the threshold used to define a positive reference test result increases from ≥1 per 100 ml to the upper limit of detection. Accuracy of a novel assay compared with the standard is measured by the area under the ROC curve (AUC), combining both sensitivity and specificity to evaluate the overall performance of the candidate tests compared with the reference method. We calculated confidence intervals for AUC estimates accounting for clustering of replicates for each water sample29.
Reporting summary
Further information on research design is available in the Nature Research Reporting Summary.
Data availability
All data generated during this study are available at Open Science Framework: https://osf.io/k637w/
References
Trent, M. et al. AccEss To Household Water Quality Information Leads To Safer Water: a cluster randomized controlled trial in india. Environ. Sci. Technol. 52, 5319–5329 (2018).
Bain, R. et al. A summary catalogue of microbial drinking water tests for low and medium resource settings. Int. J. Environ. Res. Public Health 9, 1609–1625 (2012).
Delaire, C. et al. How much will it cost to monitor microbial drinking water quality in sub-Saharan Africa? Environ. Sci. Technol. 51, 5869–5878 (2017).
Khan, S. M. et al. Optimizing household survey methods to monitor the Sustainable Development Goals targets 6.1 and 6.2 on drinking water, sanitation and hygiene: a mixed-methods field-test in Belize. PloS ONE 12, e0189089 (2017).
Wright, J. et al. Water quality laboratories in Colombia: a GIS-based study of urban and rural accessibility. Sci. Total Environ. 485–486, 643–652 (2014).
Wang, A. et al. Household microbial water quality testing in a Peruvian demographic and health survey: evaluation of the compartment bag test for Escherichia coli. Am. J. Tropical Med. Hyg. 96, 970–975 (2017).
Baum, R., Kayser, G., Stauber, C. & Sobsey, M. Assessing the microbial quality of improved drinking water sources: results from the Dominican Republic. Am. J. Tropical Med. Hyg. 90, 121–123 (2014).
Stauber, C., Miller, C., Cantrell, B. & Kroell, K. Evaluation of the compartment bag test for the detection of Escherichia coli in water. J. Microbiol. Methods 99, 66–70 (2014).
Brown, J. et al. Ambient-temperature incubation for the field detection of Escherichia coli in drinking water. J. Appl. Microbiol. 110, 915–923 (2011).
Agency, U. S. E. P. Vol. Publication EPA-821-R-02-024 (USEPA Office of Water (4303T), Washington, D.C., 2002).
WHO/UNICEF. Progress on drinking water, sanitation and hygiene: 2017 update and SDG baselines. doi:Licence: CC BY-NC-SA 3.0 IGO (2017).
Gruber, J. S., Ercumen, A. & Colford, J. M. Jr Coliform bacteria as indicators of diarrheal risk in household drinking water: systematic review and meta-analysis. PLoS ONE 9, e107429 (2014).
Moe, C. L., Sobsey, M. D., Samsa, G. P. & Mesolo, V. Bacterial indicators of risk of diarrhoeal disease from drinking-water in the Philippines. Bull. World Health Organ. 69, 305–317 (1991).
Brown, J. M., Proum, S. & Sobsey, M. D. Escherichia coli in household drinking water and diarrheal disease risk: evidence from Cambodia. Water Sci. Technol. 58, 757–763 (2008).
Rocha-Melogno, L. et al. Rapid drinking water safety estimation in cities: piloting a globally scalable method in Cochabamba, Bolivia. Sci. Total Environ. 654, 1132–1145 (2018).
Loo, A. et al. Development and field testing of low-cost, quantal microbial assays with volunteer reporting as scalable means of drinking water safety estimation. J. Appl. Microbiol. 126, 1944–1954 (2019).
Khush, R. S. et al. H2S as an indicator of water supply vulnerability and health risk in low-resource settings: a prospective cohort study. Am. J. Tropical Med. Hyg. 89, 251–259 (2013).
Franziska Genter, S. J. M., Clair-Caliot, G., Mugume, D. S., Johnston, R. B., Bain, R. E. S. & Timothy, R. J. Evaluation of the novel substrate RUGTM for the detection of Escherichia coli in water from temperate (Zurich, Switzerland) and tropical (Bushenyi, Uganda) field sites. Environ. Sci.: Water Res. Technol. 5, 1082–1091 (2019).
Geissler, K., Manafi, M., Amoros, I. & Alonso, J. L. Quantitative determination of total coliforms and Escherichia coli in marine waters with chromogenic and fluorogenic media. J. Appl. Microbiol. 88, 280–285 (2000).
Manafi, M. & Kneifel, W. [A combined chromogenic-fluorogenic medium for the simultaneous detection of coliform groups and E. coli in water]. Zentralblatt fur Hyg. und Umweltmed. 189, 225–234 (1989).
Manafi, M., Kneifel, W. & Bascomb, S. Fluorogenic and chromogenic substrates used in bacterial diagnostics. Microbiological Rev. 55, 335–348 (1991).
Bain, R. E. et al. Evaluation of an inexpensive growth medium for direct detection of Escherichia coli in temperate and sub-tropical waters. PloS ONE 10, e0140997 (2015).
Magro, G. et al. Synthesis and application of resorufin beta-D-glucuronide, a low-cost chromogenic substrate for detecting Escherichia coli in drinking water. Environ. Sci. Technol. 48, 9624–9631 (2014).
Mizuochi, S. et al. Matrix extension study: validation of the compact dry EC method for enumeration of Escherichia coli and non-E. coli coliform bacteria in selected foods. J. AOAC Int. 99, 451–460 (2016).
Mizuochi, S. et al. Matrix extension study: validation of the compact Dry CF method for enumeration of total coliform bacteria in selected foods. J. AOAC Int. 99, 444–450 (2016).
Mizuochi, S. et al. Matrix extension study: validation of the compact dry TC method for enumeration of total aerobic bacteria in selected foods. J. AOAC Int. 99, 461–468 (2016).
Ercumen, A. et al. Potential sources of bias in the use of Escherichia coli to measure waterborne diarrhoea risk in low-income settings. Tropical Med. Int. Health. 22, 2–11 (2017).
Lasko, T. A., Bhagwat, J. G., Zou, K. H. & Ohno-Machado, L. The use of receiver operating characteristic curves in biomedical informatics. J. Biomed. Inform. 38, 404–415 (2005).
Newson, R. Parameters behind “Nonparametric” Statistics: Kendall’s tau, Somers’ D and Median Differences. Stata J. 2, 45–64 (2002).
Clopper, C. J. & Pearson, E. S. The use of confidence or fiducial limits illustrated in the case of the binomial. Biometrika 26, 404–413 (1934).
Mercaldo, N. D., Lau, K. F. & Zhou, X. H. Confidence intervals for predictive values with an emphasis to case-control studies. Stat. Med. 26, 2170–2183 (2007).
Acknowledgements
Thermo Fisher Scientific (Waltham, MA, USA) provided AT medium for this study. We gratefully acknowledge assistance from Punith Kakaraddi for assistance in field sampling and laboratory analysis.
Author information
Authors and Affiliations
Contributions
JB and RB conceived and designed the study. AB processed all water samples. JB and RB analyzed the data and JB, AB, and RB wrote the manuscript.
Corresponding author
Ethics declarations
Competing interests
The authors declare no competing interests.
Additional information
Publisher’s note Springer Nature remains neutral with regard to jurisdictional claims in published maps and institutional affiliations.
Supplementary information
Rights and permissions
Open Access This article is licensed under a Creative Commons Attribution 4.0 International License, which permits use, sharing, adaptation, distribution and reproduction in any medium or format, as long as you give appropriate credit to the original author(s) and the source, provide a link to the Creative Commons license, and indicate if changes were made. The images or other third party material in this article are included in the article’s Creative Commons license, unless indicated otherwise in a credit line to the material. If material is not included in the article’s Creative Commons license and your intended use is not permitted by statutory regulation or exceeds the permitted use, you will need to obtain permission directly from the copyright holder. To view a copy of this license, visit http://creativecommons.org/licenses/by/4.0/.
About this article

Cite this article
Brown, J., Bir, A. & Bain, R.E.S. Novel methods for global water safety monitoring: comparative analysis of low-cost, field-ready E. coli assays. npj Clean Water 3, 9 (2020). https://doi.org/10.1038/s41545-020-0056-8
Received:
Accepted:
Published:
DOI: https://doi.org/10.1038/s41545-020-0056-8
This article is cited by
-
Multi-model exploration of groundwater quality and potential health risk assessment in Jajpur district, Eastern India
Environmental Geochemistry and Health (2024)
-
Drinking water quality and the SDGs
npj Clean Water (2020)
-
Microbial Indicators of Fecal Pollution: Recent Progress and Challenges in Assessing Water Quality
Current Environmental Health Reports (2020)
