
Abstract
Piped water supplies that deliver water only intermittently serve more than one billion people around the world. Measuring the continuity of these intermittent water supplies (IWS) is necessary for tracking utility performance and understanding the impact on consumers. We compared reporting of IWS continuity between utility benchmarking data on hours of water supply and households’ reports of water outages in piped systems in Peru. Nationally, the estimated population with IWS as reported by households (23–26%) was slightly higher than that reported by utilities (20–21%) from 2010 to 2014. While the national population with IWS was markedly similar between both measures, household- and utility-reported IWS matched in only 2 of the 23 regions of Peru. We examined the influence of varying thresholds of water supply continuity on the results. Our findings highlight a need to reconcile different approaches to monitoring piped water supply continuity.
Introduction
More than one billion people around the world are served with intermittent water supplies (IWS), in which consumers receive water through a piped network for <24 h per day1. IWS can negatively impact water supply infrastructure and result in adverse health effects and higher costs to households due to unsafe water quality, limited water quantities, reliance on alternative sources, and additional expenditures to store, treat, and supplement the intermittently delivered water2,3,4,5,6. Continuity of supply is commonly used as a benchmark of utility performance and a goal to be achieved, with 24 h, 7 days a week of supply (continuous supply) considered the gold standard7,8,9.
Despite the widespread prevalence of IWS and the definition of safely managed water under the sustainable development goals (SDGs), indicating that water should be available when needed, there is no standard method for measuring or reporting piped water continuity10,11. While a piped system is considered an IWS if it regularly provides fewer than 24 h of water supply per day, the hours of supply that utilities provide and consumers receive can vary substantially within the same system and between systems5,7,10. Households near a treatment plant or situated off of a trunk main may receive more hours of supply than those at network extremities, as water may need to flow through the trunk main to reach other areas, and pressures can drop throughout the system from high demand, high elevation, or leakages12,13,14,15. The most systematic collection of data on piped water continuity is collected through the World Bank International Benchmarking Network (IBNET), which asks utilities to report their supply in hours per day. However, many towns and cities have reported in case studies that delivery does not occur daily, a detail that is not captured in IBNET5,7. Furthermore, there is no published guidance on how utilities report these hours—such as, as hours supplied from the source or treatment plant, as received by households, the average across an entire city, or the least hours experienced by households. An alternative approach to collecting data on interruptions in supply is asking households directly; several countries’ Demographic and Health Surveys (DHS) now include questions on water outages, although these are not specific to reporting piped water continuity.
The number of people receiving water intermittently is likely to increase as climate change and rapid urbanization further stress resources for providing drinking water5. While converting from an IWS to a continuous water supply (CWS) is a common overall goal, this goal is likely unattainable in the near-term for many utilities around the world. Utilities, regulators, and international agencies want to measure and track water service performance to monitor progress and develop strategies for improving continuity in intermittent water supplies. To do so, it is necessary to develop a standard method of measuring and accounting for IWS to allow tracking of progress and to better understand between- and within-country and utility variations of performance.
The objective of this research was to compare utility-reported hours of piped water supply with household-reported measures of reliability, with the goal of triangulating water supply continuity in Peru nationally and regionally. Specifically, we drew on water supply continuity data supplied by Peruvian utilities reporting to the IBNET in all regions in Peru, and a sample of households reporting on continuity of piped drinking water supplies through the DHS program for 2010–2014. We developed and tested methods of aligning these two data sources and determined the thresholds at which utility-reported hours of piped water supply most closely match household-reported outages to better understand variability within different regions of Peru. We also used the same methods to compare national results from three other countries.
Results
National comparison
Fifty utilities in Peru reported continuity of supply to IBNET from 2010 to 2014, with reporting utilities covering ~30 million residents. Over that time, water supply coverage (the percent of populations served by these utilities) increased by 6 percentage points (Table 1). The mean hours of supply provided by these utilities was 15.7 h per day (h/day) (SD: 0.7), with mean supply continuity increasing by almost 1 h/day over these 5 years, although this increase was not consistent across all utilities (Supplementary Table S1). Coverage by piped water connections for urban populations in Peru increased from 89 to 91% and for rural populations from 53 and 61% piped from 2010 to 2014 (Supplementary Fig. S1)16,17.
Over the same years, a mean of 24.8% (SD: 1.2%) of households surveyed through the Demographic and Health Survey (DHS) reported that water was unavailable for an entire day in the past 2 weeks (Table 1), although this varied between 3.3 and 49.8% in different regions (Supplementary Table S2). The percent of households reporting these outages decreased by a mean of −0.32 percentage points (SD: 0.014) annually (Table 1 and Supplementary Table S2).
Utility-reported supply continuities ranging from 1.6 to 24 h/day, although these varied between years (Fig. 1 and Supplementary Fig. S3 and Supplementary Table S1). Most utilities showed small improvements in continuity of a ≤2% increase in supply hours (Fig. 1). Of the 50 utilities, 13 reported a decline in hours of supply (indicated by a negative slope of change in their supply hours) from 2010 to 2014 (Fig. 1). All but 2 of the 50 utilities provided <24 h per day of supply, and 13 utilities reported <12 h per day on average. Using a threshold of 12 h/day, which is also used by the World Health Organization/UNICEF Joint Monitoring Program (JMP) to define IWS, an estimated 3.5 million people in Peru were served by IWS between 2010 and 2014, which is ~21% of the total population (Table 1). There were no associations between the hours of water supply of a utility and the population served (Fig. S2 and Supplementary Table S3), nor was the improvement or decline in hours dependent on the median hours of supply provided (Fig. 1).

Each reporting utility is on the x-axis, shown in order of median hours of supply from left to right. Horizontal lines represent median hours of supply for each utility (left hand y-axis). Blue bars represent the slope of change of supply hours between 2010 and 2014 (right hand y-axis) (data in Supplementary Table S1). Values for the slope is the average change in h/day per year.
The estimated percent of households with IWS as reported by households using DHS data was slightly higher than the population reported by utilities through IBNET for the same years (Table 1). Therefore, on a national level and using our designations (utilities reporting <12 h supply and households reporting an outage in the last 2 weeks categorized as intermittent), utilities reported more supply continuity than households do, although these estimates were notably within 5 percentage points.
Regional comparison
While national estimates of the populations served by IWS using utility- and household-reported data were close, these did not align between regions (Fig. 2). Notably, many regions had no utility-reported population with IWS when households did report intermittency in the surveys; conversely, many regions had a high-utility-reported percent of the population with IWS and low household-reported outages. Overall, there was a much wider range of utility-reported populations with IWS (from 0 to 100%), while household-reported IWS per region stayed within a narrower range of values (between 2.65 and 49.3%) due to our methods of classifying regions as IWS or not IWS.

Each column represents setting thresholds (for household or utility-reported data) resulting in the number of IWS regions of 5, 10, 15, and 20. Concordant regions/IWS regions represents the number of regions that are the same between both measures.
We conducted this analysis using both 12 and 16 h/day thresholds for the utility-reported IWS. While 12 h/day is used by the World Health Organization/UNICEF Joint Monitoring Program (JMP), we chose to examine the more stringent threshold of 16 h/day16,24. As will be seen in the sensitivity analysis, using a threshold of 16 h/day for utility-reported data resulted in equivalent percentages of the population with IWS as from household-reported outages, suggesting that 16 h/day may be a more representative “threshold” at which people report outages in their water supply in this case.
We defined regions as either supplying IWS or not based on a threshold of each region’s percent population with IWS (for household-defined IWS) or number of hours of supply per day (for utility-defined IWS) (Fig. 2). For example, lowering the threshold of percent population with household-reported IWS (e.g., from 35 to 25%) increased the number of regions defined as IWS; correspondingly, increasing the threshold for utility-reported hours of supply (e.g., from 14 to 17 h/day) increased the number of regions defined as IWS. When we varied both thresholds to arrive at the same number of regions categorized as IWS, the regions we categorized as IWS were not concordant: for example, both methods yielded 10 IWS regions when using the 25% and 17 h/day thresholds, but only four of these regions were the same (Fig. 2). The highest concordance in regions was achieved when thresholds were set as at least 16% and 21.8 h/day were used. Only two regions, Huánuco and San Martin, had utility- and household-reported continuity values that closely matched (Fig. 3a and Supplementary Tables S1 and S3).

a National and regional data from Peru. For the regional data, each point represents a 5-year average per region, and for the national data, each point represents a different year of data. Different symbols represent different thresholds used (12 or 16 h/day); b Other countries, including mean values for Peru (2010–2014), Albania (2012), Zimbabwe (2014, 2015), and Tanzania (2015, 2016) using a 12 h/day threshold.
Global analysis
We compared utility- and household-reported continuity for three other countries (Fig. 3b). In Albania, the mean utility-reported IWS population was 73% across 2008–2012, while only 30% of households reported outages. In Tanzania, 50% of the population received utility-reported IWS in 2015 (using the 12 h/day threshold), while 67% of the population received household-reported IWS the same year. Data from Zimbabwe for 2014 and 2015 suggest that the utility and household estimates were similar, with 18% and 13% of the population with IWS reported by utilities and households, respectively.
Sensitivity analysis
We examined the influence of threshold selection on our results. In the national analysis, we categorized utilities with <12 h/day as IWS, which is consistent with the threshold used by the JMP for “available when needed”16,24. If instead a threshold of 16 h/day was used, the percent of the population defined as IWS would be consistent with the household-reported percent, with both at 26% (Fig. 4a). Thirteen of the 50 utilities in Peru supplied fewer than 12 h/day and almost half (24 utilities) supplied fewer than 16 h/day. More than 90% of the population experienced outages for at least 2 h/day (Fig. 4a). The largest change in populations classified as IWS occurred at 21.8 h/day, with the population increasing from 52 to 71%, since this is the continuity supplied in Lima, which provides water to more than 9.2 million people. The number of regions in Peru defined as IWS is inversely proportional to the minimum percent of the population responding “yes” to SH43 (for household-reported data, Fig. 4b) or minimum hours of supply threshold (for utility-reported data, Fig. 4c). When changing the threshold from 12 h/day to 16 h/day the average number of regions classified as intermittent dropped from 20 to 13 (Fig. 4c).

a The threshold hours of supply for 2010–2014 for the utilities in Peru and corresponding percent of the population classified as served with IWS. b The number of regions in Peru classified as IWS depending on the population threshold used for household-reported outages (threshold of 25% shown as vertical line for reference). The maximum proportion of households reporting an outage in a region was 49.8%. c The number of regions in Peru classified as IWS based on the threshold utility-reported hours of supply (thresholds of 12 and 16 h/day shown as vertical lines).
Household reporting of outages
We examined the difference between two recently introduced questions asked of households for reporting on supply continuity in Peru in the DHS, question SH42 (“Is water available for one whole day?”) and question SH43 (“In the last 2 weeks, was water discontinued for a day or more?”) (Table 2). We found that more people answered “Yes” to water being continuous for the past 2 weeks (or “No” to SH43) than “Yes” to SH42 in 2013 (77% versus 62% of households) (Table 2). The percentages of concordant answers were 65 and 64% in 2013 and 2014, respectively. In 2014, 26% of the surveyed household reported that the drinking water source was not available for a whole day but was continuous in the past 2 weeks, and 10% of the households responded that water was available for the whole day but that it was not continuous in the past 2 weeks (i.e., was discontinuous for a day or more) (Table 2).
Discussion
We found that the percent of the population with IWS in Peru as reported by households (23–26%, depending on the year) was a few percentage points greater than that reported by utilities (20–21%). However, comparing results by region suggests that this may be a coincidence: many regions had no utility-reported population with IWS even when households with piped water supply reported outages. These results depend on the thresholds we selected to compare the two data sources. For the utility-reported IWS, 16 h/day (e.g., 8 h/day of outages) may be when most households tend to notice or report intermittency, although, notably, households experiencing any interruption in supply (i.e., <24 h/day) are still “discontinuous” and are likely subject to some of the same negative impacts of coping with IWS. The appropriate threshold for the percent of a population within a region reporting an outage to produce consistent household- and utility-reported continuity is uncertain, as concordant regions were few, suggesting it may be not only the threshold selection causing disparate results. Results comparing the national populations with IWS from three other countries (Albania, Tanzania, and Zimbabwe) do not suggest a clear connection between utility- and household-reported data.
Within a town or city, households can experience different hours of supply due to network hydraulics, elevation, water demand, and valve operations; those on a trunk main may receive continuous water supply, while those located far from the water treatment plant may receive supply once a week15,25. Therefore, household-reported outages may better capture this variability than utility-supplied information on their provided hours of supply. Relatedly, there is little guidance provided to utilities on how to calculate their hours of supply; it is possible some are reporting the hours that they run their pumps inputting to the distribution system, while others may report on their targeted valve operation periods. While it is likely each utility’s method is consistent from year to year, they may not be comparable between utilities. Long-term and seasonal variations in hours of supply may also be responsible for the discrepancies. For example, some of the observed variability may be seasonal trends (e.g., continuity may be greater in a rainy season). Household-reported outages varied more year to year than utility-reported data, which is expected. Variations between households are expected due to sampling and timing of visits, while the utility likely reports using a consistent method year to year. Also, since the data for utilities were influenced by utilities serving larger populations (e.g., Lima), the national results for IWS may be relatively stable if these did not change over the studied time period.
In the 2 years that included two household survey questions on drinking water availability, there was inconsistency in the answers to these questions within the same households. Lack of consistency in defining and reporting reliability has been highlighted as a common issue in studies and data collection frameworks10. Of the surveyed households using piped water, 35% and 36% in 2013 and 2014, respectively, responded with opposite answers when asked both about a water outage for a day or more in the past 2 weeks and whether water to drink was available for the whole day (yes to one and no to the other, or vice versa). These two questions inquire about two different experiences: one is about severe intermittency within a specified time period (SH43) while the other (SH42) is about access to water more generally. These each address two different sides of water access: is supply available, and do they have water when they need it? Question SH43 may not be indicative of the true nature of water availability in a household throughout a day since it focuses on severe intermittency, and results based on lower thresholds (e.g., <12 h/day) may be more comparable. Also, given the 2-week recall period, responses may hide seasonality of supply (e.g., if a utility supplies water intermittently to a household in dry seasons and continuously in wet seasons). However, SH42 is likely a worse indicator of IWS, as households may (and likely do) have storage and alternative sources and therefore would report that water is always available during the day26,27,28. We posit that question SH43 may be better than SH42 for understanding continuity of supply, which is why it was used in the analysis presented. However, alternative questions could be designed to allow categorization of supply as continuous, moderately intermittent, and/or severely intermittent, or to capture how often the outages (or water deliveries) occur (e.g., once in a week or every day). Notably, one question was phrased as availability while the other was phrased as the lack thereof, which may have influenced peoples’ responses. In countries where intermittency is more severe, it may be easier for households to recall how many times piped water is available rather than how many times it is out; conversely, in systems where supply is mostly continuous, it may be easier for households to recall outages.
Study limitations
There are several limitations to the data sources used for this analysis and methods. The data reported by IBNET represent only the population served by reporting utilities, although there may be people in a region with a piped water connection not operated by an IBNET-reporting utility. Similarly, households reporting to DHS may be reporting on piped supply from a community-based organization that does not report to IBNET. However, we estimate that the percent of households reporting hours of supply about a non-IBNET provided piped water supply to be minimal, since the IBNET coverage aligns with published coverage data from household surveys (according to the World Health Organization/UNICEF Joint Monitoring Program (JMP), the urban coverage of piped drinking water in Peru increased from 80 in 2010 to 82% in 2014 (Supplementary Fig. S1), which compares to utility-reported coverage through IBNET of 85 in 2010 and 91% in 201416,23). It is possible that those served by smaller agencies that do not report to IBNET may experience more intermittent supply and report the outages, although there were no associations with utility size and supply continuity for IBNET-reporting utilities (Supplementary Fig. S2). Utilities may also overestimate their coverage and population served, although coverage reported by IBNET is similar to that reported for piped water nationally. Additionally, there may have been other changes to utilities from year to year, such as combining or regionalizing some service or changing service areas. Much of our analysis relied on categorizing entire utilities and entire regions as IWS or not IWS, which hides a much more complex reality. If data with a finer geographic resolution were available, it could be possible to better match households living in a particular utility’s jurisdiction; however, such data were unavailable. The data from households was collected through nationally representative surveys, however, variability in which households are surveyed year to year, and the time of the year in which data are collected, would be expected to influence results. Also, all results for household-reported continuity are based on a percent of households, while IBNET is based on a percent of the population.
Recommendations
This study presented the challenges associated with measuring and accounting for IWS with data available from utilities and/or households. Better metrics for reporting on continuity should be developed, tested, and standardized to identify gaps in and opportunities for improving utility performance. There are currently no standards for how hours of supply are measured or reported or how to report the variability of supply that occurs over a week or season. Better information may help regulatory agencies and water utilities managers provide more equitable supply within a city or town29,30,31. Specific recommendations for improving data collection follow:
-
Utility measurement of continuity. While utilities report their average supply duration, it is not clear what this average represents, For example, it could represent the hours a pump is operated at a water treatment plant or the average duration experienced by households at the end of the network. Utilities could better capture continuity of supply through reporting by utility workers responsible for turning supplies on and off (i.e., valve operators), although the reliability of data collection through field utility employees has been challenging to maintain in practice32. Utilities could regularly survey or collect customer complaints regarding supply continuity by randomly selecting households for in-person or phone-based surveys. While sensors could be used to detect outages, these have to be installed at static locations and may be best located at pump houses and treatment plants; utilities that struggle to supply continuous supply may also have challenges maintaining such a sensor network.
-
Water delivery/outage patterns. An important first step to improving such metrics would be to include the number of days between supply in IBNET reporting: currently, a utility supplying 5 h of supply every day is equivalent to a utility supplying 17.5 h of water twice in a week and to a utility supplying water for 24 h per day for 5 months and then 1 h per week for 7 months. This could be achieved by reporting both average hours per day and days per week or the ranges throughout the year (i.e., “wet” season and “dry” season). Continuity can vary substantially within a city; notably, the IBNET database does have an indicator for the number of people in a utility served by IWS (which would be equal to or less than the population coverage), however, few utilities report this indicator.
-
Predictability of supply. Including an indicator of whether the supply is scheduled (and the schedule is followed) or whether outages are unpredictable would be advantageous for benchmarking customers’ experiences. The impacts of the delivery patterns described above on customers is likely to be substantially different: Galaitsi et al.33 suggested that predictable intermittency, irregular intermittency, and unreliable intermittency—defined by how much households could rely on delivery or outages at certain times—affected their experience with, and the negative impacts of IWS. Households that know exactly when to expect water, and can therefore plan household activities and be home when the water is arriving, will have a different level of water access than those who do not know when water will be delivered and spend scarce resources on alternative water sources or miss work to wait for the arrival of water6. Notifications of when water in an IWS would be delivered were associated with modest reductions in stress in low-income households32.
Methods
Study site
Peru had a population of ~32 million with a per capita GDP of US$211 Billion in 201734. Drinking water in Peru is provided by 53 Municipal Service Providers (las Entidades Prestadoras de Servicios de Saneamiento, EPS) that provide surface or groundwater to cities and towns in Peru, serving >62% of the country’s population35. Approximately 11,800 community-based organizations, known as Sanitation Services Administrative Committees (Juntas Administradoras de Servicios de Saneamiento, JASS), provide water to the remaining 29% of Peru’s rural population and 9% of Peru’s population that live in 490 small municipalities35. The National Sanitation Services Supervisory (SUNASS), a regulatory agency funded through a surcharge on water bills, regulates and oversees the EPS35,36,37. EPS are spread throughout the country; the median elevation for the utilities is 783.6 m and the country as a whole has an average elevation of 1555 m (Supplementary Fig. S1). We selected Peru for this analysis due to its high coverage by piped water (85–91% of the Peruvian population had access to piped water in 2017)35,37, and continuous reporting by utilities: 48 of the 50 utilities in Peru reporting continuity to IBNET for every year from 2010 to 2014 (Supplementary Table S1).
Data sources
Utility-reported water supply continuity were obtained from the IBNET, which compiles global data on water and sanitation utilities performance (ib-net.org)18. IBNET data from utilities in Peru from 2010 to 2014 were obtained from the online database. The accuracy of these data depends on reporting by utilities and/or regulators38.
The DHS Program collects, analyzes, and disseminates representative longitudinal data on population and health in over 90 countries39. These surveys documented coverage and continuity of drinking water in household (Table 3). Household survey results for Peru were obtained for 2010–201419,20,21,22,23. For all analyses, we used the subset of households surveyed who reported using piped water as their primary drinking water source (including piped water, piped into dwelling, piped outside dwelling, and public tap) (Question HV 201, Table 3).
Matching regions
Data from IBNET were reported by utility (which, in Peru’s case, corresponds to a city), while DHS records reported data from individual households by region. To harmonize these, we first identified the longitude, latitude, and elevation of the utilities using Google Maps based on the IBNET utility or city name40. When we could not locate a utility office on Google Maps, the coordinates of the center of the served city were used instead. We used these coordinates to group the utilities into their respective regions by matching each utility’s location to the list of regions from the country profile in World Bank publications (Supplementary Table S4)34. In 25 of the 27 regions in Peru, there were between 1 and 5 utilities reporting supply continuity to IBNET (no utilities reported from Callao and Piura). To arrive at an average utility-reported continuity (h/day) for a region with more than one utility, we calculated the mean hours of supply reported for utilities within that region.
Comparing utility and household hours of supply
Our analysis was divided into two parts: (1) Method I compared the two data sources at the national level; (2) Method II compared the two data sources at the regional level (Fig. 5). The analysis converted the utility- and household-reported data into comparable values by assigning binary values to utilities or households—each either supplied water intermittently or did not—and calculating percentages of the population using each type of piped water service. This was performed for each year from 2010 to 2014 for each region.
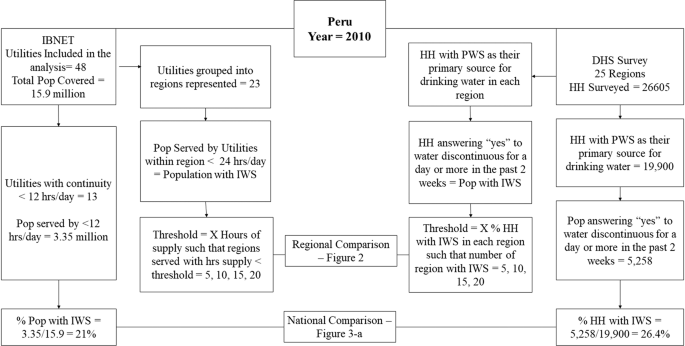
X = threshold of the minimum % population with IWS to deem a region intermittent. The numbers shown are from 2010 and used as an illustrative example; the analysis was performed for each year. Pop population, HH households, PWS piped water supply, IWS intermittent water supply.
Method I: national comparison
We expressed household-reported continuity as the percent of households experiencing IWS, estimated as the sum of the households reporting using piped water as their primary drinking water source and answering “yes” to questions SH43 (that water was discontinued for at least a day in the last 2 weeks) (Table 3 and Supplementay Table S2), divided by the total number of households using piped water. We expressed utility-reported continuity in Peru as the percent of people served by a utility providing IWS. To estimate this, we categorized utilities as providing IWS if their mean hours of supply between 2010 and 2014 was <12 h/day. We selected 12 h/day as the threshold, as we postulated that households will report an outage of a day if it is out for at least 12 h and to be consistent with current definitions of available when needed used by the JMP24. We summed the population served by the utilities categorized as IWS (<12 h/day) and divided by the total population covered by reporting utilities. This threshold was varied as part of the sensitivity analysis.
To compare the trends seen in Peru to global data, we collected available data for other countries reporting to IBNET and performed the same comparison as described above. Household surveys for Tanzania and Zimbabwe were available through the DHS Program, while those for Albania were obtained from Living Standards Measurement Study41.
Method II: regional comparison
To compare intermittency within regions, we compared the regions where utilities reported IWS according to thresholds of hours of supply and the percentage of households with piped water reporting water outages.
We calculated the percent of surveyed households using piped water supply who reported having discontinuous supply during the past 2 weeks (“yes” to questions SH43) for each region (Supplementary Table S2). We then categorized regions as supplying IWS based on whether this percent was greater than a threshold (e.g., if the threshold was set as 25%, then a region was classified as an IWS region if >25% of households reported an outage in the last 2 weeks; this threshold was varied). This yielded two values to compare with utility-reported data: (1) the percent of the population within each region with household-reported intermittent supply; and (2) whether a region was intermittent or not as defined by households.
We obtained utility-reported continuity for each region by grouping utilities into regions (described previously) and classifying each as IWS depending on their hours of supply (varying thresholds were used; e.g., <16 h/day). We calculated the total population with IWS by summing the number of people in each region served by utilities classified as IWS divided by the total population served by utilities in that region. We also calculated the mean hours of supply per day for the utilities in each region to categorize regions as IWS if the mean hours of supply for utilities in that region was less than a threshold (e.g., if the threshold was 16 h/ day, then a region was classified as IWS if the mean of utility supply hours in that region was <16 h/day; thresholds were varied). This yielded two values to compare with household-reported data: (1) the percent of population within each region with utility-reported intermittent supply; and (2) whether a region was intermittent or not as defined by utilities. In the regions where all reporting utilities supplied an average greater than the threshold, no populations were classified as receiving IWS; in regions where all the reporting utilities supplied less than the threshold, 100% of the population was classified as receiving IWS.
Sensitivity analysis
We performed a sensitivity analysis to determine the effect of varying thresholds throughout the analysis for Peru. We plotted the cumulative density function of the mean hours of supply of each utility against the average populations served over the 5 years, the number of regions with IWS according to household reports, and a range of minimum percent of households reporting outages (0–100%) per region against the number of regions with IWS.
Data analysis
R statistical analysis packages were used to extract and analyze household surveys and cluster utility data by regions42. Microsoft Excel statistical functions and Data Analysis tool were used to perform linear regressions. Blank fields were excluded from analysis.
Data availability
Data used in this analysis were from public sources and are available for download through the citations provided throughout the paper.
References
Bivins, A. W. et al. Estimating infection risks and the global burden of diarrheal disease attributable to intermittent water supply using QMRA. Environ. Sci. Technol. 51, 7542–7551 (2017).
Christodoulou, S. & Agathokleous, A. A study on the effects of intermittent water supply on the vulnerability of urban water distribution networks. Water Sci. Technol. Water Supply 12, 523–530 (2012).
Ercumen, A. et al. Upgrading a piped water supply from intermittent to continuous delivery and association with waterborne illness: a matched cohort study in urban India. PLOS Med. 12, e1001892 (2015).
Jeandron, A. et al. Water supply interruptions and suspected cholera incidence: a time-series regression in the democratic republic of the Congo. PLOS Med. 12, e1001893 (2015).
Kumpel, E. & Nelson, K. L. Intermittent water supply: prevalence, practice, and microbial water quality. Environ. Sci. Technol. 50, 542–553 (2016).
Burt, Z., Ercümen, A., Billava, N. & Ray, I. From intermittent to continuous service: costs, benefits, equity and sustainability of water system reforms in Hubli-Dharwad, India. World Dev. 109, 121–133 (2018).
van den Berg, C. & Danilenko, A. The IBNET Water Supply and Sanitation Performance Blue Book 2014: The International Benchmarking Network for Water and Sanitation Utilities Databook. (World Bank, 2014).
Franceys, R. & Jalakam, A. The Karnataka Urban Water Sector Improvement Project: 24x7 Water Supply is Achievable. (World Bank Water and Sanitation Program, Washington, DC, 2010).
Sangameswaran, P., Madhav, R. & D’Rozario, C. 24/7, ‘Privatisation’ and water reform: insights from Hubli-Dharwad. Econ. Polit. Wkly. 43, 60–67 (2008).
Majuru, B., Suhrcke, M. & Hunter, P. R. Reliability of water supplies in low and middle-income countries: a structured review of definitions and assessment criteria. J. Water Sanit. Hyg. Dev. 8, 142–164 (2018).
WHO/UNICEF Joint Monitoring Programme for Water Supply and Sanitation (JMP). WASH POST-2015: Proposed Targets and Indicators for Drinking-water, Sanitation and Hygiene. http://www.wssinfo.org/fileadmin/user_upload/resources/post-2015-WASH-targets-factsheet-12pp.pdf (2014).
Kumpel, E. & Nelson, K. L. Mechanisms affecting water quality in an intermittent piped water supply. Environ. Sci. Technol. 48, 2766–2775 (2014).
Erickson, J. J., Smith, C. D., Goodridge, A. & Nelson, K. L. Water quality effects of intermittent water supply in Arraiján, Panama. Water Res. 114, 338–350 (2017).
De Marchis, M. et al. A model of the filling process of an intermittent distribution network. Urban Water J. 7, 321–333 (2010).
De Marchis, M. et al. Analysis of the impact of intermittent distribution by modelling the network-filling process. J. Hydroinformatics 13, 358 (2011).
WHO/UNICEF. Joint Monitoring Programme for Water Supply and Sanitation (JMP). https://washdata.org/data (2018).
United Nations, Department of Economic and Social Affairs, Population Division. World Urbanization Prospects: The 2018 Revision, Online Edition (2018).
IBNET. The International Benchmarking Network. https://www.ib-net.org/ (2017).
ICF. The DHS Program-Peru: Continuous DHS. https://dhsprogram.com/what-we-do/survey/survey-display-426.cfm (2010).
ICF. The DHS Program-Peru: Continuous DHS. https://dhsprogram.com/what-we-do/survey/survey-display-433.cfm (2011).
ICF. The DHS Program-Peru: Continuous DHS. https://dhsprogram.com/what-we-do/survey/survey-display-434.cfm (2012).
ICF. The DHS Program-Peru: Continuous DHS. https://dhsprogram.com/what-we-do/survey/survey-display-455.cfm (2013).
Rutstein, Shea O., Way, A. & ICF. The Peru Continuous DHS Experience. DHS Occasional Papers No. 8. Rockville, (ICF International [Distributor], Maryland, USA, 2014).
Onda, K., LoBuglio, J. & Bartram, J. Global access to safe. Water.: Account. Water. Qual. Resulting Impact MDG Progress. Int. J. Environ. Res. Public. Health 9, 880–894 (2012).
Kumpel, E., Woelfle-Erskine, C., Ray, I. & Nelson, K. L. Measuring household consumption and waste in unmetered, intermittent piped water systems: Water Use in Intermittent Piped Systems. Water Resour. Res. https://doi.org/10.1002/2016WR019702 (2017).
Elliott, M. et al. Addressing how multiple household water sources and uses build water resilience and support sustainable development. NPJ Clean Water 2, 6 (2019).
Rosenberg, D. E., Tarawneh, T., Abdel-Khaleq, R. & Lund, J. R. Modeling integrated water user decisions in intermittent supply systems. Water Resour. Res. 43, 15 (2007).
Tokajian, S. & Hashwa, F. Water quality problems associated with intermittent water supply. Water Sci. Technol. 47, 229–234 (2003).
Ameyaw, E. E., Memon, F. A. & Bicik, J. Improving equity in intermittent water supply systems. J. Water Supply Res. Technol. 62, 552–562 (2013).
Gottipati, P. V. K. S. V. & Nanduri, U. V. Equity in water supply in intermittent water distribution networks. Water Environ. J. https://doi.org/10.1111/wej.12065 (2013).
Ilaya-Ayza, A., Martins, C., Campbell, E. & Izquierdo, J. Implementation of DMAs in intermittent water supply networks based on equity criteria. Water 9, 851 (2017).
Kumar, T., Post, A. E. & Ray, I. Flows, leaks and blockages in informational interventions: a field experimental study of Bangalore’s water sector. World Dev. 106, 149–160 (2018).
Galaitsi, S. E. et al. Intermittent domestic water supply: a critical review and analysis of causal-consequential pathways. Water 8, 274 (2016).
The World Bank Group. Peru - Data. The World Bank. https://data.worldbank.org/country/peru. (2018). Accessed 13 Mar 2018.
World Bank. Peru/World Bank: Improvements in water and sewage systems to reach more than 200 thousand residents in Northern Lima. World Bank. http://www.worldbank.org/en/news/press-release/2015/01/16/peruworld-bank-improvements-in-water-and-sewage-systems-to-reach-more-than-200-thousand-residents-in-northern-lima (2015).
SUNASS. Sunass Mission and Vision. http://www.sunass.gob.pe/websunass/index.php/sunass/quienes-somos/mision-y-vision (2019).
WHO. WHO|UN-Water Global Analysis and Assessment of Sanitation and Drinking-Water (GLAAS) 2017 Report. http://www.who.int/water_sanitation_health/publications/glaas-report-2017/en/ (2017).
Van, D. B. C. & Danilenko, A. In IBNET Water Supply and Sanitation Performance Blue Book: the International Benchmarking Network for Water and Sanitation Utilities Databook. The World Bank (2010).
ICF. “County Main”. The DHS Program website. Funded by USAID. http://www.dhsprogram.com. https://dhsprogram.com/Where-We-Work/Country-Main.cfm?ctry_id=33&c=Peru&Country=Peru&cn=&r=6. (2019). Accessed 1 Jan 2019.
Peru Spatial Data. Geographic Information System https://www.diva-gis.org/datadown (2019).
The World Bank Group. Living Standards Measurement Study (LSMS) - surveyunit. The World Bank. http://surveys.worldbank.org/lsms (2019).
R Core Team R: A language and environment for statistical computing. R Foundation for Statistical Computing, Vienna, Austria. http://www.R-project.org/ (2013).
Acknowledgements
We thank support from the University of Massachusetts Amherst Department of Civil and Environmental Engineering.
Author information
Authors and Affiliations
Contributions
F.R., E.K., and R.B. conceived of the study, F.R. and E.K. designed research plan and performed analysis; F.R., E.K., and R.B. drafted the manuscript. All authors contributed to the final manuscript.
Corresponding author
Ethics declarations
Competing interests
The authors declare no competing interests.
Additional information
Publisher’s note Springer Nature remains neutral with regard to jurisdictional claims in published maps and institutional affiliations.
Supplementary information
Rights and permissions
Open Access This article is licensed under a Creative Commons Attribution 4.0 International License, which permits use, sharing, adaptation, distribution and reproduction in any medium or format, as long as you give appropriate credit to the original author(s) and the source, provide a link to the Creative Commons license, and indicate if changes were made. The images or other third party material in this article are included in the article’s Creative Commons license, unless indicated otherwise in a credit line to the material. If material is not included in the article’s Creative Commons license and your intended use is not permitted by statutory regulation or exceeds the permitted use, you will need to obtain permission directly from the copyright holder. To view a copy of this license, visit http://creativecommons.org/licenses/by/4.0/.
About this article

Cite this article
Rawas, F., Bain, R. & Kumpel, E. Comparing utility-reported hours of piped water supply to households’ experiences. npj Clean Water 3, 6 (2020). https://doi.org/10.1038/s41545-020-0053-y
Received:
Accepted:
Published:
DOI: https://doi.org/10.1038/s41545-020-0053-y
