
Abstract
The present study compares the prevalence of antibiotic-resistant bacteria (ARB) in the urban water of Ahmedabad (India), to understand the correlation of ARB with the fecal, metal, and microplastic contamination. Eleven samples, i.e., three locations of Sabarmati River along with one sample each from two (Chandola and Kankaria) lakes, and influents and effluents from three Sewage Treatment Plants (STPs) were analyzed in this study. E. coli isolated from the samples were subjected to three fluoroquinolones (Levofloxacin (LVX), Ciprofloxacin (CIP), and Norfloxacin (NFX)) and three non-fluoroquinolones (Kanamycin Monosulphate (KM), Tetracycline (TC), and Sulfamethoxazole (ST)) antibiotics for resistance quantification. Prevalence of the E. coli in the Sabarmati River (19,467–76,600 cfu mL−1) was higher than the lakes and STP(s), except the influent sample at Juhapura STP. Among the lake samples, Kankaria Lake (KL) exhibited 0% resistance towards all six antibiotics despite 5× prevalence of E. coli than that of Chandola Lake (CL) exhibiting up to 60% resistance for non-fluoroquinolones and 40% resistance to NFX. Multivariate statistical analyses suggest that resistance for ST, KM, and TC is more prevalent and correlated with electrical conductivity (EC), finer size microplastic, manganese (Mn), and nickel (Ni), whereas the resistance for fluoroquinolones (LVX, CIP, and NFX) seems highly influenced by seasonal temperature variation. Larger size microplastic clustered with salinity, ORP, and Pb. Further, fecal contamination and antibiotic resistance seem to be governed by the same source and processes, yet it does not show good correlation except for the river samples. This result may be attributed to the dynamic river–human interface, substantial wastewater discharge into the river, stagnant water flow, and urbanization-related discharge conditions rather than the upstream condition.
Introduction
Rapid urbanization and industrialization, growing energy demands, and intensive agriculture have adversely affected the physicochemical and biological properties of the ambient water.1,2 Antibiotic resistance is a condition that enables the microorganisms to become capable of reproduction and survival within the target sites in the presence of antibiotics.1 According to the World Health Organization, antibiotic-resistant bacteria (ARB) and antibiotic-resistant gene (ARG) are the two major threats to public health in the twenty-first century.2 The worldwide prevalence of ARB is on the rise due to continual increment in overall consumption of antibiotics in various medical, domestic, agricultural, and veterinary applications.3 Acquiring the ability of antibiotic resistance does not remain restricted to any particular type of microorganism that might be targeted by a given antibiotic.4 The consequence of ARB is a significant disquiet in treating life-threatening diseases for both humans and animals.5,6 In the last 15 years (2000–2015), India witnessed 103% (3.2–6.5 billion defined daily doses) increase in antibiotic consumption.7 Estimates suggest that the global consumption of antimicrobials will increase from 63,151 to 105,596 tons (67%) between 2010 and 2030.8 Moreover, there is no regulation in India for the use of antibiotics in food products/industry, animal husbandry, or medical industry.9 Altogether, ARB triggers several public and environmental health concerns.10,11
Such accelerated and unregulated antibiotic consumption has drastically influenced microbial ecology12 and, thus, the detection of ARB and ARG in various environmental components has been becoming ubiquitous viz. in municipal solid-waste leachate,13 sludge,12 sediments,14 wastewater,5,15,16 drinking water,17 and groundwater.18 In general, the number of resistant bacteria isolated from contaminated water should be relatively higher than less polluted water. However, the opposite cases are frequently reported at the wastewater treatment plants (WWTPs) where the effluent exhibited more percentage of ARB than that of influent,16,19,20 owing to antimicrobial activity, chemical properties of antimicrobial agents, and horizontal gene transfer and treatment conditions.21 This implies that antibiotics discarded into wastewater are not being efficiently removed in WWTPs,22 yet effluents are released to the environment.15,23 WWTPs represent reservoirs of human and animal commensal bacteria where antibiotic resistance determinants or organisms persist. Owing to nutritional richness, availability of residual antibiotics,12 and high bacterial density,19 WWTPs are considered as hotspots for horizontal gene transfer that play a significant role in spreading ARB via gene transfer through intercellular interactions.13
A significant correlation between the prevalence of ARB and urban discharge in the river water has been reported.24 Among other factors, environmental and anthropogenic indices were also found significantly correlated with occurrence, prevalence, variance, distribution, and migration of antibiotic-resistant Escherichia coli in the natural waters.25 Urban lakes also exhibited a relationship among the covariations of antibiotics and metal concentration with ARGs.26 Rodriguez-Mozaz et al.2 reported a positive correlation between the concentrations of antibiotics and corresponding ARGs in urban surface waters, including hospital waste and WWTPs samples.26 In Vietnam and Thailand, prevalence of fluoroquinolone-resistant bacteria in the surface water was not found correlated with its concentration; however, for sulfamethoxazole (ST), the concentration and occurrence of ST-resistant bacteria were positive.27 E. coli, isolated from the Chao Phraya Delta, a dense canal network in Thailand, has demonstrated higher antibiotic resistivity near urban lands.28 Recently, high prevalence of ARB and antimicrobials agents are reported10 in Indian Rivers like Gomati,29,30 Ganga,31 and Torsa,32 which is a serious issue. Therefore, an explicit understanding is necessary about the distribution and frequency of antibiotic resistance in the ambient urban waters to prevent future disease outbreaks.
Recently, microplastic pollution has become the contaminants of emerging concerns owing to its ubiquitous presence, high strength-to-weight ratio, bio-inertness, durability, danger to aquatic life and human health implications.33,34 In 2016 along, global plastic production was mammoth (~335 million metric tons) with increased production of 260 Mt/Year productions in Europe alone. Owing to a wide variety of sizes (meter to micrometers) of plastic existing in the environment,35 microplastics is yet not universally defined based on the size. However, since 2010, any plastic fragments size smaller than 5 mm has been considered as microplastic. Microplastics have been reported in the water column and municipal waste streams35 and sediments worldwide.36,37,38 Hundreds to thousands of years are required to completely mineralize plastics, which act as the adsorptive surfaces to organic/inorganic contaminant, microorganisms, and hydrophilic/hydrophobic compounds. Further, microplastics cannot be efficiently removed by WWTPs and thus eventually stays in the urban freshwater ecosystems.39 In response to growing concerns from the scientific community, microplastics were banned from personal care products in Europe (UNEP40). Further, metal contamination has been reported to induce antibiotic resistance through co-selection, cross-resistance, and co-regulation.3,41 In the freshwater microcosms, a decrease in microbial abundance was reported after high frequencies of ARBs.41,42,43 Spreading of ARBs has also been found associated with microplastic in the marine ecosystem.44 However, correlations between the prevalence of ARB with metals, microplastic, and fecal contamination in a single study probably have not been yet reported. In addition, we provide here the correlations among these emerging water issues in different water systems, i.e., lake, river, and wastewater.
In general, ambient water quality standards in India does not include antibiotic resistance parameter and most of the prominent cities lack any baseline data on the prevalence of ARB. Only traditional parameters such as Biological Oxygen Demand (BOD), major ions, and metals are available. Among microbial parameters, only total coliform or E. coli counts are taken into account. Above all, many cities lack domestic WWTPs and untreated waste is directly discharged into the water bodies in the vicinity without any guidelines. Under the light of the above discussions of the prevailing situation and concern, we have selected the UNESCO heritage city of Ahmedabad located in the province of Gujarat for assessing the extent of antibiotic resistance threat present in the river, lakes, and wastewater treatment systems of the city. The specific objectives of the study were fourfold viz. (i) Comparative evaluation of the prevalence of E. coli and total coliform in the wastewater and surface water in Ahmedabad; (ii) status of antibiotic resistance in isolated E. coli among different urban water bodies; (iii) derivation of correlating equation between resistance and E. coli prevalence, and (iv) correlation appraisal of antibiotic resistance with fecal, metal, and microplastic contamination.
Results and Discussion
Prevalence of E. coli
The prevalence of E. coli and total coliform colony-forming unit per milliliter (cfu mL−1) is presented (Table 1) along with in-situ parameters such as pH, electrical conductivity (EC), total dissolved solids (TDS), oxidation–reduction potential (ORP), salinity, and temperature. E. coli in the river ranged between 19,467 and 76,600 cfu mL−1, which is an alarmingly higher number compared with the lakes and Sewage Treatment Plants (STPs) (except for influent at Juhapura STP). Sardar Bridge at Sabarmati Riverfront (R2) exhibited the highest E. coli count owing to dynamic river–human interface, substantial wastewater discharge into the river, and stagnant water flow.24 Further, E. coli value obtained in this study are much higher than the reported average fecal coliform count (FCC) in the Ganges near Varanasi (except at Varuna River confluence, i.e., 2.0 × 10⁵ cfu mL−1 of FCC45) and in Wenyu River China (1.7 × 10⁴ cfu mL−1).46 Even in the extreme lower reaches of the Ganges, i.e., West Bengal stretch, the reported FCC was much lower with the most probable number (MPN) of 75–2950 mL−1 of samples than the one obtained in the present study.47 The observed E. coli prevalence (cfu mL−1) in the Sabarmati River was higher than several tropical rivers like in Chao Phraya River (70), Nan River (4.8), Ping River (42), Wang River (0.47), and Yom River (5.4) in Thailand,28 as well as Damodar River (70) in India.1
Among the lake samples, the prevalence of E. coli was ~5 times higher at Kankaria Lake (KL) (15,333 cfu mL−1) than Chandola Lake (CL) (3467 cfu mL−1), owing to higher recreational activities at KL, i.e., 13000–15000 tourists/day.48 The maximum statistical threshold value allowed as per the Recreational Water Quality Criteria for all fresh water body types designated for “primary contact recreational use” is 4.1 cfu mL−1 that still may cause 36 illness per 1000 recreators49. The guideline of Indian agency like Central Pollution Control Board allows <500 MPN 100 mL−1 and <5000 MPN 100 mL−1 for drinking water source and bathing, respectively. As per these regulations, none of the water bodies sampled in this study qualifies for being used as a source for drinking water even after conventional treatment and disinfection and/or recreational activities.
The prevalence of E. coli in STP ranged from 2893 to 96,393 cfu mL−1 with a reduction ratio of 14.53%, 31.45%, and 90.1% at S1, S2, and S3, respectively. Significant observations made are as follows: (i) all three STPs have different level of incoming fecal contamination as reflected by 4× and 20× prevalence at S1 and S3 than that of S2, (ii) E. coli reduction ratio depends on both prevalence and disinfection practices, and (iii) water at KL and several locations of the river shows the imprints of wastewater. The prevalence of E. coli noticed in the present study was similar to the influent of WWTP in southern Austria that ranged between 20,000 and 61,000 cfu mL−1 .16 A slight difference between total coliform and E. coli counts suggests that the STP water, both influent and treated, mainly comprised E. coli.
Occurrences of Antibiotic-Resistant Bacteria
Figure 1 illustrates the sensitivity towards six antibiotics used in this study. River locations R1 and R3 showed 0% antibiotic resistance, whereas location R2 showed 40% resistance towards all antibiotics, except 60% resistance for Kanamycin Monosulphate (KM) (Table 2). Similar to the case reported for Chaophraya River and its tributaries,28 the highest resistance in the Sabarmati was observed at the central urban location, (R2) between R1 and R3. It implies that the degree of resistance depends on urbanization and related discharge condition rather than the upstream condition. Among the lake samples, despite having 5× prevalence of E. coli at KL than CL, KL exhibited 0% resistance towards all six antibiotics, whereas CL showed up to 60% resistance for Tetracycline (TC), and ST, and 40% resistance to Norfloxacin (NFX). Such observation suggests that even if discharge received by CL has less E. coli, but most of them have already gained resistance before being discharged to the Lake. This is more likely, as CL occasionally receives runoff from Pirana open solid-waste dumping site.50

Bar diagram showing percentage sensitivity towards antibiotics (resistive, intermediate and sensitive) for (a) LVX, (b) CIP, (c) NFX, (d) KM, (e) TC, and (f) ST for three locations of Sabarmati River (R1–R3), Kankaria Lake (L1), Chandola Lake (L2), and three STPs (S1–S3) with I-influent, E-effluent.
Among STPs, the influent of S1 showed 40% resistance to a fluoroquinolone and 0% resistance to non-fluoroquinolone. High resistance for fluoroquinolone is usually reported for the influents of domestic origin,13,23 as they are generally prescribed to treat a variety of illnesses such as respiratory and urinary tract infections. Influent of S2 showed a 20% resistance to Levofloxacin (LVX), NFX, and TC, 40% resistance to KM but S3 influent showed 0% resistance to all antibiotics, except TC. Overall, there is no consistent pattern except the high resistance to fluoroquinolones as is the case with the Chaophraya River, Thailand, and its tributaries.28 Owing to high price affordability by urban dwellers, the resistance to fluoroquinolones was higher at urban locations, whereas location (L2) near slum areas exhibited higher resistance for cheaper non-fluoroquinolones (NFQs). In S1 and S2, resistance for some antibiotics increased after treatment, similar to the studies reported from Austria and Sweden.16,51
The abundance of E. coli and antibiotic resistance had significantly increased from upstream to downstream in Zenne River, Belgium, especially after the confluence of Brussel’s WWTPs discharge.52 The municipal wastewater containing high density and diversity of bacteria, nutrients, exposure of antibiotics, chlorine, detergents, long retention time, and aeration enhances the generation and replication of ARB. The most probable reason for the increase in resistance may be longer contact time with the wastewater.53 Overall, the ARB and ARG increment or decrement or any substantial change is truly an unpredictable outcome in the treatment process.54
Comparative Evaluation of Urban Water Bodies
A box plot for the gross comparison of antibiotic resistance in different water resources of the city has been provided in Fig. 2a. The E. coli resistance to TC was not found in the effluent of STPs hinting at efficient removal of TC with soil and sediment during primary treatment. As TC does not show any biodegradation during the biodegradability test, sorption is expected to be the main process of TC removal in activated sludge-based treatment process.55 Thus, the fate and transport of TC are greatly influenced by strong adsorption to clay materials,56 soils, and sediments.57,58,59 Resistance to fluoroquinolone (LVX, Ciprofloxacin (CIP), and NFX) was found higher in the river and influent of STPs, whereas the resistance to LVX and CIP was not found in lakes. This result may be attributed to the consumption pattern of antibiotics in the urban area as well as seasonality. This holds true due to the fact that fate and transport of Fluoroquinolone are not only affected by adsorption59,60 but photo-degradation and biodegradation too.61 This is also why the resistance of CIP was found to be decreased in STPs.62,63 There are reports of antimicrobial removal agents in WWTPs through biodegradation and/or sorption.10,64 Therefore, the chemical properties of antimicrobial agents are going to be the governing factors for the extent of antimicrobial resistance in the STPs.

The comparison in the different water source, i.e., river, lake, STPs influent and effluent for (a) antibiotic resistance and (b, c) metal.
Further, to compare the status of anthropogenic impacts, the status of metal pollution in these water bodies was also investigated. CL exhibits the highest concentration of metal (Fig. 2b, c), with Pb and As being even higher than the acceptable limit (Indian Standard IS 10500:2012). This may be attributed to leachate received by lake from Pirana open solid-waste dumping site and anthropogenic sources.65,66 Trend of average metal concentrations in rivers, lakes, and STPs were similar, i.e., Cr > Ni > Mn > Cu > Pb > Co ≥ As, implying the same source of pollution, i.e., runoff.67 Interestingly, Zn and Cd concentrations were lower, and Ni and Cr were higher than the acceptable limit for drinking water in all the samples.68 Sewage seems to be the sources of Co, Mn, and Pb into the river water,69 whereas Cr seems to be attributed from laundry chemicals, mordents, and dyes in the textiles, leather tanning industry, road runoff due to tire wear, pigments, and paints.70 Although the exhaustive use of fertilizers in agricultural imparts metals such as Zn, Ni, As, Cd, Pb, and Hg, it is worth mentioning that the average concentrations of Mn, Zn, Cu, Cd, Cr, Ni, and Pb in the Ganga River, India, in three different seasons varied from 132 to 423, 63 to 84, 5 to 6, 1 to 3, 14 to 20, 30 to 60, and 7 to 20 µg L−1, respectively.71
Correlation between Occurrence of Resistance and Prevalence of E. coli
Few correlations in the field of ARB/ARG research are still being investigated, such as the relationship between the resistance and the consumption of antibiotics;72,73,74 correlations between the concentration of antibiotics present in the water and similar prevalence of ARG and ARB;75,76 and prevalence of E. coli and extent of ARB. A study reported an association between antibiotic residues in sewage effluent and the presence of antibiotic-resistant pathogens.77 However, no effort has been made to investigate the later correlation among different water bodies. Thus, all the resistance observed for all six antibiotics studied were plotted against their corresponding E. coli count and classified as per their origin, i.e., river, lake, and STP, to evaluate the relation between the prevalence of E. coli and their resistance (Fig. 3a). Interestingly, the correlation observed for river was significantly higher (R2 = 0.89) than that of lake (R2 = 0.32) and STP (R2 = 0.12). Definitely, in the present case, lack of flow in the Sabarmati river is responsible for higher correlation for river, yet the finding is subjected to further monitoring.

Trend showing antibiotic resistance percentage with prevalence of E. coli (a) separately in river (R2 = 0.894), lake (R2 = 0.320), and STP (R2 = 0.115), (b) combined in river, lake, and STP with polynomial of 4° (R2 = 0.395), (c) combined in river, lake, and STP with linear relationship (R2 = 0.008).
The overall trend for all samples together irrespective of their origin, shown in Fig. 3b exhibited R2 = 0.40 and a polynomial relation of antibiotic resistance expressed up to the power of 4 of the prevalence. For linear fitting for the same, however, we get almost no relation, i.e., R2 = 0.008 (Fig. 3c). Similar weak linear correlation (R2 = 0.003–0.07) was reported between the antibiotic concentration and numbers of resistance genes/bacteria by Gao et al.76 Such weak linear relationships can be explained by the following: (i) prevalence of E. coli is indicator of fecal pollution but not the amount of antibiotic used or their resistance ability; (ii) an antibiotic-free water body provides a better place for E. coli growth; (iii) at STPs, the bacteria got concentrated in sludge and require higher concentration of chlorine for being killed;78 and (iv) the number of colonies was found to be decreased by 99.999% of multi-drug resistant within 60 min of contact time with the chlorine dosage >2.0 mg L−1.79,80 These explanations need to be further substantiated through rigorous monitoring and further statistical analyses using regional and worldwide data.
Microplastic Contamination
Microplastic was ranging from as small as 75 µm to 212 µm and then 212 µm to 4 mm, respectively, from the Sabarmati River sediments. The most startling fact was that microplastics were not found in the upstream of Ahmedabad city and gradually increased after entering to the city with the highest amount of microplastic detected in the vicinity of Pirana landfill. At Pirana-Gyaspur bank of the river, 47.1 mg of microplastics of large category (Fig. 4a) and 4 mg of small-sized microplastic particles were found (Fig. 4b). More specifically, location US1 before the entrance in the city showed a negligible abundance of microplastics in the sediment (Fig. 4a, b). US2 location had exhibited an increase in abundance and the maximum quantity of microplastics was observed at US3 near to Pirana dumping site. The source of microplastics was illegal dumping.81 This particular location of US3 showed a seven-time increase in quantity compared with location US2. This location was very near to the location the highest antibiotic resistance was noticed.

Microplastic (a) 75–212 µm, (b) 212 µm−4 mm at various location US1–IITGN campus, US2–Indira Bridge, US3–Subhash Bridge before the location R1, and DS1–Gyaspur after the location R3.
Improper waste disposal, insufficient waste management, urban runoffs, and washing machine effluent are supposed to be the significant sources of microplastic in an urban setup like Ahmedabad.44,45,47 Larger plastic debris that degrades into smaller pieces while being exposed to the sun and weathering also adds to the microplastic generation. Pirana solid-waste dumping site adds a huge quantity of microplastics through runoff, especially during wet weather.
Water Quality Influence on Antibiotic Resistance through Multivariate Analyses
Bivariate statistical relation i.e. correlation matrix (Table S3) was not enough to delineate the relationship between traditional water quality parameters and emerging issue of antibiotic resistance. Therefore, multivariate statistical analyses like principle component analysis (PCA) and cluster analyses were performed and presented in Fig. 5a, b. Table 3 shows four principle components (PCs) explaining 71% of cumulative data variance. Several authors use X–Y plot of the first two PCA loading for visual interpretation; however, if first two loadings are <50%, it is always recommended to use 3D loading expressions for more robust visual interpretation.
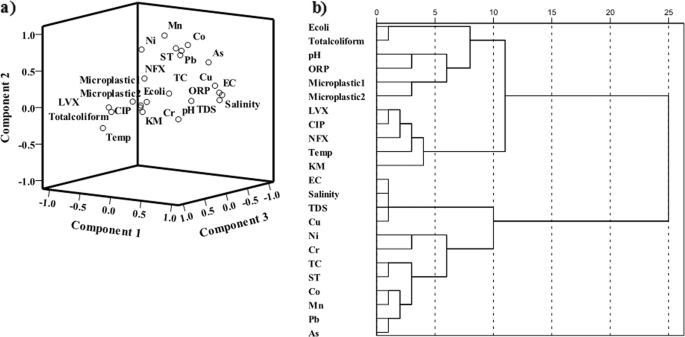
a Three-dimensional principal component diagram, (b) cluster analysis of river, lake, and STP antibiotic resistance percentage with prevalence of E. coli, in-situ parameter, and metal (Microplastics1: 75–212 µm, Microplastics2: 212 µm–4 mm).
In general, 50% of the variation could be explained by EC, TDS, salinity, metal (Cu, As, Pb, Co, Mn, and Ni), and antibiotic resistance for ST and TC. Fluoroquinones resistance and fecal contamination are represented by PC3 and PC4, respectively, explaining ~25% of the variation in the data. The first component (PC1) loading does not exhibit any significant loading for antibiotic resistance but for EC, TDS, salinity, Cu, and As, implying that metal contamination is the first problem in the area. Simultaneously high component loadings for metal as well as for antibiotic resistance exhibit the presence of cross-resistance between ST and TC similar to various other studies.28,82 This also indicated that people are suffering more from intestinal infection and KM seems to be not in much use. The third component (PC3) represented by LVX, CIP, NFX, and temperature implies resistance to fluoroquinolones and cross-resistance within this class as reported in the previous study.28,83,84 The loading of three fluoroquinolones with temperature is an interesting result, as it hints at common usage of these antibiotics during monsoon/summer and further relates to runoff introduced contamination in the urban waters. Principle component 4 shows higher loading for E. coli and total coliform, accounting 11% variance in the data, which substantiates the fact that the percentage of antibiotics resistance is not correlated with the prevalence of E. coli. Among the two types of microplastic, only the smaller size (microplastic 1) shows the loading of 0.34 and 0.39 in PC3 and PC4, implying they are aligning towards antibiotic resistance and fecal contamination. The relationship between microplastic and antibiotic resistance needs to be further investigated in the urban water resources. This is especially because the microplastic cannot be removed by primary or secondary treatment plants, owing to their small size and buoyancy, and thus become critical from the safe water-supply perspective.
Likewise, cluster analyses further explain the association of water quality parameters, the prevalence of E. coli, total coliform, microplastic, and antibiotic resistance. Three major groups are clearly evident in the dendrogram (Fig. 5b), starting from the most significant cluster at the bottom comprising EC, TDS, salinity, metal, and resistance for TC and ST. This cluster is highly dominated by industrial effluents leading to metal contamination related to dissolved solids and first-generation antibiotics mainly used in animal husbandry. Resistance for the remaining four antibiotics tested in this study clustered together with temperature, which showed closer association with another cluster comprising fecal coliform, microplastic, pH, and ORP. Thus, it may be the inference that among water quality pH and ORP are more sensitive parameters for antibiotic resistance. Overall, it can be concluded that resistance for fluoroquinolones are attributed to fecal pollution catalyzed by high, untreated runoff mixing to the urban water bodies during monsoon season, and the resistance for ST and TC are mainly due to their prevalent use for animal husbandry.
The higher prevalence of E. coli and its antibiotics resistance indicate deteriorated water quality of Sabarmati riverfront, KL, and CL due to the dynamic river–human interface, point sources of wastewater discharge, and stagnant water. Rivers themselves have a self-purification mechanism, but limited water supply in riverfront leads to stagnancy and more human interference leads to higher resistance. For the lake like a closed system, E. coli prevalence mainly depends upon the fecal contamination, whereas for antibiotic resistance, the condition of the catchment is also essential. In CL, prevalence is very less compared with KL, but has a relatively higher antibiotic resistance, which is due to nearby dumping site and slum areas. The antibiotics resistance shows no significant correlation with E. coli prevalence, indicating the need to include resistance as a necessary biological water quality parameter. Microplastic of smaller size showed some association and influence on antibiotic prevalence; however, this relationship needs to be further investigated in the urban water resources. Variation in various in-situ parameters shows an increment towards a specific form of resistance, which can be affirmed via further research and experimentation. The wastewater containing antibiotics should be discharged after proper tertiary treatment. Further research should be carried out to understand different methods, their efficiency, reasonable cost for removal of antibiotics, and disinfection of pathogenic bacteria, so that optimum drinking water quality to the people of developing countries like India could be maintained and the United Nations Sustainable Development Goals may be realized.
Methods
Study Area
Ahmedabad is the seventh largest city of India in terms of population and an industrial hub with the presence of several sectors such as pharmaceutical, electronics, electrical appliances, chemicals, metal products, passenger cars, textiles, plastics, machinery, and engineering. It is located on the banks of the Sabarmati River, one of the monsoon-fed major rivers of the western India that originates in the Aravalli hills of Rajasthan and has basin areas in Rajasthan and Gujarat. An area of 60,000 m2 in Sabarmati riverfront, spread between Sardar Bridge and Ellis Bridge on the West Bank, has been designated for hosting events like the Kite festival, the Marathon, the Cyclothon, and Garib Kalyan Mela (for the urban poor).
Among the other water bodies, the KL is a multi-sided artificial lake with 34 sides with 64 × 104 m2 catchment area with an average depth of 6–7 m.48 The lake is a recreational center surrounded by parks, zoo, boat club, children’s gardens, gymnasium, tethered balloon complex, open-air theater, and natural history museum. Hence, the human interface is expected to be quite active. Most importantly, it has an urban catchment area with stormwater drains as its water resource. The largest lake of Ahmedabad is CL, also a man-made lake with the circular form which has now been transformed into a dry dust bowl. The water in CL is supplied through Kharicut canal. Slums and multiple small-scale industries surround it. Extensive activities of washing and coloring of clothes are carried out in the vicinity of the lake. Untreated wastewater from the industries and surrounding slums is discarded into the lake.85 Among the STPs, Jaspur (S1), Chankheda (S2), and STP Juhapura (S3) were sampled. STP S1 with 70 and STPs S2 and S3 are with 35 million litres per day treatment capacities. The technology used in all three STPs is the Activated Sludge Process. Effluents of S1 are used for wastewater irrigation for a gross area of 1834 ha86 and effluent from S2 is used for wastewater irrigation. The effluent of S3 is released into the Sabarmati river post treatment.
Sample collection and analyses
The samples were collected from different locations (n = 11) in Ahmedabad city, India, on 23 June 2018. Three locations were selected from Sabarmati River representing upstream (R1), midstream (R2), and downstream (R3), two lakes, KL (L1) and CL (L2), and three STPs from Jaspur (S1), Chankheda (S2), and Juhapura (S3) (Fig. 6). The samples were collected in sterile bottles (Tarson-546041) of medical grade, which were then stored in an icebox until their transfer to the laboratory. A multi-parameter probe, HANNA HI9828 was used for onsite measurement of pH, EC, ORP, salinity, and TDS. For metal analysis, the sample was collected in polyethene bottles. The samples were filtered using 0.45 µm filters and preserved using 2% of concentrated HNO3. Samples were analyzed for metal by APHA 2005 using inductively coupled plasma–mass spectrometry (PerkinElmer’s NexION® 2000).87,88,89

Map showing sampling locations in Ahmedabad, Gujarat (i) upstream (R1), midstream (R2), and downstream (R3) of Sabarmati River, (ii) Kankaria Lake (L1), (iii) Chandola Lake (L2), and (iv) three different Sewage Treatment Plants (STPs) (S1–S3).
Isolation of E. coli
Water samples were diluted by appropriate tenfold serial dilution steps using phosphate-buffered water with 0.8–0.85% NaCl solution considering the anticipated E. coli prevalence. The 100 mL of samples were filtered by a sterile 0.45 µm membrane (47 mm diameter, ADVANTEC®) cellulose membrane filter. The Chromocult® Coliform Agar ES, (Merck Microbiology, Darmstadt, Germany) was prepared following the manufacturer’s instructions. Agar solution is then poured into the Petri plates which once being solidified, after that filter paper placed on that. The Petri plates were inverted and incubated at 37 °C for 24 h. The number of colonies was counted in each plate and an average of three plates was taken. To maintain aseptic condition all the process done in the biosafety cabinet with proper use of flame and 70% ethanol.
Antibiotic susceptibility test
Six antibiotics viz. KM, TC, NFX, CIP, LVX, and ST (Supplementary Table S1) were tested for their resistance in E. coli. Susceptibility of each E. coli isolates was tested for antibiotic using the Kirby-Bauer method.28 Twenty similar colonies from each growth Petri plate were transferred with the sterile colony picker and re-suspended in 4–5 mL of Tryptic Soya Broth (HiMedia Laboratories Pvt. Ltd, Mumbai) in sterile 15 mL centrifuge tubes. The tubes were then incubated at 35.5 °C for 18 h. For antibiotic resistance, the PERLCORE® Sensitivity Test (ST) Agar (EIKEN Chemical Co., Ltd, Tokyo) was prepared according to the manufacturer’s protocol. Then the agar was poured into sterile 90 mm Petri dishes. After the agar was set, the prepared E. coli culture was smeared on ST agar with a sterile cotton swab. After 3–5 min, antibiotic disks (KB Disk®, EIKEN Chemical Co., Ltd, Tokyo) were placed on the ST agar using disk dispenser maintaining a distance of minimum 24 mm between disks. The dishes were placed in a preheated incubator (37 °C) within 15 min of placing the disks. After incubation for 16–18 h, the diameter of growth inhibition of the E. coli was measured with antibiotic zone scale. The E. coli isolates were classified as resistant, intermediate, and sensitive according to the measured diameter. The resistance level of the colonies can be assessed using the criteria provided in Supplementary Table S2.
Microplastic
River samples collected were analyzed for microplastic by Nel et al.90 and Klein et al.,91 grain size distribution by dry sieving, and organic matter content by loss on ignition test. To quantify the abundance of small plastics, the river sediments were sampled at four stations. At each station, 2.5 kg samples were collected using a stainless-steel scoop from the upper 5 cm layer. The sediments were dried in an oven at 50 °C for 48–72 h, until a constant weight was reached, and sorted according to size. To reduce the risk of sample contamination such as clothing fibers during on-board recovery, samples were held against the wind to avoid any airborne contamination. In the laboratories, samples were first run through a stacked series of metal sieves (5 mm, 2 mm, and 212 μm) with Milli-Q water. Pieces of biological organic material sized >5 mm were rinsed and discarded. All fractions were kept at 5 °C. To 1 kg of the sieved sediment were transferred into a glass beaker by rinsing with local Milli-Q water and subsequently stored in 10% NaCl in glass jars for conservation. Contents were stirred vigorously to disaggregate and suspend plastic particles for 1 h and allowed to settle for 24 h. The supernatant solution was filtered through Whatman GF/A.92 The filters were dried at room temperature and sealed in Petri dishes. The microplastics upon the mesh were carefully rinsed with distilled water into clean Petri dishes. The samples were then visually sorted at ×50 magnifications, whereby all possible microplastic particles were enumerated. Microplastic particles were identified by possessing unnatural colouration and/or unnatural.93 The scanning electron microscope analysis carried out for each location.
Statistical Analyses
The statistical package SPSS 21 was used to carry out the multivariate analyses, i.e., PCA and hierarchical cluster analysis after performing the normalization by obtaining Z-score for each parameter, i.e., subtracting the mean of the parameter from individual value and then dividing with standard deviation. Varimax rotation, an orthogonal mode of rotation, was used to generate the non-related PCs.87,94 Results were then tabulated with component loadings, eigenvalue, %, and cumulative variance explaining up to 86% of variations is observed in the dataset. On the other hand, cluster analyses showed proximity among the analyzed parameters of all the samples.
Data Availability
All other relevant data are available from the corresponding author on request.
References
Chatterjee, S. K., Bhattacharjee, I. & Chandra, G. Water quality assessment near an industrial site of Damodar River, India. Environ. Monit. Assess. 161, 177–189 (2010).
Rodriguez-Mozaz, S. et al. Occurrence of antibiotics and antibiotic resistance genes in hospital and urban wastewaters and their impact on the receiving river. Water Res. 69, 234–242 (2015).
Baker-Austin, C., Wright, M. S., Stepanauskas, R. & McArthur, J. V. Co-selection of antibiotic and metal resistance. Trends Microbiol. 14, 176–182 (2006).
Kühn, I. et al. Occurrence and relatedness of vancomycin-resistant enterococci in animals, humans, and the environment in different European regions. Appl. Environ. Microbiol. 71, 5383–5390 (2005).
Ferreira Da Silva, M. et al. Antimicrobial resistance patterns in Enterobacteriaceae isolated from an urban wastewater treatment plant. FEMS Microbiol. Ecol. 60, 166–176 (2007).
Jiang, L. et al. Prevalence of antibiotic resistance genes and their relationship with antibiotics in the Huangpu River and the drinking water sources, Shanghai, China. Sci. Total Environ. 458–460, 267–272 (2013).
Klein, E. Y. et al. Global increase and geographic convergence in antibiotic consumption between 2000 and 2015. Proc. Natl Acad. Sci. USA 115, E3463–E3470 (2018).
Van Boeckel, T. P. et al. Global trends in antimicrobial use in food animals. Proc. Natl Acad. Sci. USA 112, 5649–5654 (2015).
GARP. Rationalizing antibiotic use to limit antibiotic resistance in India + Rationalizing antibiotic use to limit antibiotic resistance in India. Indian J. Med. Res. 134, 3193708 (2011).
Kümmerer, K. Antibiotics in the aquatic environment - a review - Part I. Chemosphere 75, 417–434 (2009).
Zheng, S. et al. Antibiotics pollution in Jiulong River estuary: source, distribution and bacterial resistance. Chemosphere 84, 1677–1685 (2011).
Zhang, S. et al. Fate of antibiotic resistant cultivable heterotrophic bacteria and antibiotic resistance genes in wastewater treatment processes. Chemosphere 135, 138–145 (2015).
Threedeach, S. et al. Antibiotic resistance of Escherichia coli in leachates from municipal solid waste landfills: comparison between semi-aerobic and anaerobic operations. Bioresour. Technol. 113, 253–258 (2012).
Storteboom, H., Arabi, M., Davis, J. G., Crimi, B. & Pruden, A. Tracking antibiotic resistance genes in the South Platte River basin using molecular signatures of urban, agricultural, and pristine sources. Environ. Sci. Technol. 44, 7397–7404 (2010).
Da Costa, P. M., Vaz-Pires, P. & Bernardo, F. Antimicrobial resistance in Enterococcus spp. isolated in inflow, effluent and sludge from municipal sewage water treatment plants. Water Res. 40, 1735–1740 (2006).
Reinthaler, F. F. et al. Antibiotic resistance of E. coli in sewage and sludge. Water Res. 37, 1685–1690 (2003).
Al-Judaibi, E. Infection and antibiotic resistant bacteria in developing countries: a genetic review. J. Microbiol. Res. 4, 10–17 (2014).
Chee-Sanford, J. C. et al. Occurrence and diversity of tetracycline resistance genes in lagoons and groundwater underlying two swine production facilities. Appl. Environ. Microbiol. 67, 1494–1502 (2001).
Silva, J., Castillo, G., Callejas, L., López, H. & Olmos, J. Frequency of transferable multiple antibiotic resistance amongst coliform bacteria isolated from a treated sewage effluent in Antofagasta, Chile. Electron. J. Biotechnol. 9, 533–540 (2006).
Miranda, C. D. & Castillo, G. Resistance to antibiotic and heavy metals of motile aeromonads from Chilean freshwater. Sci. Total Environ. 224, 167–176 (1998).
Marcinek, H., Wirth, R., Muscholl-Silberhorn, A. & Gauer, M. Enterococcus faecalis gene transfer under natural conditions in municipal sewage water treatment plants. Appl. Environ. Microbiol. 64, 626–632 (1998).
Suidan, M. T. et al. Challenges in biodegradation of trace organic contaminants—gasoline oxygenates and sex hormones. Water Environ. Res. 77, 4–11 (2005).
Auerbach, E. A., Seyfried, E. E. & McMahon, K. D. Tetracycline resistance genes in activated sludge wastewater treatment plants. Water Res. 41, 1143–1151 (2007).
Kümmerer, K. Resistance in the environment. J. Antimicrob. Chemother. 54, 311–320 (2004).
Na, G. et al. The effect of environmental factors and migration dynamics on the prevalence of antibiotic-resistant Escherichia coli in estuary environments. Sci. Rep. 8, 1–9 (2018).
Yang, Y., Xu, C., Cao, X., Lin, H. & Wang, J. Antibiotic resistance genes in surface water of eutrophic urban lakes are related to heavy metals, antibiotics, lake morphology and anthropic impact. Ecotoxicology 26, 831–840 (2017).
Hoa, P. T. P. et al. Antibiotic contamination and occurrence of antibiotic-resistant bacteria in aquatic environments of northern Vietnam. Sci. Total Environ. 409, 2894–2901 (2011).
Honda, R. et al. Impacts of urbanization on the prevalence of antibioticresistant Escherichia coli in the Chaophraya River and its tributaries. Water Sci. Technol. 73, 362–374 (2016).
Akhter, A., Imran, M. & Akhter, F. Antimicrobial resistant coliform bacteria in the Gomti river water and determination of their tolerance level. Bioinformation 10, 167–174 (2014).
Bhattacherjee, J. W., Pathak, S. P. & Gaur, A. Antibiotic resistance and metal tolerance of coliform bacteria isolated from Gomati River water at Lucknow city. J. Gen. Appl. Microbiol. 34, 391–399 (1988).
Biswas, K., Paul, D. & Sinha, S. N. Prevalence of multiple antibiotic-resistant coliform bacteria in the water of river Ganga. Sci. Publ. Gr. 1, 44 (2015).
Mukherjee, S. & Chakraborty, R. Incidence of class 1 integrons in multiple antibiotic-resistant Gram-negative copiotrophic bacteria from the River Torsa in India. Res. Microbiol. 157, 220–226 (2006).
Andrady, A. L. Microplastics in the marine environment. Mar. Pollut. Bull. 62, 1596–1605 (2011).
Andrady, A. L. & Neal, M. A. Applications and societal benefits of plastics. Philos. Trans. R. Soc. B Biol. Sci. 364, 1977–1984 (2009).
Barnes, D. K. A., Galgani, F., Thompson, R. C. & Barlaz, M. Accumulation and fragmentation of plastic debris in global environments. Philos. Trans. R. Soc. B Biol. Sci. 364, 1985–1998 (2009).
Thompson, R. C. et al. Lost at sea: where is all the plastic? Science (80) 304, 838 (2004).
Law, K. L. et al. Plastic accumulation in the North Atlantic gyre. Sci. Xpress 19, 8 (2010).
Claessens, M., Van Cauwenberghe, L., Vandegehuchte, M. B. & Janssen, C. R. New techniques for the detection of microplastics in sediments and field collected organisms. Mar. Pollut. Bull. 70, 227–233 (2013).
Anderson, J. C., Park, B. J. & Palace, V. P. Microplastics in aquatic environments: Implications for Canadian ecosystems. Environ. Pollut. 218, 269–280 (2016).
United Nations Environmental Programme (UNEP) Dutch Rally Support for a Europe Wide Microplastic Ban. (2015). http://www.unep.org/NewsCentre/default.aspx?DocumentID=2817&ArticleID=11120. Accessed Jan 2019.
Stepanauskas, R. et al. Coselection for microbial resistance to metals and antibiotics in freshwater microcosms. Environ. Microbiol. 8, 1510–1514 (2006).
Kumar, M., Chaminda, T., Honda, R. & Furumai, H. Vulnerability of urban waters to emerging contaminants in India and Sri Lanka: resilience framework and strategy. APN Sci. Bull. 9, 57–66 (2019).
Imran, M., Das, K. R. & Naik, M. M. Co-selection of multi-antibiotic resistance in bacterial pathogens in metal and microplastic contaminated environments: an emerging health threat. Chemosphere 215, 846–857 (2019).
Arias-Andres, M., Klümper, U., Rojas-Jimenez, K. & Grossart, H.-P. Microplastic pollution increases gene exchange in aquatic ecosystems. Environ. Pollut. 237, 253–261 (2018).
Hamner, S. et al. Isolation of potentially pathogenic Escherichia coli O157:H7 from the Ganges River. Appl. Environ. Microbiol. 73, 2369–2372 (2007).
Hu, J. et al. Phenotyping and genotyping of antihiotic-resistant Escherichia coli isolated from a natural river basin. Environ. Sci. Technol. 42, 3415–3420 (2008).
Trivedi, R. C. Water quality of the Ganga River - an overview. Aquat. Ecosyst. Heal. Manag. 13, 347–351 (2010).
Kumar, A. & Sharma, M. P. Application of water quality index and diversity index for pollution assessment of Kankaria Lake at Ahmedabad, India. J. Civ. Environ. Eng. 4, 1 (2014).
EPA. Recreational Water Quality Criteria. U. S. Environ. Prot. Agency 1–69, 820-F-12-058 (2012).
Singh, U. K. et al. Assessment of the impact of landfill on groundwater quality: a case study of the Pirana site in western India. Environ. Monit. Assess. 141, 309–321 (2008).
Flach, C.-F., Genheden, M., Fick, J. & Joakim Larsson, D. G. A comprehensive screening of Escherichia coli isolates from Scandinavia’s largest sewage treatment plant indicates no selection for antibiotic resistance. Environ. Sci. Technol. 52, 11419–11428 (2018).
Proia, L. et al. Antibiotic resistance along an urban river impacted by treated wastewaters. Sci. Total Environ. 628–629, 453–466 (2018).
Sulfikar, Honda, R., Noguchi, M., Yamamoto-Ikemoto, R. & Watanabe, T. Effect of sedimentation and aeration on antibiotic resistance induction in the activated sludge process. J. Water Environ. Technol. 16, 94–105 (2018).
Bouki, C., Venieri, D. & Diamadopoulos, E. Detection and fate of antibiotic resistant bacteria in wastewater treatment plants: a review. Ecotoxicol. Environ. Saf. 91, 1–9 (2013).
Kim, S., Eichhorn, P., Jensen, J. N., Weber, A. S. & Aga, D. S. Removal of antibiotics in wastewater: effect of hydraulic and solid retention times on the fate of tetracycline in the activated sludge process. Environ. Sci. Technol. 39, 5816–5823 (2005).
Sithole, B. B. & Guy, R. D. Models for tetracycline in aquatic environments. Water Air. Soil Pollut. 32, 303–314 (1987).
Rabølle, M. & Spliid, N. H. Sorption and mobility of metronidazole, olaquindox, oxytetracycline and tylosin in soil. Chemosphere 40, 715–722 (2000).
Le Bris, H. Sorption of oxolinic acid and oxytetracycline to marine sediments. Chemosphere 33, 801–815 (1996).
Pan, M. & Chu, L. M. Adsorption and degradation of five selected antibiotics in agricultural soil. Sci. Total Environ. 545–546, 48–56 (2016).
Nowara, A., Burhenne, J. & Spiteller, M. Binding of fluoroquinolone carboxylic acid derivatives to clay minerals. J. Agric. Food Chem. 45, 1459–1463 (1997).
Torniainen, K., Tammilehto, S. & Ulvi, V. The effect of pH, buffer type and drug concentration on the photodegradation of ciprofloxacin. Int. J. Pharm. 132, 53–61 (1996).
Al-Ahmad, A., Daschner, F. D. & Kümmerer, K. Biodegradability of cefotiam, ciprofloxacin, meropenem, penicillin G, and sulfamethoxazole and inhibition of waste water bacteria. Arch. Environ. Contam. Toxicol. 37, 158–163 (1999).
Liao, X. et al. Biodegradation of antibiotic ciprofloxacin: pathways, influential factors, and bacterial community structure. Environ. Sci. Pollut. Res. 23, 7911–7918 (2016).
Golet, E. M., Xifra, I., Siegrist, H., Alder, A. C. & Giger, W. Environmental exposure assessment of fluoroquinolone antibacterial agents from sewage to soil. Environ. Sci. Technol. 37, 3243–3249 (2003).
Hussain, J., Husain, I., Arif, M. & Gupta, N. Studies on heavy metal contamination in Godavari river basin. Appl. Water Sci. 7, 4539–4548 (2017).
Dixit, S. & Tiwari, S. Impact assessment of heavy metal pollution of Shahpura Lake, Bhopal, India. Int. J. Environ. Res. 2, 37–42 (2008).
Nagajyoti, P. C., Lee, K. D. & Sreekanth, T. V. M. Heavy metals, occurrence and toxicity for plants: a review. Environ. Chem. Lett. 8, 199–216 (2010).
WHO. Guidelines for drinking-water quality: fourth edition incorporating first addendum, 4th edn + 1st add. https://doi.org/10.1016/S1462-0758(00)00006-6 (World Health Organization, 2017).
Dragun, Z., Roje, V., Mikac, N. & Raspor, B. Preliminary assessment of total dissolved trace metal concentrations in Sava River water. Environ. Monit. Assess. 159, 99–110 (2009).
Kumar, M. et al. Review of perspective, problems, challenges, and future scenario of metal contamination in the urban environment. J. Hazard. Toxic. Radioact. Waste 21, 04017007 (2017).
Kar, D., Sur, P., Mandal, S. K., Saha, T. & Kole, R. K. Assessment of heavy metal pollution in surface water. Int. J. Environ. Sci. Technol. 5, 119–124 (2008).
Yang, Y. et al. Antibiotics and antibiotic resistance genes in global lakes: A review and meta-analysis. Environ. Int. 116, 60–73 (2018).
Thai, P. K. et al. Occurrence of antibiotic residues and antibiotic-resistant bacteria in effluents of pharmaceutical manufacturers and other sources around Hanoi, Vietnam. Sci. Total Environ. 645, 393–400 (2018).
Khan, G. A., Berglund, B., Khan, K. M., Lindgren, P. E. & Fick, J. Occurrence and abundance of antibiotics and resistance genes in rivers, canal and near drug formulation facilities - a Study in Pakistan. PLoS ONE 8, 4–11 (2013).
Qiu, W. et al. Occurrence of antibiotics in the main rivers of Shenzhen, China: Association with antibiotic resistance genes and microbial community. Sci. Total Environ. 653, 334–341 (2019).
Gao, P., Munir, M. & Xagoraraki, I. Correlation of tetracycline and sulfonamide antibiotics with corresponding resistance genes and resistant bacteria in a conventional municipal wastewater treatment plant. Sci. Total Environ. 421–422, 173–183 (2012).
Lübbert, C. et al. Environmental pollution with antimicrobial agents from bulk drug manufacturing industries in Hyderabad, South India, is associated with dissemination of extended-spectrum beta-lactamase and carbapenemase-producing pathogens. Infection 45, 479–491 (2017).
Chitnis, V. et al. Bacterial population changes in hospital effluent treatment plant in central India. Water Res. 38, 441–447 (2004).
Ge, X., Zhang, N., Phillips, G. C. & Xu, J. Growing Lemna minor in agricultural wastewater and converting the duckweed biomass to ethanol. Bioresour. Technol. 124, 485–488 (2012).
Rizzo, L., Fiorentino, A. & Anselmo, A. Effect of solar radiation on multidrug resistant E. coli strains and antibiotic mixture photodegradation in wastewater polluted stream. Sci. Total Environ. 427–428, 263–268 (2012).
Wang, J. et al. Chemosphere microplastics in the surface sediments from the Beijiang River littoral zone: composition, abundance, surface textures and interaction with heavy metals. Chemosphere 171, 248–258 (2017).
Sayah, R. S., Kaneene, J. B., Johnson, Y. & Miller, R. Patterns of antimicrobial resistance observed in Escherichia coli isolates obtained from domestic-and wild-animal fecal samples, human septage, and surface water. Appl. Environ. Microbiol. 71, 1394–1404 (2005).
Sanders, C. C. Mechanisms responsible for cross-resistance and dichotomous resistance among the quinolones. Clin. Infect. Dis. 32, 1–8 (2001).
Davies, T. A. et al. Cross-resistance, relatedness and allele analysis of fluoroquinolone-resistant US clinical isolates of Streptococcus pneumoniae (1998–2000). J. Antimicrob. Chemother. 52, 168–175 (2003).
Pradeep, V., Deepika, C., Urvi, G. & Hitesh, S. Water quality analysis of an organically polluted lake by investigating different physical and chemical parameters. Int. J. Res. Chem. Environ. 2, 105–111 (2012).
Bhavin, B. et al. Study and modification of sewage treatment plant at Jaspur. Int. J. Innov. Res. Sci. Technol. 4, 118–123 (2018).
Kumar, M. et al. Concurrence of antibiotic resistant bacteria (ARB), viruses, pharmaceuticals and personal care products (PPCPs) in ambient waters of Guwahati, India: Urban vulnerability and resilience perspective. Sci. Total Environ. 21, 04017007 (2019).
Kumar, M., Furumai, H., Kurisu, F. & Kasuga, I. Evaluating the mobile heavy metal pool in soakaway sediment, road dust and soil through sequential extraction and isotopic exchange. Water Sci. Technol. 62, 920–928 (2010).
Kumar, M., Furumai, H., Kurisu, F. & Kasuga, I. Potential mobility of heavy metals through coupled application of sequential extraction and isotopic exchange: comparison of leaching tests applied to soil and soakaway sediment. Chemosphere 90, 796–804 (2013).
Nel, H. A., Dalu, T. & Wasserman, R. J. Sinks and sources: assessing microplastic abundance in river sediment and deposit feeders in an Austral temperate urban river system. Sci. Total Environ. 612, 950–956 (2018).
Klein, S., Worch, E. & Knepper, T. P. Occurrence and spatial distribution of microplastics in river shore sediments of the rhine-main area in Germany. Environ. Sci. Technol. 49, 6070–6076 (2015).
Reddy et al. of the small plastics fragments in marine sediments along the Alang-Sosiya ship-breaking yard, India. Estuar. Coast. Shelf Sci. 68, 656–660 (2006).
Hidalgo-Ruz, V., Gutow, L., Thompson, R. C. & Thiel, M. Microplastics in the marine environment: a review of the methods used for identification and quantification. Environ. Sci. Technol. 46, 3060–3075 (2012).
Kumar, M. et al. Hydrogeochemical controls on mobilization of arsenic and associated health risk in Nagaon district of the central Brahmaputra Plain, India. Environ. Geochem. Health 39, 161–178 (2017).
Acknowledgements
This study was supported by the Asia Pacific Network (APN) under the Collaborative Regional Research Program (CRRP2016-06MY-Kumar).
Author information
Authors and Affiliations
Contributions
Author contributions were as follows: Mk supervised and performed the entire interpretation, and prepared the final draft of the paper. BR collected the samples, performed the analyses, prepared all the diagram and table, and put up the first draft.
Corresponding author
Ethics declarations
Competing interests
The authors declare no competing interests.
Additional information
Publisher’s note Springer Nature remains neutral with regard to jurisdictional claims in published maps and institutional affiliations.
Supplementary information
Rights and permissions
Open Access This article is licensed under a Creative Commons Attribution 4.0 International License, which permits use, sharing, adaptation, distribution and reproduction in any medium or format, as long as you give appropriate credit to the original author(s) and the source, provide a link to the Creative Commons license, and indicate if changes were made. The images or other third party material in this article are included in the article’s Creative Commons license, unless indicated otherwise in a credit line to the material. If material is not included in the article’s Creative Commons license and your intended use is not permitted by statutory regulation or exceeds the permitted use, you will need to obtain permission directly from the copyright holder. To view a copy of this license, visit http://creativecommons.org/licenses/by/4.0/.
About this article

Cite this article
Ram, B., Kumar, M. Correlation appraisal of antibiotic resistance with fecal, metal and microplastic contamination in a tropical Indian river, lakes and sewage. npj Clean Water 3, 3 (2020). https://doi.org/10.1038/s41545-020-0050-1
Received:
Accepted:
Published:
DOI: https://doi.org/10.1038/s41545-020-0050-1
This article is cited by
-
Distribution of bacterial community structures and spread of antibiotic resistome at industrially polluted sites of Mini River, Vadodara, Gujarat, India
Environmental Monitoring and Assessment (2024)
-
Occurrence of antibiotics and antibiotic-resistant bacteria in the Lebanese polluted Litani River
Environmental Monitoring and Assessment (2024)
-
Investigation of microplastics and microplastic communities in selected river and lake basin soils of Thiruvananthapuram District, Kerala, India
Environmental Monitoring and Assessment (2024)
-
Landscape of global urban environmental resistome and its association with local socioeconomic and medical status
Science China Life Sciences (2024)
-
Assessment of pollution and risks associated with microplastics in the riverine sediments of the Western Ghats: a heritage site in southern India
Environmental Science and Pollution Research (2022)
