
Abstract
Tuning glass composition to obtain targeted properties generally relies on empirical approaches. However, a deep understanding of the physical and chemical mechanisms linking glass composition to its structure and properties would enable developing reliable predictive models. Indeed, although empirical models are usually able to interpolate composition–property relationships within a given compositional envelope, they often fail at extrapolating predictions far from their training domain. Here, as an alternative route to empirical models, we show that a structural descriptor based on the number of topological constraints per atom can be used to predict the initial dissolution rate of aluminosilicate and borosilicate glasses after being parameterized on different families of glasses (specific series of borosilicate glasses). Sixteen glasses belonging to these families were studied and their initial dissolution rates were determined at 90 °C and pH90 °C = 9, covering rates spanning over 5 orders of magnitude. The model based on topological constraints was trained based on seven select borosilicate glasses (R2 = 0.997) and used to predict the dissolution rate of nine additional borosilicate and aluminosilicate glasses. We show that, provided that corrections are made for high alkali content glasses that dissolve incongruently (preferential release of Na), the model gives reasonable predictions, even far from its training domain.
Introduction
Borosilicate and aluminosilicate glasses are widely used in our daily life as well as in industry1,2. Tuning their properties for a targeted application, i.e., glass design, requires a deep understanding of the relationships between their composition, structure, and properties3. For instance, in the nuclear industry, borosilicate glasses are designed to immobilize radioactive wastes4,5,6. Optimizing their chemical durability is of primary importance to ensure the safety of the waste disposal. In the glassware and pharmaceutical industries, both borosilicate and aluminosilicate glasses are designed to contain liquid that must not be contaminated by glass components7,8. In nature, aluminosilicate glasses are massively produced by volcanoes and oceanic ridges9. Their dissolution controls the budget of some key elements in the oceans10.
Glass alteration is a complex phenomenon involving surface reaction with water, transport of species toward both the glass surface and the bulk solution, condensation and precipitation reactions11. None of the models developed to date can predict the dissolution rate of a multicomponent glass just on the basis of its chemical composition. Two main reasons account for that: (i) for a given cation M of the glass, the energy barrier for the hydrolysis of a M–O bond depends on the state of protonation of the bridging O along with the M–O bond distance, the O–M–O bond angle, and local structural environment12,13. The bond distances and bond angles are generally in wide distribution in a glass. (ii) The medium range order can impact the transport and the reactivity of water molecules. The large number of variables make it almost impossible for a direct prediction from first principles data such as reaction energy barriers alone, at least to date.
To address such difficulties, topological constraint theory (TCT) provides a simplified framework to predict the properties of glasses based on the topology of their atomic network14,15,16. Recently, this approach has been used to predict the dissolution rate of silicate minerals and glasses under varying pH conditions17,18,19,20,21,22.
In this study we investigated the capability of a structural descriptor relying on the number of topological constraints per atom to predict the initial dissolution rate of borosilicate and aluminosilicate glasses. We selected a series of borosilicate glasses with the same Si/B, Si/Na ratios as the international simple glass (ISG), as well as additional glasses that are less and more polymerized, including B-free glasses (see the Methods section for more details). Among the tested glasses, three compositions are above the percolation threshold, that is, Na network modifiers can leach out prior to matrix dissolution, thereby leading to the formation of a Na-depleted hydrated silica layer that undergoes hydrolysis23. Experimentally, the initial dissolution rates were measured at 90 °C and pH 9 to ensure that the dissolution process is rate-controlled by the hydrolysis of the silicate network. Therefore, rates were measured from Si release into the solution. The structural descriptor used herein is the number of constraints per atoms, nc, which is derived from topological constraint theory14,16,24. The calculation of nc relies on simple rules derived from previous studies25,26,27,28. Following a machine learning approach29, the model was trained with seven borosilicate glasses belonging to a restricted domain (training set), while its predictions were tested on nine other glasses with compositions and dissolution rates that are far from the training range (test set). It is shown that the model provides reasonable predictions, except for glasses that dissolve incongruently.
Results and discussion
Experimental results
Table 1 displays the composition and some characteristics of the studied glasses. All the glasses are found to be homogeneous. Three high alkali content glasses, NSAC19, NSAC21, and NSAC35 have a ratio ΣAlcalis/ΣCations of 0.34, 0.38, and 0.49, respectively. These values are greater than the percolation threshold (0.31), as shown by Devreux and Kolb23. All the other glasses are below this threshold.
Experimental results of the leach tests are displayed on Fig. 1; Table 2. For all the tested glasses, a linear release of Si is observed, which signals that the matrix dissolution proceeded at a constant rate. As shown in Table 2, the pH did not significantly evolve during the tests—except for the glasses whose dissolution is the most incongruent (NBS36/21 and NSAC35). For these glasses, an increase in pH up to 9.5 caused by ion-exchange was noted—despite the addition of nitric acid during the test. The fraction of altered glass, FAG, given at the end of the tests in Table 2 remained low, yielding to very small surface correction. For all glasses, the y-intercepts are close to zero (except NBS36/21), which suggests that the glasses dissolved at the same rate since the beginning of the reaction. The case of NBS36/21 is peculiar because of its high dissolution rate. The fact that the y-intercept is not close to zero is due to the uncertainty on the slope.

Time dependence of normalized mass loss based on Si release for a NBS12/28, b NBS36/21, c NBS31/15, d NBS14/18, NBSCZ, NBSC, e NBSA, NBSAC, NBSACZ, NBSAZ, f NSAC19, NSAC35, g NSAC21, NSAC17, NSAC0, h NSA. Solid symbols refer to tests conducted with powder, whereas empty symbols are used for monoliths. a Comparison between powder and monolith. a–c Mass loss of the coupon at the end of the experiment (triangle) and normalized mass losses of Si.
For 11 glasses (NBSA, NBSAC, NBSACZ, NBSAZ, NBSC, NBSCZ, NSAC0, NSAC17, NSAC19, NSAC21, and NSAC35), the dissolution solutions were also analyzed by ICP-OES. Results are presented in SI 1. Overall, analyses of the first eight of these glasses show that the dissolution of the borosilicate glasses is congruent (i.e., all glass components are dissolved at the same rate—except Zr for Zr-bearing glasses, which was not detected in solution) and the rate values derived from these analyses are in fair agreement with those determined from UV–Visible spectrophotometry analyses. Conversely, the three high Na aluminosilicate glasses whose compositions are above the Na percolation threshold23—NSAC19, NSAC21, and NSAC35—dissolved incongruently. For those compositions, a slight (NSAC19), significant (NSAC21), and large (NSAC35) preferential release of Na was noticed. This phenomenon leads to the formation of a Na-depleted Al-and-Si-rich layer on the surface of the glass. When calculating the glass dissolution rate according to Si release, one actually determines the dissolution rate of this hydrated and potentially reorganized silicate alternated layer. This will be further discussed below.
Altogether, the high degree of dilution of the leaching solution, the linearity of the Si release, the low y-intercept, and the congruency of the dissolution for most of the tested materials ensure that glass dissolved at the highest dissolution rate in the tested conditions, it is acceptable to derive the initial dissolution rate r0 from a linear regression of NL(Si) vs. time. Results of this calculation are given in Table 2.
The following observations can be made:
-
Depending on glass composition, r0 varies over more than 5 orders of magnitude, which, to the best of our knowledge, represents the largest span of glass dissolution rates ever tested.
-
For NBS12/28, a comparison between powder and monolith was made to evaluate the hypothesis relative to the reactive surface area (Fig. 1a). That surface evaluation for the monolith was indeed based on simple but accurate geometric considerations (length, width and thickness were measured with a caliper), but that of the powder remained uncertain because of the complex, non-spherical shape of glass particles. It is found that, r0 of the monolith and r0 of the powder whose reactive surface area is a geometric one are similar within uncertainties. Hence, this result validated the choice of the geometric surface area (instead of that determined by gas adsorption) for the glass powders used in the dissolution testing, as suggested by previous studies30,31. One plausible explanation of this result is that the specific surface area measured by Brunauer, Emmet, and Teller (BET) method which usually gives a surface typically 2–3-fold greater than the geometric surface) takes into account the nanoscale roughness, which vanishes during dissolution.
-
The values of r0 determined from the mass loss of the coupons NBS12/28, NBS36/21, and NBS31/15 at the end of the experiments are in good agreement with the solution data (Fig. 2a–c). This gives credit to the rate determination.
Fig. 2: 11B MAS NMR spectra of all borosilicate glasses investigated in this study. 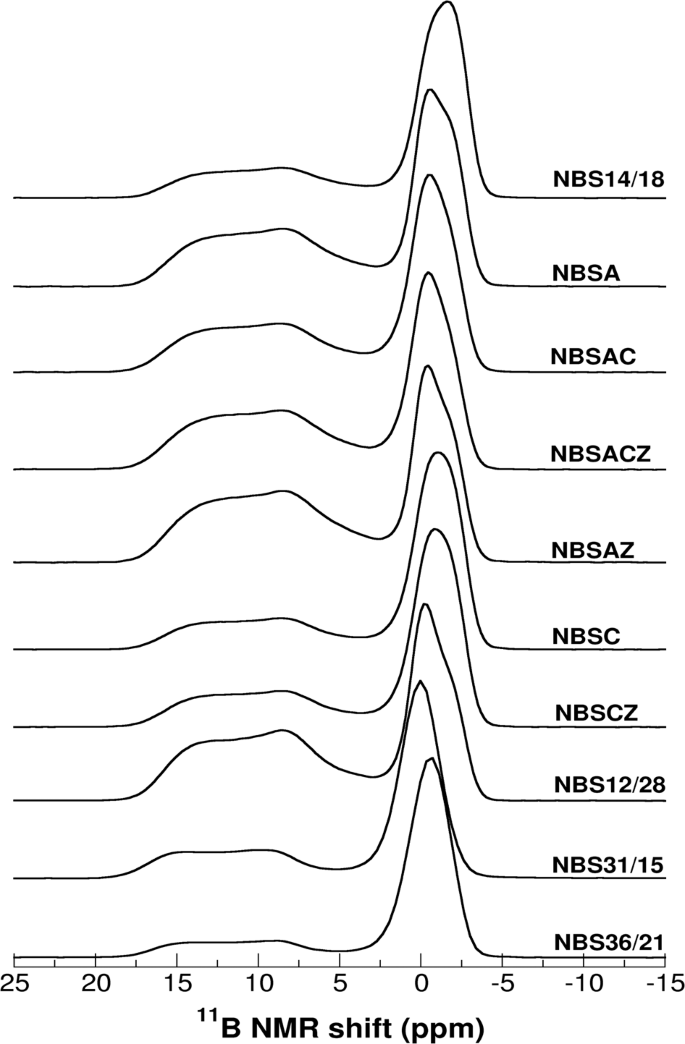
Spectra are normalized to the B4 peak (centered around 0 ppm).
-
Reproducibility of r0 measurement was studied for NBS14/18, NSAC17, NSAC19, and NSAC21 for which tests were performed 3, 2, 3, and 5 times, respectively. Slight, non-impactful variations of the protocols were applied, such as the change in the glass powder size fraction or the change of the operator (tests on NSAC21 were performed by three different operators). For the four tested glasses, the obtained values fall within uncertainties. Although the number of tests is not sufficient to perform a robust statistical analysis, nonetheless these sets of experiments confirm that the uncertainty of 30% on r0 taken in this study is reasonable.
-
The r0 value obtained for NBS14/18, NBSA, NBSAC, NBSACZ, NBSAZ, NBSC, and NBSZ are 2–6 times higher than that reported by Gin et al.32 in similar conditions. The main reason is that the release rates in the earlier report32 were normalized to the BET surface area of the glass powder. This can explain a factor 2–4. However, a factor 5.5 and 6.6 are calculated for NBSC and NBSZ, respectively. As these two glasses have the fastest dissolution rates of this set of glasses, it is possible that their rates were underestimated in the previous study due to an insufficient agitation of the solution. Indeed, it has been observed that agitation is a key parameter when measurements are conducted in static (no leachant renewal) conditions.
-
As noted above, glasses NSAC19, NSAC21, and NSAC35, whose composition are above the Na percolation threshold23, dissolved incongruently, with part of Na being released much faster than Si. According to their bulk composition (high Na content as modifier), NSAC35 should dissolve faster than NSAC0, NSAC17, NSAC19, and NSAC21, but, among these glasses, it seems to be the more durable. The most likely explanation is that, r0, which is determined from Si release, corresponds to the dissolution rate of the Na-depleted hydrated layer (in agreement with the large deviation to congruency).

Enumeration of the topological constraints
We calculated the number of constraints per atom nc for all the glasses considered herein by enumerating the number of bond-stretching (BS) and bond-bending (BB) constraints created by each element. Table 3 shows the number of BS and BB constraints created by each type of atomic species. Most of these values are derived from the coordination state of each atom. In details, Si and Al atoms are associated with four BS (i.e., with the four surrounding O atoms) and five BB constraints (i.e., the number of independent angles that need to be fixed to define the tetrahedral angular environment). Similarly, 3-fold coordinated B atoms (BIII) are associated with three BS and three BB constraints, whereas 4-fold coordinated B atoms (BIV) are associated with four BS constraints. However, in contrast to the case of the BIII atoms, no angular BB constraint is counted for BIV atoms. This can be understood from the fact that 4-fold coordinated B species need to be charge-compensated (e.g., by Na or Ca cations), which, in turn, destabilizes their angular constraints. Similarly, only radial BS constraints are attributed to Zr atoms since their angular environment is not as well defined as that of Si and Al atoms—which suggests the absence of any underlying BB constraint. Based on previous studies, the number of BS constraints associated with the network-modifying species (e.g., Na, Li, and Ca) are taken as their valency (i.e., 1 for Na and Li and 2 for Ca) rather than their geometric coordination numbers25,27,28. No BB constraints are counted for network-modifying species due to the ionic, non-directional nature of the bonds they form25,26. In addition, bridging oxygen atoms are associated with one BB constraint. In contrast, due to the ionic and non-directional nature of the bonds created by the network-modifying species, no BB is counted for the non-bridging oxygen atoms25,26. Table 4 shows the average number of constraints per atom nc of all the glasses considered herein. Overall, we find that most glasses are isostatic (nc ≈ 3) or slightly flexible (nc < 3), in agreement with the fact that stressed–rigid systems (nc > 3) typically show a poor glass-forming ability15.
Parameterization of the TCT model
We first investigate whether the forward dissolution rate (r0) of the silicate glasses considered herein can be predicted from the knowledge of the number of constraints per atom (nc). To this end, we first focus only on seven borosilicate glasses, also called CJ series (see Tables 1, 4). This choice is motivated by the fact that, ultimately, we aim to assess whether our TCT-based model can extrapolate predictions of dissolution rates for new unknown glasses that are not included within the training set (see below).
Figure 3 shows the forward dissolution rate r0 of the CJ glasses as a function of the number of constraints per atom nc. Overall, we observe a very good correlation between r0 and nc, namely, r0 decreases exponentially with nc. This echoes previous findings17, wherein it was proposed that the dissolution rate in dilute conditions in controlled by the topology of the atomic network as:
where \(r_{n_{\mathrm{c}} = 0}\) is a constant that corresponds to the barrier-less dissolution rate of a completely depolymerized material (for which nc = 0) and that depends on the solution chemistry (e.g., pH) and E0 is the energy barrier that needs to be overcome to break a unit atomic constraint. Here, we find E0 = 45.7 ± 1.1 kJ/mol, which is fairly comparable (albeit larger) to the values previously-obtained for silicate glasses (25.517, 24.721,22, 23.918, and 23 ± 5 kJ/mol33) but differs from that obtained for aluminoborate glasses (6.9 kJ/mol20).

The data are fitted by Eq. 1. The standard deviation on the slope is 0.356.
This relationship between dissolution rate and number of constraints per atom was explained as follows (see ref. 17). Starting from nc = 0 (i.e., which would correspond to a fully depolymerized material), each new constraint per atom effectively reduces the dissolution kinetics by increasing the associated activation energy needed for bond rupture17. In details, it was proposed that nc serves as an indicator of the elastic resistance of the atomic network, which tends to resist the reorganization or deformation of the network that would occur upon dissolution17. For instance, hydrolysis requires the formation of larger intermediate over-coordinated species (5-fold coordinated Si or three-fold coordinated O), which imposes some local stress (and strain) on the network11. The resulting activation energy takes the form of the strain elastic energy that is applied by the rest of the network to resist the creation of this local defect34. The topological model captured by Eq. 1 then assumes that this strain elastic energy is governed by the local number of constraints per atom nc, since each constraint acts as a little spring connecting the atoms and, hence, characterizes the local stiffness of the atomic network35. This picture echoes previous results from density functional theory, wherein the activation energy associated with the hydrolysis of bridging oxygen atoms was shown to increase with the network connectivity36.
Predictions of the TCT on new unknown glasses
We now assess whether the TCT-based model trained based on the seven borosilicate glasses can predict the dissolution rate of the other non-CJ borosilicate and, also, aluminosilicate glasses tested herein (i.e., the test set). This aims to check whether, in addition of properly interpolating the dissolution rate of the “training” glasses, our model can extrapolate predictions far from its training set for unknown glasses that were not used during its training. It should be noted that the CJ series corresponds to a small training set for the model, both in terms of samples number (7 out of 16 glasses) and dissolution kinetics—since the dissolution rate of the CJ glasses ranges over about 1.5 order of magnitude, while that of the entire set of glasses spans over 5.5 orders of magnitude.
Figure 4a shows the comparison between the measured and predicted dissolution rates of the non-CJ glasses used herein as test set. Overall, we find that, despite being trained based on only a narrow range of dissolution rates (see orange domain in Fig. 4), our TCT-based model offers reasonable predictions of the dissolution rates of the non-CJ borosilicate glasses (NBS series, open circles). In contrast, we observe that the level of agreement between the measured and predicted dissolution rates of the aluminosilicate glasses (NSA series, filled circle) is significantly lower than in the case of the borosilicate glasses (see Fig. 4a). As noted above, some of these glasses exhibit an incongruent dissolution, with a preferential release of Na cations. As discussed in the following, such incongruency needs to be accounted for in the TCT model to reconciliate the measured and predicted dissolution rate data. The root mean square relative error (RMSRE) was calculated for the 9 tested glasses according to Eq. 2:
where N is the number of glasses, rcal the calculated rate and rexp the measured rate. In this case RMSRE is 4.63.

Open circles and filled correspond to borosilicate glasses and aluminosilicate glasses, respectively. The black dashed line is the y = x identity function, indicative of a perfect agreement between measured and predicted data. The two panels present the predictions from our model by using as input a the bulk glass compositions and b the modified compositions of the Na-depleted glasses for the NSAC19, NSAC21, and NSAC35 glasses (percolating glasses) given in Table 5. The red labels highlight the glasses for which the dissolution rate is not properly predicted by the TCT-based model. Error bars are calculated as follow: ±30% on measured r0 (−0.36 and + 0.26 on ln(r0) values, ±2 on calculated ln(r0) values to account for errors on glass composition.
Refined TCT model accounting for dissolution incongruency
As noted above, the NSAC19, NSAC21, and NSAC35 glasses that are not well described by our TCT model exhibit some preferential release of Na cations upon dissolution, which leads to the formation of a Na-depleted (and, hence, Al-and-Si-enriched) layer on the surface of the glass. Based on this observation, we now assess whether the dissolution rates of these glasses is controlled by the network topology of their Na-depleted layer rather than that of their initial pre-dissolution bulk structure. To this end, we estimated the composition of the surface layer based on the equivalent thicknesses of the Si, Al, and Na species (see Table 5).
Table 5 shows the corrected number of constraints per atom for the NSAC19, NSAC21, and NSAC35 glasses, recalculated based on their modified compositions. As expected, we find that the corrected nc values are higher than those obtained from the bulk compositions, which echoes the fact that the preferential leaching of the Na atoms induces a repolymerization (and, hence, rigidification) of the network of the surface layer. Interestingly, we find that, by accounting for these corrected nc values, our TCT-based model offers significantly improved predictions of the dissolution rates of the NSAC19 NSAC21. Nevertheless, we still observe a large discrepancy between the predicted and measured dissolution rates for the NSAC35 glass. The fact that the predicted rate is much lower than the measured one suggests that the repolymerization of the silicate network following the release of Na is incomplete. For the percolating glasses, further investigation is required to better understand the chemical and structural modifications of the reacting surface.
By using the corrected nc values, we find that the RMSRE of the TCT-base predictive model decreased from 4.63 to 2.45. Further, if the NSAC35 glass is excluded from the prediction, the RMSRE decreased from 0.57 (with the bulk composition of NSAC19 and NSAC21 glasses) to 0.37 with the Na-depleted composition of these two glasses. This last number means that the model can predict the initial dissolution rate of a new borosilicate or aluminosilicate glass dissolving congruently with a relative error of e0.37, i.e., 45%. This error is close to the experimental error (30%).
In summary, the TCT-based model developed gives reasonable predictions of the initial dissolution rate of borosilicate and aluminosilicate glasses, given the conditions that the unknown glasses are homogeneous and dissolve congruently, or slightly incongruently (composition close to the percolation threshold). For glasses that do not meet these restrictions, we proposed a simple way to estimate their dissolution rate, but further investigations are needed to refine the model, especially for flexible networks (nc < 3).
Methods
Glasses
Ten sodium borosilicate glasses and six aluminosilicate glasses were selected for this study. The first three glasses displayed in Table 5 have been subject to previous investigations by Gin et al.32, Pacaud et al.37, and Perez et al.38. Note that NBSACZ corresponds to the International Simple Glass (ISG)4, which has been subject to many studies since 201339. Details about the elaboration conditions can be found in the above-mentioned references. All these glasses of this study were prepared following the classical melt-quench route. Analytical grade carbonate or oxide powders were melted at the temperature indicated in Table 5. To guarantee a good homogeneity, after quenching, the resulting glass was crushed and melted a second time at the same temperature. After the second batch, the glass was annealed for 3 h at Tg + 20 K. The fractions of 4-fold coordinated boron (B4) of the borosilicate glasses obtained from 11B magic angle spinning (MAS) nuclear magnetic resonance (NMR) as detailed elsewhere40,41. The glass composition were analyzed by inductively coupled plasma-optical emission spectroscopy (ICP-OES) after caustic fusion (NaOH–KNO3 and lithium tetraborate) of glass powders.
Glass powders were prepared following the classical method of grinding, sieving, and ultrasonically cleaning in acetone and ethanol. The absence of fine particles was verified by scanning electron microscopy (SEM). Rectangular shape coupons of NBS12/28, NBS36/21, and NBS31/15—the less durable glasses of the series—were also prepared by cutting and polishing at various grades up to a diamond suspension of 0.05 µm, in order to obtain a surface roughness of the order of a few nm. No water was used during the preparation of the powders and monoliths of the studied glasses.
The 11B MAS NMR spectra of the borosilicate glasses were collected on a Bruker AVANCE II 500WB spectrometer operating at a Larmor frequency of 160.14 MHz (magnetic field 11.72 T) using a 4 mm (outer diameter of the ZrO2 rotor) Bruker (boron-free) CPMAS probe. The powder samples were spun at a frequency of 12.5 kHz. A recycle delay of 2 s and a pulse length of 1 μs (tip angle of about 20°) were used to ensure quantitativeness of the spectra (i.e., homogeneous excitation of BO3 and BO4 species, independently of their quadrupolar interactions). Data processing occurred via an in-house code (for details see Angeli et al. 40), including the correction of the center band from the contribution of n = 0 spinning sideband coming from the satellite transitions.
Dissolution experiments
The initial dissolution rate, r0, of each glass was measured in static mode, at the temperature of 90 °C, and in a solution with initial pH90 °C adjusted at 9. These conditions ensured that glass dissolution is controlled by the hydrolysis of the covalent bonds (i.e., Si–O–M with M = Si, Al, B, or Zr). Hence, the release of Si is here used to calculate the glass dissolution rate. Experiments were conducted in perfluoroalkoxy (PFA) vessels with volume of 250, 500, or 1000 mL. These vessels each come with a cap equipped with two small openings for solution sampling and pH control. The choice of the glass-surface-to-solution-volume ratio, S/V, resulted in a tradeoff between the need of a sufficient amount of glass (50 mg) to reduce the uncertainty of the sampling and an upper limit of concentration in solution above which the silica released by the glass reduces the glass dissolution rate. This limit, above which the affinity of network dissolution is impacted, depends on the glass composition and must be verified experimentally by following both the linearity of the Si release and the congruency of the dissolution by calculating the ratio NL(Na)/NL(Si) (see the definition of NL below). The dimensions given in Table 6 were chosen based on preliminary experiments (not shown here).
A typical dissolution experiment was conducted, as detailed in the following. A large magnetic bar of 3-to-5 cm long was placed in the reactor. The onset solution was prepared with 18.2 MΩ cm deionized water, heated to (90 ± 2)°C. The pH was adjusted to 9 ± 0.05 with LiOH 1 M. Time zero is set when the glass was poured in the leaching solution. From this moment, the glass always remained in suspension in the solution thanks to a quick agitation of the magnetic bar. The magnetic stirring system consisting of large square plate with 3 or 9 independent spots were placed in the oven. For the short duration tests (<1 h), samplings of 1–5 mL each were taken without removing the reactor from the stirring spot. A precise timer was used so that the samplings were made with a precision of 5 s. For the longer tests, the reactors were removed from the oven for sampling. They stayed outside of the oven for less than 1 min per sampling. The most soluble glasses were tested with large coupons to make sure that the reactive surface did not change much during the course of the experiment. In that case, the coupon was inserted into a Teflon® basket hung with Teflon® tapes in the center of the reactor. In this configuration, the Reynolds number—a dimensionless number indicating the flow pattern—was estimated to be >2000, a value characteristic of a turbulent flow at the glass surface. Solution samplings were carried out with a 5 mL syringe. Samples were filtrated at 0.45 µm. Generally 5 or 6 samplings were carried out at regular intervals. For some tests, a few more samples of 1 mL each were taken and acidified with HNO3 0.5 M for ICP-OES analyses. The pH was controlled at the end the test, except for the glasses that dissolve incongruently. In this case the pH was regularly adjusted to the target value by addition of small quantities of HNO3 0.5 N.
Si concentrations were determined by colorimetry with a Merck Spectroquant kit and a Cary Varian UV–visible spectrophotometer at a wavelength of 820 nm (concentration range: 0.05–5 mg L−1). For some tests, extra samplings were also analyzed by ICP-OES (Thermo Scientific ICAP 6300 Duo) to confirm the data and get insight into the stoichiometry of the dissolution reaction. For the tests performed with coupons, the mass loss was determined after rinsing, drying and weighting the altered coupon.
Based on these tests, the forward dissolution rate r0 was calculated by linear regression of the normalized mass losses of Si, NL(Si).
where NL(Si) was calculated allowing for the variations in the fraction of altered glass (FAG), the variation in volume of the leaching solution, and the variations in the reactive surface area of the glass according to a shrinking core model in spherical geometry, using the following equations:
where n refers to the sample number, Sgeo is the geometric surface area per gram of starting material, m the mass of glass, xSi is the mass fraction of Si in the glass, V0 the initial volume of the solution and C(Si)j the concentration of Si in the jth sample. According to previous studies30,31, the geometric surface area was considered to better represent the actual reactive surface as compared to the BET specific area. Sgeo was calculated as follow:
where ρ is the glass density and ϕm the mean diameter of the glass powder. Although Sgeo is a rough estimation of the reactive surface area of the glass powder, Fournier et al. 30 demonstrated that it is an acceptable approximation.
Uncertainty on r0 was estimated according to the work conducted on ISG30. A value of ±30% is taken in our study, accounting for errors propagation and reproducibility.
Under the selected T and pH conditions, glasses were supposed to dissolve congruently. But it appeared that some highly depolymerized glasses released Na+ ions preferentially, thereby leaving a Na-depleted silica-rich material subject to hydrolysis. Glass dissolution was considered as non-congruent when NL(Na)/NL(Si) > 1.1.
Table 6 summarizes the experimental conditions for each glass dissolution test.
TCT model
Based on the dissolution and structural data obtained in the present study, we assessed whether the topology of the atomic network of the silicate glasses considered herein can be used as a structural metric to predict (and extrapolate) their dissolution rate. To this end, we adopted the TCT framework14,15,16. In this framework, atomic networks are considered as mechanical trusses, wherein some nodes (the atoms) are connected to each other via some constraints (the chemical bonds)15,16. By simplifying complex disordered networks into simpler mechanical trusses, TCT captures the important network topology while filtering the second-order structural details of the atomic network that are unlikely to significantly affect the dissolution kinetics15,24.
In atomic networks, relevant topological constraints comprise the 2-body radial bond-stretching (BS) and 3-body angular bond-bending (BB) constraints, which keep the bond distances and bond angles fixed around their average values, respectively. Based on Maxwell’s criterion42 and a mean-field enumeration of the constraints, the mechanical stability of the network then depends on the balance between the number of constraints per atom (nc) and the number of degrees of freedom of the network (i.e., 3 per atom). Based on this balance, TCT classifies the atomic networks as (i) flexible when nc < 3, (ii) stressed–rigid when nc > 3, and (iii) isostatic when nc = 3.
In fully-connected networks made of covalent bonds (wherein all the topological constraints are active), the number of BS and BB created by a given atom are given by CN/2 and 2CN−3, where CN in the coordination number14. However, it has been shown that certain weaker constraints (i.e., ionic bonds) can be either active or thermally-broken based on the temperature25,43—for instance, weak ionic Si–O–Na bond-bending constraints are broken even at room temperature and, hence, are ignored from the present enumeration (see Table 3).
Data availability
The data that support the findings of this study are available from the corresponding author upon reasonable request.
References
Morse, D. L. & Evenson, J. W. Welcome to the glass age. Int. J. Appl. Glass Sci. 7, 409–412 (2016).
Varshneya, A. Fundamentals of Inorganic Glasses. 570 (Academic Press, 1994).
Mauro, J. C. Decoding the glass genome. Curr. Opin. Solid State Mater. Sci. 22, 58–64 (2018).
Gin, S. et al. An international initiative on long-term behavior of high-level nuclear waste glass. Mater. Today 16, 243–248 (2013).
Donald, I. W. Waste Immobilization in Glass and Ceramic based Hosts. (Wiley, 2010).
Lee, W. E., Ojovan, M. I., Stennett, M. C. & Hyatt, N. C. Immobilisation of radioactive waste in glasses, glass composite materials and ceramics. Adv. Appl. Ceram. 105, 3–12 (2006).
Angeli, F., Jollivet, P., Charpentier, T., Fournier, M. & Gin, S. Structure and chemical durability of lead crystal glass. Environ. Sci. Technol. 50, 11549–11558 (2016).
van Elteren, J. T., Grilc, M., Beeston, M. P., Reig, M. S. & Grgic, I. An integrated experimental-modeling approach to study the acid leaching behavior of lead from sub-micrometer lead silicate glass particles. J. Hazard. Mater. 262, 240–249 (2013).
Morin, G. P., Vigier, N. & Verney-Carron, A. Enhanced dissolution of basaltic glass in brackish waters: impact on biogeochemical cycles. Earth Planet. Sci. Lett. 417, 1–8 (2015).
Walton, A. W., Schiffman, P. & Macpherson, G. L. Alteration of hyaloclastites in the HSDP 2 phase 1 drill core: 2. Mass balance of the conversion of sideromelane to palagonite and chabazite. Geochem. Geophys. Geosyst. 6, 27 (2005).
Bunker, B. C. Molecular mechanisms for corrosion of silica and silicate-glasses. J. Non-Cryst. Solids 179, 300–308 (1994).
Bouyer, F., Geneste, G., Ispas, S., Kob, W. & Ganster, P. Water solubility in calcium aluminosilicate glasses investigated by first principles techniques. J. Solid State Chem. 183, 2786–2796 (2010).
Zapol, P., He, H. Y., Kwon, K. D. & Criscenti, L. J. First-principles study of hydrolysis reaction barriers in a sodium borosilicate glass. Int. J. Appl. Glass Sci. 4, 395–407 (2013).
Phillips, J. C. Topology of covalent non-crystalline solids. 1. Short-range order in chalcogenide alloys. J. Non-Cryst. Solids 34, 153–181 (1979).
Bauchy, M. Deciphering the atomic genome of glasses by topological constraint theory and molecular dynamics: a review. Comput. Mater. Sci. 159, 95–102 (2019).
Mauro, J. C. Topological constraint theory of glass. Am. Ceram. Soc. Bull. 90, 31–37 (2011).
Pignatelli, I., Kumar, A., Bauchy, M. & Sant, G. Topological control on silicates’ dissolution kinetics. Langmuir 32, 4434–4439 (2016).
Oey, T. et al. Topological controls on the dissolution kinetics of glassy aluminosilicates. J. Am. Ceram. Soc. 100, 5521–5527 (2017).
Tandre, O. et al. Rate controls on silicate dissolution in cementitious environments. RILEM Tech. Lett. https://doi.org/10.21809/rilemtechlett.2017.35 (2017).
Oey, T. et al. The role of the network-modifier’s field-strength in the chemical durability of aluminoborate glasses. J. Non-Cryst. Solids 505, 279–285 (2019).
Mascaraque, N., Bauchy, M. & Smedskjaer, M. M. Correlating the network topology of oxide glasses with their chemical durability. J. Phys. Chem. B 121, 1139–1147 (2017).
Mascaraque, N. et al. Dissolution kinetics of hot compressed oxide glasses. J. Phys. Chem. B 121, 9063–9072 (2017).
Devreux, F. & Kolb, M. Kinetics of leaching near the percolation threshold. J. Non-Cryst. Solids 242, 14–18 (1998).
Micoulaut, M. & Yue, Y. Material functionalities from molecular rigidity: Maxwell’s modern legacy. MRS Bull. 42, 18–22 (2017).
Bauchy, M. & Micoulaut, M. Atomic scale foundation of temperature-dependent bonding constraints in network glasses and liquids. J. Non-Cryst. Solids 357, 2530–2537 (2011).
Bauchy, M., Qomi, M. J. A., Bichara, C., Ulm, F. J. & Pellenq, R. J. M. Nanoscale structure of cement: viewpoint of rigidity theory. J. Phys. Chem. C 118, 12485–12493 (2014).
Micoulaut, M. Constrained interactions, rigidity, adaptative networks, and their role for the description of silicates. Am. Miner. 93, 1732–1748 (2008).
Vaills, Y., Qu, T., Micoulaut, M., Chaimbault, F. & Boolchand, P. Direct evidence of rigidity loss and self-organization in silicate glasses. J. Phys. 17, 4889–4896 (2005).
Liu, H. et al. Predicting the dissolution kinetics of silicate glasses by topology-informed machine learning. npj Mater. Degrad 3, 1–12 (2019).
Fournier, M. et al. Glass dissolution rate measurement and calculation revisited. J. Nucl. Mater. 476, 140–154 (2016).
Icenhower, J. P. & Steefel, C. I. Experimentally determined dissolution kinetics of SON68 glass at 90 degrees C over a silica saturation interval: evidence against a linear rate law. J. Nucl. Mater. 439, 137–147 (2013).
Gin, S., Beaudoux, X., Angeli, F., Jegou, C. & Godon, N. Effect of composition on the short-term and long-term dissolution rates of ten borosilicate glasses of increasing complexity from 3 to 30 oxides. J. Non-Cryst. Solids 358, 2559–2570 (2012).
Oey, T. et al. Rate controls on silicate dissolution in cementitious environments. RILEM Tech. Lett. 2, 62–73 (2017).
Guo, P., Wang, B., Bauchy, M. & Sant, G. Misfit stresses caused by atomic size mismatch: the origin of doping-induced destabilization of dicalcium silicate. Cryst. Growth Des. 16, 3124–3132 (2016).
Yang, K. et al. Prediction of the Young’s modulus of silicate glasses by topological constraint theory. J. Non-Cryst. Solids 514, 15–19 (2019).
Pelmenschikov, A., Strandh, H., Pettersson, L. G. M. & Leszczynski, J. Lattice resistance to hydrolysis of Si-O-Si bonds of silicate minerals: ab initio calculations of a single water attack onto the (001) and (111) beta-cristobalite surfaces. J. Phys. Chem. B 104, 5779–5783 (2000).
Pacaud, F., Delaye, J. M., Charpentier, T., Cormier, L. & Salanne, M. Structural study of Na2O-B2O3-SiO2 glasses from molecular simulations using a polarizable force field. J. Chem. Phys. https://doi.org/10.1063/1.4992799 (2017).
Perez, A. et al. Comparing the reactivity of glasses with their crystalline equivalents: the case study of plagioclase feldspar. Geochim. Et. Cosmochim. Acta 254, 122–141 (2019).
Debure, M., Frugier, P., De Windt, L. & Gin, S. Dolomite effect on borosilicate glass alteration. Appl. Geochem. 33, 237–251 (2013).
Angeli, F., Charpentier, T., de Ligny, D. & Cailleteauz, C. Boron speciation in soda-lime borosilicate glasses containing zirconium. J. Am. Ceram. Soc. 93, 2693–2704 (2010).
Pierce, E. M. et al. Experimental determination of the effect of the ratio of B/Al on glass dissolution along the nepheline (NaAlSiO4)-malinkoite (NaBSiO4) join. Geochim. Cosmochim. Acta 74, 2634–2654 (2010).
Maxwell, J. C. On the calculation of the equilibrium and stiffness of frames. Philos. Mag. 27, 294–299 (1864).
Mauro, J. C., Gupta, P. K. & Loucks, R. J. Composition dependence of glass transition temperature and fragility. II. A topological model of alkali borate liquids. J. Chem. Phys. 130, 8 (2009).
Acknowledgements
The planning and strategy of this work and the experimental work were supported as part of the Center for Performance and Design of Nuclear Waste Forms and Containers, an Energy Frontier Research Center funded by the U.S. Department of Energy (DOE), Office of Science, Basic Energy Sciences under Award # DESC0016584. The modeling work was supported by the Department of Energy’s Office of Nuclear Energy’s Nuclear Energy University Programs (Award #18–15020) and National Science Foundation (Grant No. 1562066).The authors thank PRIME VERRE (Montpellier, France) for the preparation of the glass samples.
Author information
Authors and Affiliations
Contributions
S.G., M.B., and J.D. supervised the study. S.G., N.B., and M.T. performed the leaching experiments. T.C. and F.A. performed the NMR analyses. M.W., X.L., L.D., J.M.D., J.D., N.B., M.T., S.G., and M.B. contributed to the modeling part. All the authors helped on paper editing.
Corresponding author
Ethics declarations
Competing interests
The authors declare no competing interests.
Additional information
Publisher’s note Springer Nature remains neutral with regard to jurisdictional claims in published maps and institutional affiliations.
Supplementary information
Rights and permissions
Open Access This article is licensed under a Creative Commons Attribution 4.0 International License, which permits use, sharing, adaptation, distribution and reproduction in any medium or format, as long as you give appropriate credit to the original author(s) and the source, provide a link to the Creative Commons license, and indicate if changes were made. The images or other third party material in this article are included in the article’s Creative Commons license, unless indicated otherwise in a credit line to the material. If material is not included in the article’s Creative Commons license and your intended use is not permitted by statutory regulation or exceeds the permitted use, you will need to obtain permission directly from the copyright holder. To view a copy of this license, visit http://creativecommons.org/licenses/by/4.0/.
About this article

Cite this article
Gin, S., Wang, M., Bisbrouck, N. et al. Can a simple topological-constraints-based model predict the initial dissolution rate of borosilicate and aluminosilicate glasses?. npj Mater Degrad 4, 6 (2020). https://doi.org/10.1038/s41529-020-0111-4
Received:
Accepted:
Published:
DOI: https://doi.org/10.1038/s41529-020-0111-4
This article is cited by
-
Structure--property relationship and chemical durability of magnesium-containing borosilicate glasses with insight from topological constraints
npj Materials Degradation (2022)
-
Borosilicate glass alteration in vapor phase and aqueous medium
npj Materials Degradation (2022)
-
Aqueous alteration of silicate glass: state of knowledge and perspectives
npj Materials Degradation (2021)
