
Abstract
This article presents an overview of three challenging issues that are currently being debated in the community researching on the evolution of amorphous structures in metallic glasses and their parent supercooled liquids. Our emphasis is on the valuable insights acquired in recent computational analyses that have supplemented experimental investigations. The first idea is to use the local structural order developed, and in particular its evolution during undercooling, as a signature indicator to rationalize the experimentally observed temperature-dependence of viscosity, hence suggesting a possible structural origin of liquid fragility. The second issue concerns with the claim that the average nearest-neighbor distance in metallic melts contracts rather than expands upon heating, concurrent with a reduced coordination number. This postulate is, however, based on the shift of the first peak maximum in the pair distribution function and an average bond length determined from nearest neighbors designated using a distance cutoff. These can instead be a result of increasing skewness of the broad first peak, upon thermally exacerbated asymmetric distribution of neighboring atoms activated to shorter and longer distances under the anharmonic interatomic interaction potential. The third topic deals with crystal-like peak positions in the pair distribution function of metallic glasses. These peak locations can be explained using various connection schemes of coordination polyhedra, and found to be present already in high-temperature liquids without hidden crystal order. We also present an outlook to invite more in-depth computational research to fully settle these issues in future, and to establish more robust structure-property relations in amorphous alloys.
Introduction
Metallic glasses (MGs), discovered over five decades ago, are a new member in the family of glasses.1,2,3,4,5,6,7 They are of current interest due to their peculiar internal structures8,9,10,11,12,13 and unusual properties.14,15,16,17,18,19 However, a number of issues remain unresolved with regards to the fundamental understanding of MGs, as well as their predecessor above the glass transition temperature, the supercooled liquids.20,21,22,23,24 From the structural perspective, MGs are amorphous materials without long-range translational order, yet they exhibit very high atomic packing density compared to other glasses.8,9,10,11,12,13 MGs in fact possess pronounced topological and chemical short-to-medium range order, profoundly influencing the intriguing properties of these amorphous alloys.8,9,10,11,12,13 However, it is a major challenge to characterize order in disorder and establish structure-property relations.11 For detailed analysis and discussion on this subject, the reader is referred to a recent review by Cheng and Ma25 that comprehensively summarizes the progress over the past 50 years.
Most recently, a number of issues have been under debate regarding the local structure and structure-property relationship in MGs and metallic liquids. Examples include a structural signature of dynamical slowdown as well as the liquid fragility in metallic glass-forming liquids,26,27,28,29,30,31,32 anomalous thermal contraction of metallic melts in the nearest-neighbor shell,33,34,35 possible crystal-like order in MGs/liquids,36,37,38,39 a fractal structure model of MGs,40,41,42 advanced algorithms (such as machine learning methods) to efficiently characterize the structural basis of flow defects and dynamical slowdown in amorphous materials,43, 44 and a new structure parameter that incorporates dynamic (atomic vibration) information beyond the description of static structure/configuration.45,46,47,48,49 Computational research has played a key role in formulating these ideas. This article presents an overview of the first three topics above, focusing on recent computational analyses including those by the current authors.
Among the computational techniques, classical and ab initio molecular dynamics (MD) simulations are now widely used to model and analyze MG structures.50, 51 This approach not only provides the full coordinates of every atom residing inside the MG (an example is shown in Fig. 1), but also enables in-depth analysis that can bring about insights into the underlying structural link to MG properties. Computer simulation is especially powerful in providing atomic-scale details otherwise not accessible in experiments. However, computer modeling of MGs has intrinsic limitations: one must constantly keep in mind the large disparity between the computer world and the laboratory world, in terms of the time and spatial scales involved. For example, due to the ultrafast cooling rates that have to be used to quench a liquid to obtain a metallic glass in MD simulation (e.g., covering 1000 K over the very limited computation time available, typically less than a microsecond),52 it is not possible to generate a metallic glass that matches a real-world MG, which is cooled at a much slower cooling rate such as 1000 K/s. As a result of the relaxation time available, the laboratory glass has a much more ordered structure, lower potential energy and different properties (such as obviously higher elastic modulus). There is, therefore, a pressing need to improve computational techniques and develop algorithms to produce models that better resemble and represent experimental glasses. For instance, incorporating advanced computational methods, such as metadynamics53 or rare-event sampling methods,54 are potentially practical to accelerate atomistic simulation of MGs. Multi-scale modeling is also useful to study the mechanical deformation of MGs, e.g., the dynamics of shear transformation zones based on the kinetic Monte Carlo model.55,56,57

Atomic configuration of MD-simulated Zr46Cu46Al8 MGs (see ref. 13 for the simulation method and interatomic potential used)
Structural signature of fragility for metallic glass-forming liquids
The fragility of metallic glass-forming liquids is a key parameter that influences their rheological behavior and glass-forming ability (GFA).20,21,22,23, 58, 59 The liquid fragility is a measure of how the dynamics slow down upon cooling, i.e., viscosity (η) or α-relaxation time (τ α ) as a function of temperature (T), as schematically shown in the form of Angell plot22 in Fig. 2. At the glass transition temperature (T g) the viscosity reaches a critical value (e.g., 1012 Pa*s or 1013 poise) for all liquids; with rising temperature the η decreases exponentially. Although liquids all have nominally similar amorphous structure, their viscosity and rheological properties differ by a large margin. “Strong” liquids (such as SiO2) do not deviate much from the Arrhenius equation, exhibiting a nearly linear relationship in the Angell plot (see Fig. 2). In comparison, for “fragile” liquids the temperature dependence of η shows a knee-shaped bending curve in the Angell plot (also illustrated in Fig. 2). A quantitative measure of liquid fragility can be defined using the steepness index \(m={[\frac{d\eta ({T}_{{\rm{g}}}/T)}{d({T}_{{\rm{g}}}/T)}]}_{T={T}_{{\rm{g}}}}\), the slope near the glass transition in the Angell plot,22 or the fragility parameter, D *, in the Vogel-Fulcher-Tammann equation:22 \(\eta ={\eta }_{0}\exp (\frac{{D}^{\ast }{T}_{0}}{T-{T}_{0}})\), where η 0 is the high-temperature limit of η(T) and T 0 is the temperature at which the viscosity becomes infinite. Liquids with lower m or higher D * are “stronger,” whereas those with higher m or lower D * are more “fragile”.

Schematic description of the strong and fragile liquids using the Angell plot: viscosity (η) or α-relaxation time (τ α ) for y-axis (in logarithmic scale) and normalized temperature (T/T g) for x-axis. T g is the glass transition temperature. Schematically, it’s also included with the temperature-dependent characteristic structural metric for strong and fragile liquids, respectively
The liquid fragility can be understood in terms of a temperature-dependent energy barrier for atomic relaxation, ΔE, because20
For strong liquids ΔE is close to a constant, whereas in fragile liquids ΔE decreases rapidly with rising temperature. In this context, the potential energy landscape (PEL) provides useful insight into the liquid fragility, in terms of the change of the depth of accessed energy basins and their degeneracy in the liquid state.20,21,22,23, 60, 61 For instance, as illustrated in ref. 20, the landscape of a strong liquid may possess a single “mega-basin” while fragile ones exhibit a proliferation of well-separated ‘mega-basins”.
Here, our focus is on a key unsolved problem, i.e., the structural origin of liquid fragility for metallic glass-forming liquids. As “structure determines properties” is a central tenet of materials science, how this relationship plays out in a liquid is an intellectually interesting question. One naturally hopes to seek a structural basis for liquid dynamics, in particular a structural mechanism that enables the viscosity of metallic melts to change by ~ 15 orders of magnitude, and in contrasting ways (strong vs. fragile behavior), as a function of temperature during cooling.
One way to approach this problem is to connect the liquid relaxation dynamics (as measured by viscosity η or relaxation time τ α ) with the configurational entropy, via the Adam-Gibbs equation62
Here A and B are constants, and S c (T) is the configurational entropy of the liquid. Although this equation is not theoretically proven, it is one possible avenue to connect the amorphous configuration with liquid dynamics and fragility. If S c is independent, the viscosity should follow Arrhenius behavior (strong liquid), with an approximately linear relationship in the log(η) ~ (T g/T) plot (the Angell plot). However, in most liquids S c (T) keeps decreasing with decreasing T, such that the log(η) ~ log(T g/T) curve bends upward. In the context of Eq. (2) this can be perceived as a consequence of decreasing configurational entropy upon undercooling. In other words, how and how fast the atoms order themselves can be the structural process underlying the dynamical arrest. Thus, as schematically illustrated in Fig. 2, the relatively strong liquids are expected to correspond to gradual structural ordering upon undercooling, with the strongest liquid exhibiting a constant structure order and hence constant ΔE. In contrast, fragile liquids would exhibit rapid structural evolution approaching the glass transition. Several structural indicators have been invoked and monitored thus far, in an effort to detect a structural signature that confirms this trend:
-
i)
Characteristic short-range order (SRO): The characteristic SRO in the amorphous structure, or generally referred to as the locally preferred structure, has been extensively studied in model MGs and supercooled liquids.25, 26, 29–31, 63–69 An example is the icosahedral SRO, such as the Cu-centered FI (full icosahedra, with Voronoi index<0, 0, 12, 0>) in the Cu64Zr36 liquid.52 For other compositions and alloy systems, the preferable SRO may be of another type, not necessarily icosahedral, such as Cu-centered BSAP (bicapped square antiprisms, with Voronoi index <0, 2, 8, 0>) and TTP (tricapped trigonal prisms, with Voronoi index <0, 3, 6, 0>) in Mg65Cu25Y10 liquids.31 In any case, the degree of characteristic SRO evolves with undercooling. As a specific example, the Mg65Cu25Y10 liquid is stronger than the Cu64Zr36 liquid (see ref. 31), and correspondingly, as plotted in Fig. 3a, the characteristic atomic motifs (BSAP + TTP) in Mg65Cu25Y10 liquid increases slowly in a gradual manner upon undercooling, whereas that (FI) in Cu64Zr36 liquids rises sharply over a temperature range approaching T g. As such, the characteristic SRO can be taken as a structural signature for liquid fragility, in line with the expectations from the schematic Angell plot in Fig. 2. Another way to monitor structural evolution is to analyze the interconnecting coordination polyhedra (see illustration later in Fig. 7) as plotted in Fig. 3b: the average number of cluster connections in Mg65Cu25Y10 and Cu64Zr36 liquids exhibits contrasting behavior upon undercooling:70 the flat vs. fast ascending evolution corresponds well with the same trend observed for the temperature dependence of liquid dynamics as well as evolution of SRO (Fig. 3a).
Fig. 3 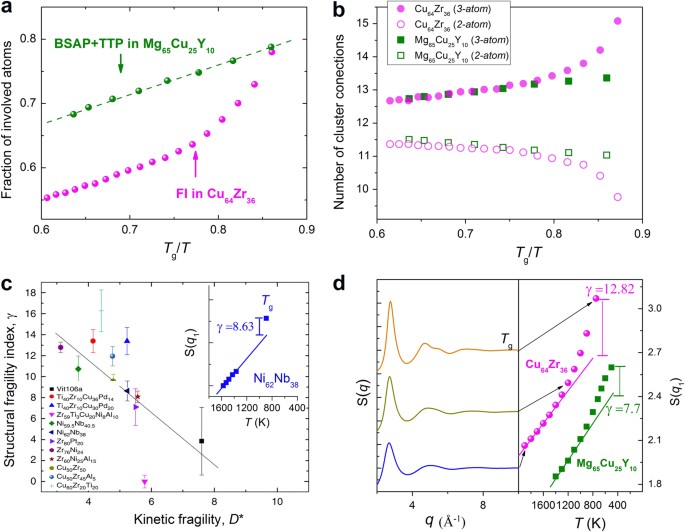
Evolution of structural order in metallic glass-forming liquids. a Fraction of total atoms involved with the characteristic short-range order (atomic packing motifs) in Cu64Zr36 and Mg65Cu25Y10 liquids as a function of temperature (normalized by T g). In Cu64Zr36 liquid, the characteristic atomic motif is Cu-centered FI (full icosahedra, with Voronoi index <0, 0, 12, 0>); in Mg65Cu25Y10 liquid, the characteristic atomic motif is BSAP (with Voronoi index <0, 2, 8, 0>) and TTP (tricapped trigonal prisms, with Voronoi index <0, 3, 6, 0>); see refs. 30, 31 for simulation details; b Evolution of the average number of cluster connections in Cu64Zr36 and Mg65Cu25Y10 liquids with decreasing temperature; 3-atom or 2-atom refers to the number of shared atoms by two interconnected coordination polyhedra; The detailed definition of cluster connection can be found in ref. 70; c For various metallic glass-forming liquids, the larger the structural fragility γ, the more fragile the liquids (reflected by smaller D* or larger m), and vice versa. The inset is adapted from ref. 28, showing a large discrepancy between the height of the first peak, S(q 1), in the liquid when extrapolated to T g and that measured in the glass (see Equation (4) and ref. 28). d The static structure factor and the height of the first peak for Cu64Zr36 liquid are plotted as a function of temperature; the γ is obviously larger for Cu64Zr36 than for Mg65Cu25Y10 (also included for comparison). As such, the two MD-simulated liquids shown in a provide data points down to T g, and lend support to the observations made by Mauro et al.28 based on experimental measurements (Fig. 3c)
-
ii)
Degree of five-fold local symmetry: Closely related to (i) above is the structural parameter W, defined as the average degree of fivefold local symmetry for the coordination polyhedra at the short-range scale.27 In this approach, instead of tracking a characteristic SRO around certain species in an alloy, Hu et al. 27 track the population of all the fivefold bonds in the alloy such that the metric can be applied to any alloy composition, including those for which icosahedral SRO is not preferable and those where obviously dominant SRO motifs have not been identified. Of course, this approach is expected to yield the same trend as the SRO parameter in (i) above, because any preferable SRO (motif) would be rich in local fivefold topology (the third digit of the Voronoi index is maximized for the coordination number in question).11, 25 The authors used W to fit the viscosity behavior and the dynamic arrest that culminates in the transition of a liquid to its glass state,
$$\eta ={\eta }_{0}\,\exp \frac{D}{{(1-W)}^{\delta }}$$(3)where D and δ are two fitting parameters, which are different for different alloys.27
-
iii)
First peak height in the structure factor, S(q): Mauro et al. 28, 29 have studied the temperature dependence of the height of the first peak in S(q), as a measure of local structural order developed. This maximum peak intensity evolves with undercooling. The authors found a mismatch between the value for that height in the liquid when extrapolated to T g and the value measured in the glass at that temperature (as illustrated in Fig. 3c, and ref. 28). Based on this observation, Mauro et al.28 defined a structural fragility γ,
$$\gamma =100\times \frac{(S{({{q}}_{1})}_{{\rm{glass}}}-S{({{q}}_{1})}_{{\rm{liquid}}{\rm{extrapolation}}})}{S{({{q}}_{1})}_{{\rm{glass}}}}\,{\rm{at}}\,{{T}}_{g},$$(4)and found that γ increases with the fragility of liquids (although with considerable fluctuation) as shown in Fig. 3c. This trend works well for our MD-simulated Cu64Zr36 and Mg65Cu25Y10 liquids as shown in Fig. 3d, where the more fragile Cu64Zr36 liquids exhibit higher structural fragility γ. This structural indicator is not tied to any specific type of characteristic SRO, which makes it potentially a universal way to relate with liquid fragility. Note that, in contrast, the temperature-dependent position or the full width at half maximum of the first peak in S(q), exhibits poor correlation with liquid fragility.28 Also note that although Mauro et al. 28 did not have data for the liquid deep into the supercooled regime at temperatures close to T g(see inset in Fig. 3c), this gap of missing experimental data is remedied by our MD simulation of a similar alloy system (Fig. 3d). Again, these computational data are consistent with Mauro’s general postulate based on experimental observation of peak height in S(q): there will be contrasting trends for the local SRO as discussed in (i) for the evolution of SRO upon cooling of a stronger vs. a more fragile liquid towards T g.

Aside from the structural metrics above, other structure parameters may also show correlation with the liquid fragility, such as the peaks in pair distribution functions (PDFs),71,72,73 volume or density variations,74, 75 bond orientational order76 and interatomic repulsion softness.77 In a nutshell, these structural indicators suggest that the liquid fragility does correlate with how and how fast the local structural ordering takes place upon cooling. Presumably, this ordering upon undercooling reduces the configurational entropy and affects the energy barrier for dynamic relaxation (Equation (2) above). There can be limited and gradual ordering during undercooling, and there can also be slow change at higher temperatures followed by drastic ordering near glass transition. These two contrasting types of temperature-dependent structural ordering may account for the strong and fragile behavior, respectively. This appears to be a consistent message from both the experimental and computational analysis cited above. It is worth noting that in addition to monitoring structural ordering upon cooling to temperatures close to T g as discussed above, significant progress has been made very recently to understand the dynamical crossover of transport properties from Arrhenius to super-Arrhenius behavior, at high temperatures in liquids that are close to equilibrium (the crossover temperature is at ~ 2T g for metallic liquids).32, 78,79,80,81,82 In this regime, atomic correlations responsible for the onset of cooperative dynamics are being analyzed to provide a structural origin of the cross-over as well as a new perspective of the liquid fragility.
The basic idea remains that in general the kinetic fragility would be correlated with structural evolution in the liquid,29 and a structural signature of the dynamics behavior can be understood from the picture when the liquid enters the PEL-affected regime.20,21,22,23 Structure ordering gives rise to slowdown of dynamics, because of increased constraints and rigidity. Local topological and chemical order enables the neighboring atoms to communicate and coordinate, reducing entropy and suppressing soft vibrational modes. These are expected to go hand in hand with increased energy barrier for relaxation, and hence higher viscosity and longer α-relaxation time. This would also manifest itself as smaller mean square displacement and higher instantaneous shear modulus.83, 84
However, the currently utilized indictors all suffer from shortcomings. Specifically, the type of characteristic SRO varies from alloy to alloy and is not universal for metallic glass-forming liquids.30, 31, 63,64,65,66,67,68,69 The metric based on peak intensity in structure factors or PDFs shows considerable fluctuation when correlated with liquid fragility,28, 29, 71 and the peak height may involve other effects, such as thermally enhanced asymmetry of peaks in the PDF, as will be discussed in a later section. More importantly, all these indicators do not necessarily reveal a causal link with the dynamical slowdown at the microscopic level. Recall that one of the characteristic feature of liquid dynamics upon undercooling is the dynamic heterogeneity, which provides an explicit and quite general connection between spatial fluctuations and relaxation kinetics.20, 26 When the supercooled liquid is cooled towards T g, the dynamic heterogeneity becomes more and more pronounced, as reflected by its growing correlation lengths, which is also accompanied by an increasing correlation length of the static structure to beyond the short-range scale.26, 52, 65, 67,68,69, 81, 85 Therefore, structure features due to ordering at longer correlation length may affect dynamics slowdown even more, especially when both the dynamic and structural correlation lengths increase with cooling. As such, the structural indicators at the much shorter length scale (such as SRO, fivefold environment, bond orientational order, etc.) are not sufficient to reveal a structural mechanism for the dynamical slowdown or a direct link with the fragility of metallic glass-forming liquids. In other words, the short-range ordering examined so far is probably not the root cause of fragility, but only an indicator of the likely existence of a structural mechanism. If structure features from medium-range ordering has more weight in controlling the liquid relaxation, especially at temperatures approaching T g, a better structural signature would need to incorporate medium-range order to better understand the structural basis of dynamical arrest as well as liquid fragility. Last but not least, one could also question if a limited set of indicators solely from static structure is enough to constitute a robust relationship with liquid dynamics, as will be discussed in the outlook section of this article.
Temperature dependence of the first peak in g(r) of metallic liquids
Metallic liquids normally exhibit thermal expansion: their volume expands with increasing temperature. An intriguing behavior noticed in recent studies is an anomalous temperature dependence of the first peak position in the atomic PDFs, g(r), of metallic liquids:33,34,35, 71 the position (distance r) corresponding to the maximum intensity of the first peak shifts towards shorter r with increasing temperature (see Fig. 4). In contrast, liquids of covalent materials, such as Si, Ge, Ge1Sb2Te4, and polymers,35, 86, 87 are found to exhibit positive shift of the first peak in PDFs with increasing temperature. PDF is widely used to describe the amorphous structure, and defined as:25
where N is the number of atoms and ρ is the number density in the system. r ij is the interatomic distance between two atoms i and j. At the first glance, the contraction (negative expansion) of interatomic distance in metallic liquids is counter-intuitive and surprising, considering the accompanying positive volume expansion of the overall sample.

Temperature-dependent first peak position in g(r). a g(r) for Al liquids in the temperature range of 937 to 1077 K. The inset magnifies the top part for the first peak in g(r), where the peak intensity decreases and the position corresponding to the maximum intensity shifts to low r upon heating. b The same was found for the first peak position in g(r) for other metallic melts in addition to Al. The lines are the linear fit of the peak position. Adapted from ref. 33
The first systematic report of the anomalous shift of the first peak was presented by Lou et al. 33 for elemental metallic melts, including Al, Ni, Cu, Ag, Au, and In, see Fig. 4. Meanwhile, the second and third peaks in g(r) expand in contrast to the behavior of the first peak, consistent with heating induced volume expansion. After analyzing the first nearest-neighbor shell, determined by the distance cutoff using the first minimum in PDFs, the authors concluded that this anomaly is caused by changes in the polyhedral motifs/clusters upon heating. Specifically, the coordination polyhedron changes to a denser one with a reduced coordination number and a shorter bond length (distance between the center atom and atoms in the first nearest-neighbor shell). In a later report, Gangopadhyay et al. 34 also observed similar anomalous shift of the first peak for a number of alloy liquids (but not without obvious exceptions).
However, there are factors that were not taken into account in their analysis of the first nearest-neighbor shell. In particular, in a liquid the nearest-neighbor atoms and the coordination number are not unambiguously defined. The practice of using a distance cutoff at the minimum after the first peak in PDF, as conducted in refs. 33 and 34, is subject to major uncertainties as to which atoms belong to the nearest neighbor shells and which ones do not.25 For a liquid this minimum intensity is nowhere no close to zero, but instead corresponds to a fairly high intensity (see Fig. 4a and Fig. 5a), especially for high-temperature liquids for which each of the intensity peaks is broad (spans a rather wide r range) and asymmetric. An example showing the tail in the profile of g(r) for first nearest-neighbors beyond the cutoff distance can be found in a later figure (Fig. 7e). It is then questionable to separate the overlapping first peak and second peak by picking the r position where the PDF intensity appears to be at its minimum.

Asymmetric first peak in the g(r) of metallic liquids. a g(r) of constant-density Al liquids and corresponding inherent structures at various temperatures; b Schematic illustration of the asymmetry of the first g(r) peak, and the skewness increases upon heating; c Evaluation of r B/r A as the asymmetry of the first peak in g(r) at various temperatures for Cu, Al and Cu-Zr liquids (constant density). The definition of r B and r A are schematically shown at the full width of half maximum of the first peaks in the inset. d Average interatomic distance for atom pairs with shorter distance and longer distance in Cu melts at various temperature; (i.e., negative and positive departure from R IS, the first peak position in g(r) for the inherent structure). Adapted from ref. 35
Ding et al.35 employed MD simulations to shed light on possible sources of the anomalous shift of the first PDF peak. First off, they examined equilibrium Al liquids at different temperatures, but these liquids were all simulated at a constant density (the density at zero pressure and melting temperature).35 As shown in Fig. 5a, g(r) for these constant-density Al liquids at various temperatures also have the same inherent structure, which is the local minimum of the potential energy basin in which the liquid configuration resides,20, 60 after removing the temperature effects (deviation from the local minimum) through energy minimization via conjugate gradient method. As such, in Fig. 5a there is no change in the inherent structure via cross-basin jump across saddle point between two neighboring local minima in PEL. In other words, these melts are iso-configurational. With this computational scheme there is no inherent structural change in volume and in coordination number, yet there is still the shift of the first peak to lower r with increasing temperature, as seen in Fig. 5a. This immediately signals that changes in density and coordination number are not a necessary condition for the anomalous peak shift. There can be other contributing factors.
One factor that naturally comes to mind is the dynamic effect from thermally induced spreading of atomic distribution. As will be shown below, this alone could in fact induce the anomalous first peak shift, in the absence of any appreciable evolution of the inherent structure or positive/negative thermal expansion. To see this, note that the first peak in g(r) for metallic liquids is normally asymmetric as illustrated in Fig. 5b, becoming increasingly skewed upon heating due to the anharmonic and asymmetric interatomic potential.35 In such a case, the r position corresponding to the g(r) maximum (the peak) is not necessarily the average first nearest-neighbor distance, see Fig. 5b. With increasing temperature, the peak in fact broadens and becomes increasing asymmetric with enhanced tail in the profile of g(r) for the first nearest-neighbor shell beyond the cutoff distance. As such, the cutoff could easily miss some nearest neighbors that have moved to slightly larger r. Specifically, upon activation by temperature to certain energy atoms spread and attain a wider distribution. Many of them take smaller r and also larger r away from the original position. Due to the asymmetric potential, those atoms spreading towards the lower r side would not go as far as those drifting slightly to the larger r side. So the atomic distribution profile is skewed further, and the most populous location appears to have moved slightly, to the left. In other words, the peak position in PDF shifts to lower r, but the average r is still increasing (i.e., still thermal expansion). Such a scenario of changing skewness can be easily seen in Fig. 5b.
Such an asymmetry can be evaluated by the ratio of r B/r A, with the two distances r B and r A defined at the full width of half maximum height of the first PDF peak,35 as illustrated in Fig. 5c. This asymmetry (i.e., the magnitude of r B/r A) for Al, Cu, and Cu-Zr liquids indeed increases with increasing temperature, even for the same inherent structure. As shown in Fig. 5d, thermal agitation of atoms leads to both shorter and longer bonds (between central atom and nearest neighbors in the first shell) separated by R IS (first peak position of g(r) for corresponding inherent structures), but the r > R IS group will have average bond length R ave longer than that of the r < R IS group. Again, this is because the resistance the thermally excited atoms have to combat with is stiffer on the smaller r side but lower on the larger r side. To maintain the same R IS, with increasing temperature there will be more atoms joining the r < R IS group than the r > R IS group; this redistribution of the number of atoms skews the g(r) peak maximum position to smaller r.
A general picture for the temperature-dependent first peak position in g(r) is depicted with an example in Fig. 6. Here Ni glasses/liquids as well as crystals are monitored using MD simulations at various temperatures under both constant density and constant (ambient) pressure conditions. There appear to be three main effects that determine the first peak positions in g(r) for metallic materials:
-
i)
Thermally induced asymmetry: This skewness effect has been analyzed in details in Fig. 5 and ref. 35. The origin is the redistribution of neighboring atoms to both shorter and longer distances with increasing temperature, due to the anharmonic and asymmetric nature of the interatomic interaction potential. For Ni crystal and liquid/glass (see Fig. 6), they also consistently exhibit the seemingly anomalous shift of first peak (maximum intensity) position in g(r) to lower r upon heating to higher temperatures (even for Ni crystals).
-
ii)
Expansion/contraction of atomic volume: Larger atomic volume normally exhibits larger atomic nearest-neighbor separation. As seen in Fig. 6, at a given temperature, Ni materials (both glass/liquid and crystal) at ambient pressure exhibits a larger r for the first peak position than that at constant density, because of the smaller volume for the latter ensemble.
-
iii)
Topological and chemical ordering: Structural relaxation and short-range ordering change local atomic configurations, including the coordination number, fractions of different species in the nearest-neighbor shell, and the topology of characteristic motifs. These would certainly affect the position of the first g(r) peak. This is particularly true for alloys containing multiple elements,34 because the first peak is then a superposition of several partial PDFs; a different peak position results if some of the overlapping partials shift.

First peak in g(r) for Ni liquid/glass and crystals. a and b are the first peak position(r 1) in PDF and atomic volume, respectively, for Ni liquids/glasses at various temperatures under constant density or constant ambient pressure; c and d are r 1 and atomic volume, respectively, for Ni crystals at various temperatures under constant density or ambient pressure. The arrows in a–d indicate the process of simulation: the system was firstly quenched from high temperature to 100 K under ambient pressure, and then heated under constant density. Data in a–d are calculated according to the methods in refs. 33 and 35 with EAM potential developed by H. W. Sheng121
As the shift of the maximum of the first peak in g(r) with increasing temperature includes both configurational (inherent structure, local minimum in PEL) and thermal (deviation from the PEL minimum due to thermal activation) contributions, caution should be exercised before concluding on a particular origin or mechanism for the shift. This calls for a careful and quantitative analysis of the various sources listed above that affect the distribution of the constituent species/atoms in the first nearest-neighbor shell. For instance, a very recent literature has systematically considered the skewness of radial distribution functions for simple metallic or MG-forming liquids, and determined the mean bond length accurately (see ref. 88). Those results are very consistent with the discussion above in this section.
Hidden crystal-like topological order in MGs
As summarized before,25 the general atomic packing principle in MGs/liquids is to maximize polytetrahedral arrangements and triangulated shell faces. For example, for the full icosahedral packing the 12 shell atoms enclose an icosahedron composed of 20 tetrahedra.89, 90 Other types of characteristic motifs, while not containing full icosahedron, also favor fivefold packing topology as reflected by the high value of the third digit in the Voronoi index.11 Indeed, such local order in MGs/liquids has been extensively documented in the past couple of decades in numerous experimental studies using X-ray/neutron scattering and nanobeam electron diffraction,12, 39, 91,92,93 as well as computer simulations employing ab initio or empirical interatomic interaction potentials.10, 25, 30,31,32, 52, 63,64,65,66,67,68,69, 94, 95 However, there has also been recent claims of hidden crystal-like topological order in MGs36,37,38,39, 96, 97 in addition to colloidal disordered materials.98–100
One type of crystal-like order was the so-called local translation symmetry.36, 37, 101 This was invoked when analyzing the peaks of PDFs, g(r), as defined in Eq. (5). As shown in Fig. 7a, b, Liu et al. 36 employed both MD simulation and synchrotron X-ray scattering experiment to measure the peak positions in g(r), R i (for the ith peak), for various MGs/liquids.101 As illustrated in Fig. 7b, they summarized that the peak positions for MGs, normalized to that of the first peak R 1, are in the sequence of R i/R 1 ≈ 1, 1.73, 2, 2.65, 3.46…Liu et al. 36, 101 concluded that atomic packing in MGs can be described globally as the local translation symmetry superimposed on the spherical-periodic order, where the spherical-periodic order predicts102
that gives R i/R 1 = 1.0, 1.8, 2.6, 3.4…The spherical-periodic order was derived by Häussler et al.102 to optimize the resonance between the electronic system and the static structure as the Friedel oscillations are caused by the screening power of the electrons for amorphous systems (see detailed interpretation in ref. 102). The proposal of Liu et al.36 is that there is also local translational symmetry, mainly reflected by the splitting of the second peak in g(r) into two subpeaks (R 2 and R 3 in Fig. 7a, often regarded as a characteristic feature of the glassy state). They argued that the MG structure can be regarded as adding the local translational symmetry on top of the spherical periodicity. Taking this one step further, in a recent study by Wu et al.37 summarizing the peak positions of partial PDFs for MGs, the authors concluded that there is structural homology in the short-to-medium range, shared by glassy and crystalline metals. By comparing the R i/R 1with interatomic distances in face-centered cubic (fcc) and body-centered cubic (bcc) lattice spectrum, they report hidden orders in various MGs and envision that they are actually inherited partial crystalline order.

Atomic order derived from pair distribution function, g(r). a g(r) for MD-simulated Ni liquid at 2000 K and glass at 300 K. The peak positions are denoted by the short dashed lines. b R i /R 1, the ratio of the ith peak position normalized by that of the first peak, for 64 MGs, see ref. 36. c g(r) of Ta liquids at 3300 K (orange line) and its corresponding inherent structures (cyan line). The inset schematically depicts the second peak in g(r) with corresponding atomic order at the second nearest-neighbor shell. d Four different schemes of coordination polyhedra connections with the number of shared atoms from one to four, which are denoted as 1-atom, 2-atom, 3-atom, and 4-atom cluster connections, respectively. e g(r) for MD-simulated Ni80P20 MGs at 300 K. The decomposed pair distribution functions are shown for nearest-neighbors (NN), second nearest neighbor atoms via 1-atom, 2-atom, 3-atom, and 4-atom cluster connections. a–b are adapted from ref. 37 and c–e from ref. 70
However, such a structural picture combining local translational symmetry crystal order and spherical-periodical order becomes questionable as alternative explanations are available to account for the R i/R 1 ratios observed. First of all, the subpeaks (R 2 and R 3 in Fig. 7a) are within the second nearest-neighbor shell of pair correlation, as illustrated in Fig. 7c, and as such cannot be viewed separately as the second peak and the third peak (Fig. 7a, b and refs 70, 103–106). The second nearest-neighbor shell can be analyzed in terms of the connection of two nearest-neighbor coordination polyhedra sharing one, two, three or four atoms (denoted as 1-atom, 2-atom, 3-atom, and 4-atom connections, respectively, see Fig. 7d).70, 104 The contributions to the PDF intensity from the 1-atom (vertex sharing) and 3-atom connections (face sharing) are found to dominate over the 2-atom (edge sharing) and 4-atom connections. The composite effect when they overlap in g(r) leads to the splitting into two subpeaks (note that at large distances beyond the second shell, g(r) appears Gaussian-like because differences in polyhedra connections are smeared out). This scheme results in two subpeaks that are at ~ 1.73R 1 and ~ 2R 1, and if averaged give the position of the second shell at ~ 1.8R 1, which is basically the prediction given by the spherical-periodic order. Thus, the spherical-periodic order alone is able to depict the atomic packing in MGs, without the need of an additional crystal-like order, even though 2R 1 is reminiscent of translational order. In other words, the splitting of the second peak in g(r) for MGs does not necessarily require the emergence of local translational symmetry or crystal order.
Secondly, this splitting feature in g(r) is actually intrinsic and present even in the liquid state, when crystalline topological order is not present (and cannot be the responsible factor), as illustrated in Fig. 7c. This was shown in ref. 70, where the inherent structure of a MD-simulated equilibrium Ta liquid at 3300 K already exhibits the splitting second peak in g(r). This splitting feature encoded in the inherent structure is not observed in instantaneous configurations of high-temperature liquids, only because of the smearing due to thermal vibration. This is at odds with most of previously proposed mechanisms attributing the splitting solely to extra structural ordering during the transition from the liquid to the glassy state, including intensified icosahedral order,91 appearance of local translational symmetry,36, 101 or “Bergman triacontahedron” packing.107 Instead, the splitting second peak in g(r) for MGs can be inherited for the most part from the inherent structure of liquids, and not fundamentally determined by the appearance (or not) of new local order developed during cooling towards glass transition.
Nonetheless, it is interesting to note that in the study of Wu et al.,37 the R 2 position (the shorter-distance subpeak of the splitting second peak in g(r)) in amorphous Ni is close to 1.73R 1, which seems to correlate with a lattice distance in the corresponding FCC crystal; in contrast, the R 2 position (a bit away from 1.73R 1 and closer to\(\sqrt{\frac{8}{3}}\) R 1) in amorphous Fe is more reminiscent of a lattice distance in the corresponding BCC crystal. It is indeed intriguing that for R 2 there can be such a difference between amorphous Ni and Fe. More work is needed to confirm this correlation, i.e., whether the location of R 2 is always different for an amorphous phase derived from a FCC metal when compared with one derived from a BCC metal. If this is indeed universal, further work is needed to explain the selection of R 2, for example from the bond length differences and electronic structure perspectives.
Before closing this section, we note that in fully amorphous monolithic MGs, crystal-like order could be a naturally occurring competitor to SROs. Hwang et al. 38 observed nanoscale crystal-like superclusters in the Zr50Cu45Al5 MGs, in their model based on reverse Monte Carlo modeling constrained at short range by an empirical interatomic potential and at medium range by fluctuation electron microscopy data (as shown in Fig. 8a). A significant fraction of atoms in these superclusters are in crystal-like local environments forming nano-sized regions. But structural relaxation of a rapidly quenched glass decreased the fraction of crystal-like Voronoi polyhedra and increased the fraction of icosahedral-like Voronoi polyhedra, suggesting that the crystal-like environment is energetically unfavorable when the local region is on sub-nanometer scale. Zhang et al.108 studied another composition, Zr50Cu35Al15 MG, and suggested that better glass forming ability in Zr-Cu-Al alloy system may depend more on destabilizing crystal-like order than enhancing icosahedral structures. Even in the liquid state, Leocmach et al.100 proposed crystal-like clusters (fcc-like order) among colloidal supercooled liquids (sharing some similarity with metallic liquids), and derived that structural origin of the dynamical arrest is linked to the avoided crystallization, rather than the condensation of the local icosahedral order of the liquid. Moreover, even the icosahedral clusters in MGs were depicted to be distorted with partially FCC symmetry (see Fig. 8b) based on angstrom-beam electron diffraction of single icosahedron in combination with computer simulation.39 Such a combination of icosahedral order and partially FCC symmetry was suggested to be associated with the geometric frustration of local icosahedral structure in MGs. However, what they really observed was the increased number of fourfold and sixfold bonds, as reflected by the second and the fourth digits in the Voronoi indices. This indicates the distortion-reduced degree of the fivefold topology, but does not necessarily mean that there are indeed FCC packing with Voronoi index <0, 12, 0, 0> or BCC clusters with Voronoi index <0, 6, 0, 8>. Nevertheless, the role of crystal-like orders in MGs and metallic liquids, especially how they interact with the dominant locally favored motifs, warrants further in-depth studies.

a A region containing a crystal-like supercluster in the Zr50Cu45Al5 bulk metallic glass, which was analyzed by hybrid reverse Monte Carlo simulations of the structure by incorporating medium-range structure information from fluctuation electron microscopy data and short-range structure preference from an embedded atom potential.38 The atoms are colored by the fraction of pentagons in their Voronoi polyhedron. b Probability distribution of bond orientational order (w6) in a 12,000-atom MD model, together with the characteristic w6 for ideal fcc and icosahedron cluster;39 Structural connection between the ideal icosahedron, distorted icosahedron, and fcc cluster are schematically shown on the top of b. a is adapted from ref. 38 and b from ref. 39
Challenges and outlook
The overview of three examples in the previous sections shows that recent computational modeling has been very useful to the understanding of structural attributes in MGs and liquids. Specifically, (i) the dynamical slowdown in metallic glass-forming liquids as well as the liquid fragility are found to exhibit an apparent link with local structure ordering. (ii) Upon heating, the volume of metallic melts expands, but analysis indicates that this can be accompanied by an apparent negative shift of the first peak position in the PDF, which can arise from multiple reasons. (iii) While locally favored motifs such as icosahedral order have been extensively studied, the role of crystal-like order in MGs/liquids remains to be better characterized and understood.
We note here that these are challenging issues that still require further exploration. One example is the lack of a consensus whether crystal-like order is necessarily present and intrinsic to amorphous structures in MGs and metallic liquids, as discussed in the preceding section; in fact, it is even questionable if the “crystal-like order” reported in the literature can indeed be related to the symmetry in crystals. The jury is also still out regarding the conclusion of a temperature-induced bond contraction in simple metallic liquids due to decreasing coordination number (change in SRO), because the simple distance cutoff analysis on which this claim is based neglected the skewness of the non-Gaussian profile of the first peak in the g(r) of liquids. A more refined analysis capable of quantifying the temperature-exacerbated peak asymmetry may prove that the true bond length actually increases with rising temperature, although the location of the first peak maximum appears to shift to smaller r.
Also, while some structural metrics have been linked to the dynamical slowdown as well as liquid fragility, so far the correlation is crude and on limited length scales. It would be desirable to establish structural metrics in multi-dimension space aided by advanced algorithms, rather than from a highly-limited set of (usually single) structural indicators. The latter have been able to provide ad hoc correlations, such as the one with fragility discussed in this overview. But they do not establish causal, derivable, and universal structure-property relationships. One could also question if a limited set of indicators solely from static structure is enough to constitute a robust relationship with liquid dynamics. This is rooted in the nature of the MGs/liquids structure, where the subtle differences between similar local configurations make it practically impossible to predict the local relaxation events, even when the static structure (the coordinates of all atoms) is fully known. Two recent research directions seem promising to better resolve this problem. One is to employ advanced algorithm (e.g., machine learning methods) to characterize the multiplex structural environment (i.e., a combination of multiple indictors) with high accuracy and sensitivity. As demonstrated recently,43, 44 a new metric was identified by machine learning method to reveal flow defects or particles susceptible to rearrangement in jammed and glassy systems, giving rise to a new concept called “softness”, which characterizes local structure and is strongly correlated with liquid dynamics.
The other way is to incorporate the atomic vibrational information in addition to the commonly-studied static structure when describing liquid dynamics from the structural perspective.25, 26, 30,31,32, 52, 63,64,65,66,67,68,69 The combination of both static and dynamics structural information may lead more robust prediction of structure-property relationship for MGs as well. A recent example demonstrating this point is the flexibility volume,45 assessed via atomic vibrations that probe local configurational space and interaction between neighboring atoms. Such a parameter beyond just static structure was shown to better represent the MG structural state in the sense that the use of dynamics information allows quantitative prediction of the shear modulus and correlation with MG relaxation properties on both atomic/microscopic and macroscopic levels, and for all compositions and processing conditions. Generally speaking, static structure information plays a key role for MGs, but it alone is not sufficient, and incorporating dynamics information makes it possible to establish more robust structure-property relations. Dynamics information is well known to be predominantly important for liquids, but as mentioned earlier structural signature based on static order is also recognized in recent studies. Therefore, structural metrics combining both may unify MGs and liquids to pave the way towards a mathematically convenient description of the amorphous state.
In addition to atomic-level structure in amorphous alloys, the electronic structural basis of their properties need to be examined systematically in future work. Although previous work has explored various aspects such as the covalency, ionicity, density of states, and valence electron density in MGs,109,110,111,112,113 ample room remains to quantitatively relate electronic structure to properties of amorphous alloys (such as GFA, ductility, liquid fragility etc.) and to the short-to-medium range topological and chemical order. Another direction to pursue is structural metrics on longer length scales. They will prove very important in controlling the properties of MGs/liquids, because their critical behavior (e.g., shear banding, dynamical heterogeneity etc.) usually involve length scales at or beyond medium-range order.114,115,116,117
Before closing, we also note that to understand the evolution in MGs and metallic liquids, one may need to explore their corresponding stable and metastable crystalline phases. After all, glass formation is a kinetic arrest process that has successfully avoided the competing crystalline phases. Recently, Perim et al. 118 computed the geometrical and energetic features of competing crystalline phases using the AFLOW framework to assist in the prediction of glass forming ability. Sun et al. 119, 120 integrated genetic algorithm, ab initio simulation and cluster alignment method to reveal the most common energetically favorable motifs that transcend metallic crystals, glasses, and liquids. These appear to be new tactics for computational investigations of amorphous metals, especially by utilizing state-of-the-art algorithms and materials informatics.
References
Klement, W., Willens, R. H. & Duwez, P. Non-crystalline structure in solidified gold-silicon alloys. Nature 187, 869–870 (1960).
Greer, A. L. Metallic glasses, in Physical Metallurgy, 5th edn, (eds.Laughlin, D. E. & Hono, K.), Elsevier,305–385 (2014).
Johnson, W. Bulk glass-forming metallic alloys: science and technology. MRS Bull 24, 42–56 (1999).
Inoue, A. Stabilization of metallic supercooled liquid and bulk amorphous alloys. Acta Mater. 48, 279–306 (2000).
Wang, W. H., Dong, C. & Shek, C. H. Bulk metallic glasses. Mater. Sci. Eng. R. 44, 45–89 (2004).
Greer, A. L. & Ma, E. Bulk metallic glasses: at the cutting edge of metals research. MRS Bull. 32, 611–619 (2007).
Schroers, J. Bulk metallic glasses. Phys. Today 66, 32–37 (2013).
Gaskell, P. H. A new structural model for transtion metal-metalloid glasses. Nature 276, 484–485 (1978).
Miracle, D. B. A structural model for metallic glasses. Nat. Mater. 3, 697–702 (2004).
Sheng, H. W., Luo, W. K., Alamgir, F. M., Bai, J. M. & Ma, E. Atomic packing and short-to-medium-range order in metallic glasses. Nature 439, 419–425 (2006).
Ma, E. Tuning order in disorder. Nat. Mater. 14, 547–552 (2015).
Hirata, A. et al. Direct observation of local atomic order in a metallic glass. Nat. Mater. 10, 28–33 (2011).
Cheng, Y. Q., Ma, E. & Sheng, H. W. Atomic level structure in multicomponent bulk metallic glass. Phys. Rev. Lett. 102, 245501 (2009).
Schuh, C. A., Hufnagel, T. C. & Ramamurty, U. Mechanical behavior of amorphous alloys. Acta Mater. 55, 4067–4109 (2007).
Chen, M. W. Mechanical behavior of metallic glasses: microscopic understanding of strength and ductility. Annu. Rev. Mater. Res. 38, 445–469 (2008).
Wang, W. H. The elastic properties, elastic models and elastic perspectives of metallic glasses. Prog. Mater. Sci. 57, 487–656 (2012).
Spaepen, F. Microscopic mechanism for steady-state inhomogeneous flow in metallic glasses. Acta. Metall. 25, 407–415 (1977).
Argon, A. S. Plastic deformation in metallic glasses. Acta. Metall. 27, 47–58 (1979).
Falk, M. L. & Langer, J. S. Dynamics of viscoelastic deformation in amorphous solids. Phys. Rev. E. 57, 7192–7205 (1998).
Debenedetti, P. G. & Stillinger, F. H. Supercooled liquids and the glass transition. Nature 410, 259–267 (2001).
Stillinger, F. H. A topographic view of supercooled liquids and glass formation. Science 267, 1935–1939 (1995).
Angell, C. A. Formation of glasses from liquids and biopolymers. Science 267, 5206 (1995).
Busch, R., Schroers, J. & Wang, W. H. Thermodynamics and kinetics of bulk metallic glass. MRS Bull. 32, 620–623 (2007).
Egami, T. Atomic level stresses. Prog. Mater. Sci. 56, 637–653 (2011).
Cheng, Y. Q. & Ma, E. Atomic-level structure and structure-property relationship in metallic glasses. Prog. Mater. Sci. 56, 379–473 (2011).
Royall, C. P. & Williams, S. R. The role of local structure in dynamical arrest. Phys. Rep. 560, 1–75 (2015).
Hu, Y. C., Li, F. X., Li, M. Z., Bai, H. Y. & Wang, W. H. Five fold symmetry as indicator of dynamic arrest in metallic glass-forming liquids. Nat. Commun. 6, 8310 (2015).
Mauro, N. A., Blodgett, M., Johnson, M. L., Vogt, A. J. & Kelton, K. F. A structural signature of liquid fragility. Nat. Commun. 5, 4616 (2014).
Kelton, K. F. Kinetic and structural fragility – a correlation between structures and dynamics in metallic liquids and glasses. J. Phys.: Condens. Matter 29, 023002 (2017).
Ding, J., Cheng, Y. Q., Sheng, H. W. & Ma, E. Short-range structural signature of excess specific heat and fragility of metallic-glass-forming supercooled liquids. Phys. Rev. B. 85, 060201 (2012).
Ding, J., Cheng, Y. Q. & Ma, E. Charge-transfer-enhanced prism-type local order in amorphous Mg65Cu25Y10: short-to-medium-range structural evolution underlying liquid fragility and heat capacity. Acta Mater. 61, 3130–3140 (2013).
Jaiswal, A. et al. Atomic-scale dynamics of a model glass-forming metallic liquid: dynamical crossover, dynamical decoupling and dynamical clustering. Phys. Rev. B. 91, 134204 (2015).
Lou, H. B. et al. Negative expansions of interatomic distances in metallic melts. Proc. Natl. Acad. Sci. 110, 10068–10072 (2013).
Gangopadhyay, A. K. et al. Anomalous thermal contraction of the first coordination shell in metallic alloy liquids. J. Chem. Phys. 140, 044505 (2014).
Ding, J. et al. Temperature effects on atomic pair distribution functions of melts. J. Chem. Phys. 140, 064501 (2014).
Liu, X. J. et al. Metallic liquids and glasses: atomic order and global packing. Phys. Rev. Lett. 105, 155501 (2010).
Wu, Z. W., Li, M. Z., Wang, W. H. & Liu, K. X. Hidden topological order and its correlation with glass-forming ability in metallic glasses. Nat. Commun. 6, 6035 (2015).
Hwang, J. et al. Nanoscale structure and structural relaxation in Zr50Cu45Al5 bulk metallic glass. Phys. Rev. Lett. 108, 195505 (2012).
Hirata, A. et al. Geometric frustration of icosahedron in metallic glasses. Science 341, 376–379 (2013).
Ma, D., Stoica, A. D. & Wang, X. L. Power-law scaling and fractal nature of medium-range order in metallic glasses. Nat. Mater. 8, 30–34 (2009).
Chen, D. Z. et al. Fractal atomic-level percolation in metallic glasses. Science 349, 1306–1310 (2015).
Zeng, Q. S. et al. General 2.5 power law of metallic glasses. Proc. Natl Acad. Sci. 113, 1714–1718 (2016).
Cubuk, E. D. et al. Identifying structural flow defects in disordered solids using machine-learning methods. Phys. Rev. Lett. 114, 108001 (2015).
Schoenholz, S. S., Cubuk, E. D., Sussman, D. M., Kaxiras, E. & Liu, A. J. A structural approach to relaxation in glassy liquids. Nat. Phys. 12, 469–471 (2016).
Ding, J. et al. Universal structural parameter to quantitatively predict metallic glass properties. Nat. Commun. 7, 13733 (2016).
Widmer-Cooper, A., Perry, H., Harrowell, P. & Reichman, D. R. Irreversible reorganization in a supercooled liquid originates from localized soft modes. Nat. Phys. 4, 711–715 (2008).
Manning, M. L. & Liu, A. J. Vibrational modes identify soft spots in a sheared disordered packing. Phys. Rev. Lett. 107, 108302 (2011).
Ding, J., Patinet, S., Falk, M. L., Cheng, Y. Q. & Ma, E. Soft spots and their structural signature in a metallic glass. Proc. Natl Acad. Sci. 111, 14052 (2014).
Mosayebi, M., Ilg, P., Widmer-Cooper, A. & Del Gado, E. Soft modes and nonaffine rearrangements in the inherent structures of supercooled liquids. Phys. Rev. Lett. 112, 105503 (2014).
Allen, M. P. & Tildesley, D. J. Computer Simulation of Liquids (Clarendon Press, 1987).
Hafner, J. Ab-initio simulations of materials using VASP: density-functional theory and beyond. J. Comput. Chem. 29, 2044–2078 (2008).
Ding, J., Cheng, Y. Q. & Ma, E. Full icosahedra dominate local order in Cu64Zr36 metallic glass and supercooled liquid. Acta Mater. 69, 343–354 (2014).
Barducci, A., Bussi, G. & Parrinello, M. Well-tempered metadynamics: a smoothly converging and tunable free-energy method. Phys. Rev. Lett. 100, 020603 (2008).
Allen, R. J., Valeriani, C. & ten Wolde, P. R. Forward flux sampling for rare event simulations. J. Phys.: Condens. Matter 21, 463102 (2009).
Homer, E. R. & Schuh, C. A. Mesoscale modeling of amorphous metals by shear transformation zone dynamics. Acta Mater. 57, 2823–2833 (2009).
Li, L., Homer, E. R. & Schuh, C. A. Shear transformation zone dynamics model for metallic glasses incorporating free volume as a state variable. Acta. Mater. 61, 3347–3359 (2013).
Zhao, P. Y., Li, J. & Wang, Y. Z. Heterogeneously randomized STZ model of metallic glasses: softening and extreme value statistics during deformation. Int. J. Plasticity. 40, 1–22 (2013).
Johnson, W. L., Na, J. H. & Demetriou, M. D. Quantifying the origin of metallic glass formation. Nat. Commun. 7, 10313 (2016).
Novikov, V. N. & Sokolov, A. P. Poisson’s ratio and the fragility of glass-forming liquids. Nature 431, 961 (2004).
Wales, D. Energy Landscapes: Application to Clusters, Biomolecules and Glasses, 1st edn (Cambridge University Press, 2004).
Johnson, W. L., Demetriou, M. D., Harmon, J. S., Lind, M. L. & Samwer, K. Rheology and ultrasonic properties of metallic glass-forming liquids: a potential energy landscape perspective. MRS Bull. 32, 644–650 (2007).
Adams, G. & Gibbs, J. H. On the temperature dependence of cooperative relaxation properties in glass-forming liquids. J. Chem. Phys. 43, 139–146 (1965).
Pedersen, U., Schroder, T. B., Dyre, J. & Harrowell, P. Geometry of slow structural fluctuations in a supercooled binary alloy. Phys. Rev. Lett. 104, 105701 (2010).
Coslovich, D. Locally preferred structures and many-body static correlations in viscous liquids. Phys. Rev. E. 83, 051505 (2011).
Soklaski, R., Nussinov, Z., Markow, Z., Kelton, K. F. & Yang, L. Connectivity of icosahedral network and a dramatically growing static length scale in Cu-Zr binary metallic glasses. Phys. Rev. B. 87, 184203–184210 (2013).
Cheng, Y. Q., Sheng, H. W. & Ma, E. Relationship between structure, dynamics, and mechanical properties in metallic glass-forming alloys. Phys. Rev. B. 78, 014207–214212 (2008).
Wu, Z. W., Li, M. Z., Wang, W. H. & Liu, K. X. Correlation between structural relaxation and connectivity of icosahedral clusters in CuZr metallic glass-forming liquids. Phys. Rev. B. 88, 054202 (2013).
Zhang, Y. et al. Diffusion in a Cu-Zr metallic glass studied by microsecond-scale molecular dynamics simulation. Phys. Rev. B. 91, 180201(R) (2015).
Hao, S. G., Wang, C. Z., Kramer, M. J. & Ho, K. M. Microscopic origin of slow dynamics at the good glass forming composition range in Zr1-xCux metallic liquids. J. Appl. Phys. 107, 053511 (2010).
Ding, J., Ma, E., Asta, M. & Ritchie, R. O. Second-nearest-neighbor correlations from connection of atomic packing motifs in metallic glasses and liquids. Sci. Rep. 5, 17429 (2015).
Wei, S. et al. Linking structure to fragility in bulk metallic glass-forming liquids. Appl. Phys. Lett. 106, 181901 (2015).
Mauro, N. A. et al. Anomalous structural evolution and liquid fragility signatures in Cu-Zr and Cu-Hf liquids and glasses. Acta Mater. 61, 7411–7421 (2013).
Louzguine-Luzgin, D. V. et al. Structural basis for supercoled liquid fragility established by synchrotron-radiation method and computer simulation. J. Appl. Phys. 110, 043519 (2011).
Xue, R. J., Zhao, L. Z., Pan, M. X., Zhang, B. & Wang, W. H. Correlation between density of metallic glasses and dynamic fragility of metallic glass-forming liquids. J. Non-Cryst. Solids 425, 153–157 (2015).
Bendert, J. C., Gangopadhyay, A. K., Mauro, N. A. & Kelton, K. F. Volume expansion measurements in metallic liquids and their relation to fragility and glass forming ability: an energy landscape interpretation. Phys. Rev. Lett. 109, 185901 (2012).
Tanaka, H. Bond orientational order in liquids: towards a unified description of water-like anomalies, liquid-liquid transition, glass transition and crystallization. Eur. Phys. J. E. 35, 113 (2012).
Lagogianni, A. E., Krausser, J., Evenson, Z., Samwer, K. & Zaccone, A. Unifying interatomic potential, g(r), elasticity, viscosity and fragility of metallic glasses: analytical model, simulations and experiments. J. Stat. Mech. Theor. Exp. 2016, 084001 (2016).
Jaiswal, A., Egami, T., Kelton, K. F., Schweizer, K. S. & Zhang, Y. Correlation between fragility and the Arrhenius crossover phenomenon in metallic, molecular and network liquids. Phys. Rev. Lett. 117, 205701 (2016).
Jaiswal, A. et al. Onset of cooperative dynamics in an equilibrium glass-formation metallic liquids. J. Phys. Chem. B. 120, 1142–1148 (2016).
Iwashita, T., Nicholson, D. M. & Egami, T. Elementary excitation and crossover phenomenon in liquids. Phys. Rev. Lett. 110, 205504 (2013).
Hu, H. C., Li, F. X., Li, M. Z., Bai, H. Y. & Wang, W. H. Structural signatures evidenced in dynamic crossover phenomena in metallic glass-forming liquids. J. Appl. Phys. 119, 205108 (2016).
Soklaski, R., Tran, V., Nussinov, Z., Kelton, K. F. & Yang, L. A locally preferred structure characterizes all dynamical regimes of a supercooled liquid. Philo. Mag. 96, 1212–1227 (2016).
Larini, L., Ottochian, A., De Michele, C. & Leporini, D. Universal scaling between structural relaxation and vibrational dynamics in glass-forming liquids and polymers. Nat. Phys. 4, 42–45 (2007).
Buchenau, U., Zorn, R. & Ramos, M. A. Probing cooperative liquid dynamics with the mean square displacement. Phys. Rev. E. 90, 042312 (2014).
Tanaka, H., Kawasaki, T., Shintani, H. & Watanabe, K. Critical-like behavior of glass-forming liquids. Nat. Mater. 9, 324–331 (2010).
Kim, T. H. et al. In situ high energy x-ray diffraction study of the local structure of supercooled liquid Si. Phys. Rev. Lett. 95, 085501 (2005).
Flipponi, A. & Cicco, A. D. Short-range order in crystalline, amorphous, liquid, and supercooled germanium probed by x-ray-absorption spectroscopy. Phys. Rev. B. 51, 12322–12336 (1995).
Sukhomlinov, S. V. & Müser, M. H. Determination of accurate, mean bond lengths from radial distribution functions. J. Chem. Phys. 146, 024506 (2017).
Nelson, D. R. & Spaepen, F. Polytetrahedral order in condensed matter. Solid State Phys. 42, 1–90 (1989).
Jonsson, H. & Andersen, H. C. Icosahedral ordering in the Lennard-Jones liquid and glass. Phys. Rev. Lett. 60, 2295–2298 (1988).
Shen, Y. T., Kim, T. H., Gangopadhy, A. K. & Kelton, K. F. Icosahedral order, frustration, and the glass transition: evidence from time-dependent nucleation and supercooled liquid structure studies. Phys. Rev. Lett. 102, 057801 (2009).
Liu, A. C. Y. et al. Systematic mapping of icosahedral short-range order in a melt-spun Zr36Cu64 metallic glass. Phys. Rev. Lett. 110, 205505 (2013).
Schenk, T., Holland-Moritz, D., Simonet, V., Bellissent, R. & Herlach, D. M. Icosahedral short-range order in deeply undercooled metallic melts. Phys. Rev. Lett. 89, 075507 (2002).
Li, M. Z., Wang, C. Z., Hao, S. G., Kramer, M. J. & Ho, K. M. Structural heterogeneity and medium-range order in ZrxCu100-x metallic glasses. Phys. Rev. B. 80, 184201 (2009).
Ding, J., Asta, M. & Ritchie, R. O. Anomalous structure-property relationships in metallic glasses through pressure-mediated glass formation. Phys. Rev. B. 93, 140204 (2016).
Chen, G. L. et al. Molecular dynamic simulation and atomic structures of amorphous materials. Appl. Phys. Lett. 88, 203115 (2006).
Hirata, A., Hirotsu, Y., Nieh, T. G., Ohkubo, T. & Tanaka, N. Direct imaging of local atomic ordering in Pd-Ni-P bulk metallic glass using Cs-corrected transmission electron microscopy. Ultramicroscopy 107, 116–123 (2007).
Shintani, H. & Tanaka, H. Frustration on the way to crystallization in glass. Nat. Phys. 2, 200–206 (2006).
Watanabe, K. & Tanaka, H. Direct observation of medium-range crystalline order in granular liquids near the glass transition. Phys. Rev. Lett. 100, 158002 (2008).
Leocmach, M. & Tanaka, H. Roles of icosahedral and crystal-like order in the hard spheres glass transition. Nat. Commun. 3, 974 (2012).
Liu, X. J. et al. Atomic packing symmetry in the metallic liquid and glass states. Acta Mater. 59, 6480–6488 (2011).
Häussler, P. Interrelations between atomic and electronic structures—liquid and amorphous metals as model systems. Phys. Rep. 222, 65–143 (1992).
Bennett, C. H. Serially deposited amorphous aggregates of hard spheres. J. Appl. Phys. 43, 2727–2734 (1972).
Pan, S. P., Qin, J. Y., Wang, W. M. & Gu, T. K. Origin of splitting of the second peak in the pair-distribution function for metallic glasses. Phys. Rev. B. 84, 092201 (2011).
Luo, W. K., Sheng, H. W. & Ma, E. Pair correlation functions and structural building schemes in amorphous alloys. Appl. Phys. Lett. 89, 131927 (2006).
van de Waal, B. W. On the origin of second-peak splitting in the static structure factor of metallic glasses. J. Non-Cryst. Solids 189, 118–128 (1995).
Fang, X. W. et al. Spatially resolved distribution function and the medium-range order in metallic liquid and glass. Sci. Rep. 1, 194 (2011).
Zhang, P., Maldones, J. J., Besser, M. F., Kramer, M. J. & Voyles, P. M. Medium-range structure and glass-forming ability in Zr-Cu-Al bulk metallic glasses. Acta. Mater. 109, 103–114 (2016).
Mizutani, U. Electronic structure of metallic glasses. Prog. Mater. Sci. 28, 97–228 (1983).
Nagel, S. R. & Tauc, J. Nearly-free-electron approach to the theory of metallic glass alloys. Phys. Rev. Lett. 35, 380–383 (1975).
Ding, J. & Cheng, Y. Q. Charge transfer and atomic-level pressure in metallic glasses. Appl. Phys. Lett. 104, 051903 (2014).
Gu, X. J., Poon, J., Shiflet, G. J. & Widom, M. Ductility improvement of amorphous steel: roles of shear modulus and electronic structure. Acta Mater. 56, 88–94 (2008).
Han, G. et al. The e/a values of ideal metallic glasses in relation to cluster formulae. Acta Mater. 59, 5917–5923 (2011).
Greer, A. L., Cheng, Y. Q. & Ma, E. Shear bands in metallic glasses. Mater. Sci. Eng. R. 74, 71–132 (2013).
Ma, E. & Ding, J. Tailoring structural inhomogeneities in metallic glasses to enable tensile ductility at room temperature. Mater. Today 19, 568–579 (2016).
Demetriou, M. D., Launey, M. E., Garrett, G., Schramm, J. P. & Hofmann, D. C. et al. A damage tolerant glass. Nat. Mater. 10, 123–128 (2011).
Hufnagel, T. C., Schuh, C. A. & Falk, M. L. Deformation of metallic glasses, recent developments in theory, simulations and experiments. Acta Mater. 109, 375–393 (2016).
Perim, E. et al. Spectral descriptors for bulk metallic glasses based on the thermodynamics of competing crystalline phases. Nat. Commun. 7, 12315 (2016).
Sun, Y. et al. ‘Crystal genes’ in metallic liquids and glasses. Sci. Rep. 6, 23734 (2016).
Zhang, F. et al. Composition-dependent stability of the medium-range order responsible for metallic glass formation. Acta Mater. 81, 337–344 (2014).
Sheng, H. W., Kramer, M. J., Cadien, A., Fujita, T. & Chen, M. W. Highly optimized embedded-atom-method potentials for fourteen fcc metals. Phys. Rev. B. 83, 134118 (2011).
Acknowledgements
We thank Dr Yongqiang Cheng and Profs. Michael Falk, Howard Sheng, Mark Asta, Robert Ritchie for fruitful discussions and collaborations on the subject. The work at JHU was supported by NSF-DMR-1505621. J.D. was supported by the U.S. Department of Energy, Office of Basic Energy Sciences, Materials Sciences and Engineering Division, through the Mechanical Behavior of Materials Program (KC13) at Lawrence Berkeley National Laboratory under Contract No. DE-AC02-05CH11231.
Competing interests
The authors declare no conflict of interest.
Author information
Authors and Affiliations
Corresponding authors
Rights and permissions
This work is licensed under a Creative Commons Attribution 4.0 International License. The images or other third party material in this article are included in the article’s Creative Commons license, unless indicated otherwise in the credit line; if the material is not included under the Creative Commons license, users will need to obtain permission from the license holder to reproduce the material. To view a copy of this license, visit http://creativecommons.org/licenses/by/4.0/
About this article

Cite this article
Ding, J., Ma, E. Computational modeling sheds light on structural evolution in metallic glasses and supercooled liquids. npj Comput Mater 3, 9 (2017). https://doi.org/10.1038/s41524-017-0007-1
Received:
Revised:
Accepted:
Published:
DOI: https://doi.org/10.1038/s41524-017-0007-1
This article is cited by
-
Three-dimensional atomic packing in amorphous solids with liquid-like structure
Nature Materials (2022)
-
Phase selection rule of high-entropy metallic glasses with different short-to-medium-range orders
Rare Metals (2022)
-
Determining the three-dimensional atomic structure of an amorphous solid
Nature (2021)
-
Understanding the Effect of Oxygen on the Glass-Forming Ability of Zr55Cu55Al9Be9 Bulk Metallic Glass by ab initio Molecular Dynamics Simulations
Metallurgical and Materials Transactions A (2021)
-
The critical model size for simulating the structure-dynamics correlation in bulk metallic glasses
Science China Materials (2021)
