
arising from X. Yang et al. Nature Communications https://doi.org/10.1038/s41467-021-26330-8 (2021)
Hybridization and polyploidization are important driving forces in angiosperm evolution, resulting in novel phenotypes capable of prompting ecological diversification and invasion of new niches1. The genus Papaver (Papaveraceae) contains many taxa used in the pharmaceutical and culinary industries and as ornamental plants2. Yang et al. assembled de novo two chromosome-level genomes of P. rhoeas (common poppy, 2n = 14) and P. setigerum (Troy poppy, 2n = 44), and improved the P. somniferum genome assembly (opium poppy, 2n = 22)3. These high-quality, chromosome-scale genome assemblies represent a valuable resource for studying the early evolutionary history of eudicots and the evolution of morphinan biosynthesis. Based on synteny and phylogenomic analyses, the authors identified two rounds of whole-genome duplication (WGD), one in the ancestor to P. setigerum and P. somniferum (WGD-1) at ~7.2 million years ago (MYA), and one lineage-specific WGD-2 in P. setigerum at ~4.0 MYA. In the absence of effective subgenome-phasing techniques, they proposed complex models to explain the extensive genome reorganization and gene family evolution built upon the duplication of the genome itself (their Figs. 2–4 and Supplementary Figs 27–34). Leveraging the recent developments in subgenome-phasing method published by Jia et al.4, we propose an alternative model, i.e., reticulate allopolyploidization, to account for the evolution and the genomic diversity of these three Papaver species. Our hypothesis is supported by the following lines of evidence:
-
1.
We extracted 4,791 anchor genes from the inter-genomic syntenic blocks at a ratio of 1:2:4 in P. rhoeas, P. somniferum and P. setigerum using OrthoFinder v2.3.15 and MCScanX6 (Supplementary Figs. 1A, 2–3). According to the WGD model proposed by Yang et al.3, P. setigerum should have two sister-pairs of homoeologous subgenomes appearing as sisters to the subgenomes of P. somniferum (Fig. 1A). We inferred the maximum likelihood (ML) trees for each gene and the concatenated sequences of all genes in the same homoeologous chromosome sets (macro-synteny) using IQ-TREE v1.6.127, with P. rhoeas as the outgroup. The top six gene tree topologies, supported by 4,231 (88%) of the 4,791 gene trees (Supplementary Fig. 4), show that orthologous gene pairs from P. somniferum and P. setigerum group together, and are sister to the homoeologous genes from P. setigerum. None of the topologies comprising at least 50 gene trees (Supplementary Fig. 4) agree with the WGD model shown in Fig. 1A, and most gene trees (43% of the 4791) support the hypothesis that P. somniferum and P. setigerum were derived from a reticulate origin (Supplementary Fig. 4; Fig. 1B). In addition, we obtained 15 groups of concatenated gene trees (macro-synteny trees) with at least 100 syntenic genes, and the topologies of these macro-synteny trees are identical to the most gene trees (Supplementary Fig. 5), which further supports the model presented in Fig. 1B rather than that in Fig. 1A.
Fig. 1: The origin and evolution of the subgenomes in the three studied Papaver species. 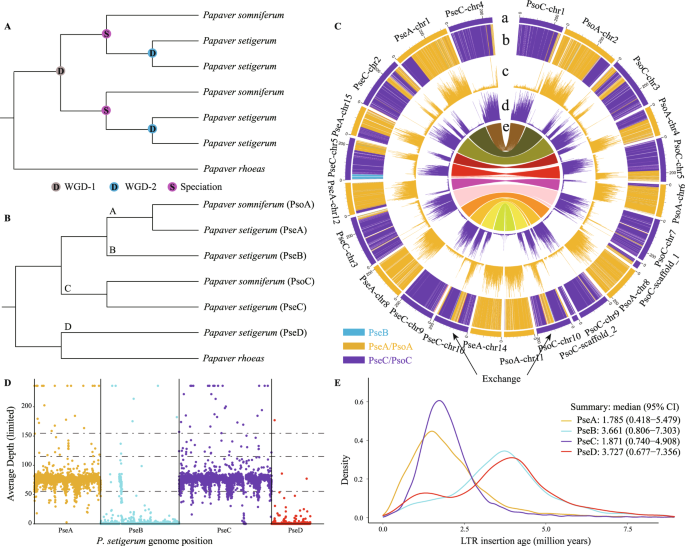
A Phylogenomic relationships among the subgenomes assuming the whole-genome duplication (WGD) model of Yang et al.3. B Tree topology recovered by gene trees, macro-synteny trees, and species/subgenome trees (see Supplementary Figs. 4, 5, 8 for details). The four subgenomes of P. setigerum are designated PseA, PseB, PseC and PseD; the two subgenomes of P. somniferum are designated PsoA and PsoC, and their ancestors are designated A–D. C Circos plot of subgenome partitions of P. somniferum and P. setigerum genomes (more details in Supplementary Figs. 6, 7) indicates that PseA and PsoA, and PseC and PsoC share almost all subgenomic exchanges except a segment in PseC-chr5 that shows exchange with PseB. (a) Subgenome assignment of chromosomes based on the k-means algorithm. (b) Significant enrichment of subgenome-specific k-mers (subgenome partitions). Partitions with the same color as that of a subgenome indicates significant enrichment of k-mers specific to that subgenome. The white areas are not significantly enriched. (c–d) Count (absolute) of each subgenome-specific k-mer set. (e) Homoeologous blocks between the two species. All statistics (b–d) were computed in sliding windows of 1 Mb. Exchanges between subgenomes, such as that in the middle regions of PseC-chr10 and PsoC-chr10, are inferred from inconsistencies between subgenome assignments calculated using chromosomes (ring a) and windows (rings b–d). D The mapping depth of Illumina sequencing reads from P. somniferum to P. setigerum subgenomes. E Insertion times of subgenome-specific LTR-RTs. The 95% confidence intervals (CI) of the insertion times are used to infer the time boundary of divergence to hybridization period.
-
2.
We phased the subgenomes of P. somniferum and P. setigerum using SubPhaser v1.24 (Supplementary Fig. 1B, C, Supplementary Figs. 6, 7), and extracted orthogroups across 23 species/subgenomes, including two subgenomes of P. somniferum, four subgenomes of P. setigerum, P. rhoeas, and representative lineages of other angiosperms, using OrthoFinder (Supplementary Fig. 8). We then inferred species/subgenome trees using the ML and coalescence-based methods (Supplementary Fig. 8). The topologies of these subgenome trees were consistent with those of the most gene trees (Supplementary Figs. 4, 5), which support the model presented in Fig. 1B. We named the four subgenomes of P. setigerum as PseA, PseB, PseC and PseD, and the two subgenomes of P. somniferum as PsoA and PsoC according to their phylogenetic relationships (Fig. 1B). Our data suggest that PseA and PsoA, and PseC and PsoC, are derived from separate common ancestors (designated A and C) (Fig. 1B). The A subgenome is sister to PseB, and the combined A/B clade is sister to the C subgenome (Fig. 1B, Supplementary Fig. 8). PseD is sister to P. rhoeas and that clade is sister to the combined A + B + C clade (Fig. 1B, Supplementary Fig. 8).
-
3.
We identified exchanges between homoeologous subgenomes in P. somniferum and P. setigerum using SubPhaser (Supplementary Figs. 6, 7; Supplementary Tables 1, 2). We found that the pattern of exchanges on each chromosome between PsoA and PsoC is almost identical to that between PseA and PseC (except for a single exchange between PseB and PseC; Fig. 1C, Supplementary Figs. 6, 7). We then mapped the Illumina sequencing reads from P. somniferum to the P. setigerum subgenomes (Supplementary Fig. 1B) using sppIDer8. The coverage depth plot showed that almost all the P. somniferum reads mapped to PseA and PseC, and very few reads mapped to PseB (i.e. the region exchanged between PseB and PseC) (Fig. 1D). Syntenic dot plots between the subgenomes showed that PsoA and PsoC had greater similarity (lower Ks) with PseA and PseC, respectively, but higher Ks with PseB and PseD (Supplementary Fig. 2). These results strongly suggest that P. somniferum and the two subgenomes PseA and PseC of P. setigerum were derived from a common allotetraploid ancestor (designated AC). This suggestion agrees with previous cytological evidence that hybrids between P. somniferum (2n = 22) and P. setigerum (2n = 44) had around 11 bivalents (mean 10.7II + 11.6I) at metaphase I9.
-
4.
There are two possible processes that could lead to the genomic pattern observed in P. setigerum: (i) AC hybridized with the ancestors of PseB and PseD separately in a stepwise process; or (ii) the ancestors of PseB and PseD hybridized, forming an allotetraploid (designated BD), then BD hybridized with AC forming the allooctoploid progenitor of P. setigerum. To test these two scenarios, we first removed all the potential exchanges between subgenomes of P. setigerum, and identified the subgenome-specific long terminal repeat retrotransposons (LTR-RTs) using SubPhaser (Supplementary Fig. 1D). Then we estimated the insertion times of subgenome-specific LTR-RTs in P. setigerum to represent the time boundaries from subgenomes differentiation to allohybridization. The estimated PseA- and PseC-specific LTR-RTs insertion times were similar, ranging from ~5 to ~0.5 MYA (95% confidence interval; Fig. 1E). Similarly, the PseB- and PseD-specific LTR-RTs insertion times were also similar (ranging from ~7.3 to ~0.7 MYA) but distinct from those of PseA and PseC (Fig. 1E), suggesting that PseB and PseD were more likely to have been introduced into the P. setigerum genome at the same time. Thus, we favored the second scenario, i.e. that the ancestors of PseB and PseD formed an allotetraploid BD, then BD hybridized with AC forming the allooctoploid progenitor of P. setigerum.
-
5.
To test whether other potential progenitors were involved in the evolution of these three species, we downloaded all the available sequencing data of Papaver species from public databases (see Data Availability for details), and assembled the genes of each species using the HybPiper pipeline10. We then extracted 1,474 single-copy genes, and inferred a species tree using ASTRAL-MP v5.14.511. The results suggested that subgenome PseD, P. rhoeas and P. dubium originated from a common ancestor (Supplementary Fig. 9). Similar to P. rhoeas3, P. dubium showed no evidence of recent WGD (Supplementary Fig. 10), suggesting it could not be a direct tetraploid progenitor (BD) of P. setigerum. We did not find closely related species for the subgenomes A, B and C, suggesting either the extinction of related ancestors or a sampling gap in taxon coverage. The tree inferred from the whole chloroplast genomes further suggested that P. somniferum was the most likely direct maternal progenitor of P. setigerum (Supplementary Fig. 11). Patterns of genome organization in P. setigerum and P. somniferum suggest that post-polyploidization diploidization is probably still ongoing within the two species as there was no largely biased gene fractionation observed in the subgenomes (Supplementary Fig. 12).

In summary, our comprehensive set of analyses confirmed the two rounds of WGDs previously documented3, but we uncovered a reticulate allopolyploidization scenario of evolution in the three studied Papaver species (Fig. 2A), involving four ancient diploid genomes (i.e. A, B, C, D) and two tetraploid genomes (i.e. AC and BD). Their most recent common ancestor (MRCA) first diverged into A, B, C, D and P. rhoeas at ~4.7–7.3 MYA. B and D then hybridized, resulting in the allotetraploid BD at ~0.91 MYA. The hybridization between A and C occurred ~0.74–0.26 MYA, resulting in the allotetraploid AC, which led to the formation of P. somniferum ~0.66 MYA. AC and BD hybridized, resulting in P. setigerum at ~0.44 MYA. Genetic exchange between PseB and PseC occurred later. On-going post-polyploidization diploidization resulted in the genome structure we observe in present-day species. However, accurately reconstruction of the genome rearrangements during the allopolyploidization and re-diploidization history remains a challenge with our current methodologies and would require further investigation. Our revision of the speciation and genome evolution model from Yang et al.3 has implications for understanding not only the role of reticulation in Papaver diversification, but also the evolution of the morphinan and noscapine biosynthesis pathways. Under our genome evolution model, the STORR gene fusion event is therefore most likely to have occurred in the ancestor of A and C, or even earlier in the MRCA of this species complex, and was brought to the genomes of P. somniferum and P. setigerum via hybridization (Fig. 2, Supplementary Figs. 13–15; detailed explanations in Supplementary Note 1), rather than through a post-WGD-1 fusion-translocation event and then duplication following WGD-2, as proposed by Yang et al.3. Our model is consistent with a recent study which shows that the STORR gene fusion event occurred only once, taking place between 16.8–24.1 MYA, prior to the speciation of this species complex12.

The times of species/subgenomes divergence and hybridization shown on the topology were based on median Ks values and the subgenome-specific LTR-RT insertion times, respectively, see Supplementary Tables 3, 4 for details. The currently retained copies of STORR and its pre-fusion modules are sorted to subgenomes (see more details in Supplementary Figs. 13–15). Purple and blue denote the cytochrome P450 and oxidoreductase modules, respectively, to correspond with the scheme of Fig. 3a in Yang et al.3.
Methods
Reconstruction of gene and macro-synteny trees for the three studied Papaver species
Syntenic blocks within the three Papaver species were identified with OrthoFinder v2.3.15. Orthologous and paralogous relationships, as well as orthogroups, were inferred using the parameters “-M msa -T fasttree” based on proteome sequences from multiple species. The resulting gene pairs were used to call collinear/syntenic blocks using MCScanX (parameters: -a -b 0 -c 0)6. For syntenic homologous gene pairs, Ks was calculated using the ParaAT pipeline13 (Supplementary Figs. 2–3). Briefly, the protein sequences of each gene pair were first aligned in MUSCLE v3.8.42514, and the alignment was then converted to a codon alignment using PAL2NAL v1415. The Ks was finally calculated using KaKs_Calculator v2.016 with the YN model17.
We then extracted 4,791 anchor genes from the inter-genomic syntenic blocks in P. rhoeas, P. somniferum and P. setigerum with a ratio of exactly 1:2:4. To reconstruct the gene trees, the homoeologous gene sequences were aligned with MAFFT v7.48118 and trimmed with trimAl v1.219 using a heuristic selection optimized for maximum likelihood (ML) phylogenetic tree reconstruction. Then, the ML tree (Supplementary Fig. 4) was inferred using IQ-TREE v1.6.127 with 1000 bootstraps20. The 1:2:4 genes located on the same chromosome set were considered as macro-synteny, and two methods were used to infer the macro-synteny trees (Supplementary Fig. 5): the ML and the coalescence-based method. For the ML method, the gene alignments generated earlier were concatenated, and a tree was reconstructed using IQ-TREE7 with 1000 bootstraps20. For the coalescence-based method, the gene trees were input into ASTRAL (MP-5.14.5)11 to infer the tree based on coalescence.
Phasing the subgenomes of P. somniferum and P. setigerum, and inference of species/subgenome trees
We used SubPhaser (parameters: -q 150 -exclude_exchanges)4 to phase and partition the subgenomes of P. somniferum and P. setigerum (Supplementary Figs. 6–7). In brief, chromosomes of a neoallopolyploid were assigned to subgenomes based on differential repetitive k-mers that were assumed to have expanded during the period of independent evolution after divergence from the nearest common ancestor and before the hybridization of the parental progenitors (the so-called divergence–hybridization period). A subgenome is considered to be well-phased when it displays distinct patterns of both differential k-mers and homoeologous chromosomes, confirming the presence of subgenome-specific features, as expected.
We considered each subgenome as an independent pseudo-species for the subsequent phylogenomic analyses. We additionally collected genomic data from 15 other taxa in the Ranunculales and other angiosperm lineages, as well as RNA-Seq data from P. bracteatum, from published papers and public databases (see Data Availability for details). The transcriptome of P. bracteatum was first de novo assembled using Trinity v2.6.621 and the coding region of each transcript was annotated using TransDecoder v5.2.0 (https://github.com/TransDecoder/TransDecoder/). Only transcripts with the longest coding region for each gene were retained, and only genes with complete coding regions were used for downstream analyses. We inferred orthogroups from these data using OrthoFinder v2.3.15 as described above. Finally, we inferred the species/subgenome trees (Supplementary Fig. 8) using both ML and coalescence-based methods, as described earlier.
Identification and validation of exchanges between subgenomes
The identification of exchanges between subgenomes (Supplementary Figs. 6–7, Fig. 1C) was carried out using SubPhaser4 in a semi-automated process. SubPhaser assigned each 1 Mb genomic window to subgenomes and flagged windows with enrichments that did not match the subgenome assignments of their chromosome as potential exchanges. These were further checked manually to determine whether they were bona fide exchanges or not. For example, in the middle of C-Pse-chr10 (Supplementary Fig. 6D), subgenome A-specific k-mers showed continuous significant enrichments (2nd circle from outer to inner circles), and the abundance of subgenome A-specific k-mers was comparable to those on subgenome A chromosomes (4th circle) which contrasted with the other subgenomes (5–7th circles). Based on these observations, we confidently concluded that an exchange had occurred.
After manually checking, we excluded short exchanges with lengths of less than 5 Mb (Supplementary Tables 1–2). As unbalanced exchanges were expected to have syntenic blocks within subgenomes, we validated them through syntenic analyses (Supplementary Figs. 2–3). For example, we observed an exchange where the segment at the 5ʹ end of PseC-15 had been exchanged to the 3ʹ end of PseB-17, resulting in a large syntenic block between PseB-17-3’ and naive PsoB-5-5’ (Supplementary Fig. 2). Due to this imbalance, subgenome PseB now has two copies of this homoeologous segment, leading to a large syntenic block between PseB-17-3’ and PseB-13-3’ where the PseB-naive homoeologous segment is located (Supplementary Fig. 3).
Comparison of genomic composition of P. somniferum and P. setigerum
We used the sppIDer8 pipeline to confirm the genomic composition of P. somniferum and P. setigerum (Fig. 1D). This involved mapping short-read sequencing data from P. somniferum to the genome of P. setigerum to assess the genomic contribution and relative ploidy of each of the subgenomes.
Identification of potential progenitor species with other Papaver species
To identify potential progenitor species, all available sequencing data (i.e. the genome skimming data) from Papaver species were downloaded from public databases (see Data Availability for details). The genome skimming data were assembled using the HybPiper pipeline10, where the short sequencing reads were mapped to each homologous gene group using BWA-MEM v0.7.1722, and assembled with SPAdes v3.13.123. The coding regions were then annotated with exonerate v2.2.024. A total of 1474 single-copy genes were extracted, and a species tree (Supplementary Fig. 9) was inferred using methods described above.
P. dubium has the potential to be the tetraploid progenitor (BD) of P. setigerum. To explore this possibility further, we downloaded the transcript sequences of P. dubium subsp. lecoqii from a recent study12 and annotated the coding regions using TransDecoder v5.2.0. Next, we inferred orthogroups with OrthoFinder v2.3.15 and calculated Ks for both orthologous and paralogous gene pairs using the ParaAT pipeline13. Using the Ks-based method, we inferred potential recent WGD events in P. dubium subsp. lecoqii (Supplementary Fig. 10).
Identification of potential maternal parent using the chloroplast tree
To determine the potential maternal parent of P. somniferum and P. setigerum, we assembled chloroplast genomes from short-read sequencing data of Papaver species using GetOrganelle v1.6.2e (parameters: -w 115 -R 13)25. The assembled genomes were then annotated using the OGAP pipeline (https://github.com/zhangrengang/ogap). Based on whole plastome sequences of Papaver and related taxa, a phylogenomic tree (Supplementary Fig. 11) was inferred using IQ-TREE7 with 1000 bootstraps20.
Estimation of divergence and hybridization times
The timing of species/subgenome divergence and hybridization (Supplementary Tables 3–4, Supplementary Figs. 6–7, Fig. 1E) were estimated with two methods: the LTR-based method and the Ks-based method. Subgenome-specific long terminal repeat retrotransposons (LTR-RTs) are expected to undergo a burst of activity during the divergence–hybridization period. We employed SubPhaser, which uses subgenome-specific LTR-RTs to estimate the upper and lower boundaries of the divergence–hybridization period by applying a symmetric 95% percentile-based confidence interval to the subgenome-specific LTR insertion ages. The analysis excluded any potential exchanged LTR-RTs. Due to the large uncertainty in time estimation using LTR-RTs (particularly for the divergence time)4, a traditional Ks-based method3 was also used to estimate the divergence time independently, based on a divergence time of P. somniferum–P. rhoeas (7.7 MYA3). The estimated times were calculated using the formula 1:
assuming an equal substitution rate per year.
Assignment of subgenome and building gene phylogenies for STORR-related loci
Subgenomes for STORR-related loci (Supplementary Figs. 13–15, Fig. 2) were determined by their locations on subgenome segments (Supplementary Tables 1–2) using bedtools v2.27.126. Gene trees (Supplementary Figs. 13–14) were reconstructed using IQ-TREE7 with 1000 bootstraps20.
Reporting summary
Further information on research design is available in the Nature Portfolio Reporting Summary linked to this article.
Data availability
The chloroplast genome sequences assembled in this study have been deposited in the GenBank database under the accession codes OM174280–OM174296. Assemblies of transcriptome and genome skimming data of Papaver generated in this study are available at figshare [https://doi.org/10.6084/m9.figshare.20323995.v1]. Genome assemblies of P. rhoeas, P. somniferum and P. setigerum were downloaded from the National Genomics Data Center (NGDC) Genome Warehouse (GWH) database under the BioProject accession PRJCA004217. Gene annotations of P. rhoeas, P. somniferum and P. setigerum were downloaded from GitHub [https://github.com/xjtu-omics/Papaver-Genomics/]. Raw genome sequencing reads of P. rhoeas, P. somniferum and P. setigerum were downloaded from the NCBI Sequence Read Archive (SRA) database under the BioProject accession PRJNA720042. Gene annotations of Macleaya cordata, Kingdonia uniflora, Tetracentron sinense, Coptis chinensis, and Prunus persica were downloaded from the NCBI GenBank/RefSeq databases under the accessions GCA_002174775.1, GCA_014058105.1, GCA_015143295.1, GCA_015680905.1 and GCF_000346465.2, respectively. Gene annotations of Vitis vinifera v2.1 [https://phytozome-next.jgi.doe.gov/info/Vvinifera_v2_1] and Aquilegia coerulea v3.1 [https://phytozome-next.jgi.doe.gov/info/Acoerulea_v3_1] were taken from the Phytozome database. Gene annotations of Macadamia integrifolia were downloaded from the NGDC GWH database under the accession GWHBAUK00000000.1 [https://ngdc.cncb.ac.cn/gwh/Assembly/23196/show]. Gene annotations of Amborella trichopoda v6.1 were downloaded from the CoGe database [https://genomevolution.org/coge/GenomeInfo.pl?gid=50948]. Gene annotations of Trochodendron aralioides were taken from the GigaDB database [http://gigadb.org/dataset/100657]. Gene annotation of Coffea canephora were downloaded from the Coffee Genome Hub [https://coffee-genome-hub.southgreen.fr/node/1/2]. Gene annotations of Nelumbo nucifera China Antique v2.0 were downloaded from the Nelumbo Genome Database [http://nelumbo.biocloud.net/page/download/download]. Gene annotations of Eschscholzia californica v1.0 were from the Eschscholzia Genome DataBase [https://drive.google.com/drive/folders/1MIUdVBRBvaIizy75JVI9uh9afd_SYXLo]. Gene annotations of Aquilegia oxysepala [https://doi.org/10.1038/s41438-020-0328-y] and Akebia trifoliata [https://doi.org/10.1038/s41438-020-00458-y] were obtained from the corresponding authors. Raw genome skimming sequencing data of 16 Papaver species were downloaded from the NCBI SRA database under the BioProject accession PRJEB43865. Raw transcriptome sequencing data of P. bracteatum were downloaded from the NCBI SRA database under the BioProject accession PRJEB21674. A transcriptome shotgun assembly of P. dubium subsp. lecoqii was downloaded from the NCBI GenBank database under the accession GJOS00000000.1. Chloroplast genome sequences of Papaver and related taxa were downloaded from the NCBI GenBank/RefSeq databases with accessions MK820043.1, NC_029434.1, NC_037831.1, NC_037832.1, MW411801.1, OK349678.1, MK533647.1, NC_050878.1, NC_056996.1, NC_050877.1, NC_056967.1, NC_039625.1, MK281585.1, NC_039623.1, and NC_029427.1. Source data are provided with this paper.
Code availability
The codes used for phasing subgenomes can be found at Github [https://github.com/zhangrengang/SubPhaser]27.
References
Otto, S. P. & Whitton, J. Polyploid incidence and evolution. Annu. Rev. Genet. 34, 401–437 (2000).
Butnariu, M. et al. Papaver plants: current insights on phytochemical and nutritional composition along with biotechnological applications. Oxid. Med. Cell. Longev. 2022, 2041769 (2022).
Yang, X. et al. Three chromosome-scale Papaver genomes reveal punctuated patchwork evolution of the morphinan and noscapine biosynthesis pathway. Nat. Commun. 12, 6030 (2021).
Jia, K. H. et al. SubPhaser: a robust allopolyploid subgenome phasing method based on subgenome‐specific k‐mers. New Phytol. 235, 801–809 (2022).
Emms, D. M. & Kelly, S. OrthoFinder: phylogenetic orthology inference for comparative genomics. Genome Biol. 20, 238 (2019).
Wang, Y. et al. MCScanX: a toolkit for detection and evolutionary analysis of gene synteny and collinearity. Nucleic Acids Res. 40, e49 (2012).
Nguyen, L. T., Schmidt, H. A., von Haeseler, A. & Minh, B. Q. IQ-TREE: a fast and effective stochastic algorithm for estimating maximum-likelihood phylogenies. Mol. Biol. Evol. 32, 268–274 (2015).
Langdon, Q. K., Peris, D., Kyle, B. & Hittinger, C. T. sppIDer: a species identification tool to investigate hybrid genomes with high-throughput sequencing. Mol. Biol. Evol. 35, 2835–2849 (2018).
Malik, C. P., Mary, T. N. & Grover, I. S. Cytogenetic studies in Papaver V. Cytogenetic studies on P. somniferum × P. setigerum hybrids and amphiploids. Cytologia 44, 59–69 (1979).
Johnson, M. G. et al. HybPiper: extracting coding sequence and introns for phylogenetics from high‐throughput sequencing reads using target enrichment. Appl. Plant Sci. 4, 1600016 (2016).
Yin, J., Zhang, C. & Mirarab, S. ASTRAL-MP: scaling ASTRAL to very large datasets using randomization and parallelization. Bioinformatics 35, 3961–3969 (2019).
Catania, T. et al. A functionally conserved STORR gene fusion in Papaver species that diverged 16.8 million years ago. Nat. Commun. 13, 3150 (2022).
Zhang, Z. et al. ParaAT: a parallel tool for constructing multiple protein-coding DNA alignments. Biochem. Biophys. Res. Commun. 419, 779–781 (2012).
Edgar, R. C. MUSCLE: multiple sequence alignment with high accuracy and high throughput. Nucleic Acids Res. 32, 1792–1797 (2004).
Suyama, M., Torrents, D. & Bork, P. PAL2NAL: robust conversion of protein sequence alignments into the corresponding codon alignments. Nucleic Acids Res. 34, W609–W612 (2006).
Wang, D., Zhang, Y., Zhang, Z., Zhu, J. & Yu, J. KaKs_Calculator 2.0: a toolkit incorporating gamma-series methods and sliding window strategies. Genom. Proteom. Bioinf. 8, 77–80 (2010).
Yang, Z. & Nielsen, R. Estimating synonymous and nonsynonymous substitution rates under realistic evolutionary models. Mol. Biol. Evol. 17, 32–43 (2000).
Katoh, K. & Standley, D. M. MAFFT multiple sequence alignment software version 7: improvements in performance and usability. Mol. Biol. Evol. 30, 772–780 (2013).
Capella-Gutiérrez, S., Silla-Martínez, J. M. & Gabaldón, T. trimAl: a tool for automated alignment trimming in large-scale phylogenetic analyses. Bioinformatics 25, 1972–1973 (2009).
Hoang, D. T., Chernomor, O., von Haeseler, A., Minh, B. Q. & Vinh, L. S. UFBoot2: improving the ultrafast bootstrap approximation. Mol. Biol. Evol. 35, 518–522 (2018).
Grabherr, M. G. et al. Full-length transcriptome assembly from RNA-Seq data without a reference genome. Nat. Biotechnol. 29, 644–652 (2011).
Li, H. Aligning sequence reads, clone sequences and assembly contigs with BWA-MEM. arXiv 1303, 3997 (2013).
Bankevich, A. et al. SPAdes: a new genome assembly algorithm and its applications to single-cell sequencing. J. Comput. Biol. 19, 455–477 (2012).
Slater, G. S. & Birney, E. Automated generation of heuristics for biological sequence comparison. BMC Bioinform. 6, 31 (2005).
Jin, J. J. et al. GetOrganelle: a fast and versatile toolkit for accurate de novo assembly of organelle genomes. Genome Biol. 21, 241 (2020).
Quinlan, A. R. & Hall, I. M. BEDTools: a flexible suite of utilities for comparing genomic features. Bioinformatics 26, 841–842 (2010).
Zhang R. G. Subgenome-aware analyses suggest a reticulate allopolyploidization origin in three Papaver genomes. Zenodo, https://doi.org/10.5281/zenodo.7790632 (2023).
Acknowledgements
We thank Prof. Xiao-Ru Wang for helpful discussions and revision of the manuscript. YPM is supported by the National Key Research and Development Program (2022YFF1301702), the Natural Science Foundation and Ten Thousand Talent Program of Yunnan Province (202001AS070019, YNWR-QNBJ-2018-174) and the “Light of West China” Program. KHJ is supported by the Agricultural Science and Technology Innovation Project of SAAS (CXGC2023F13). WZ is supported by the Swedish Research Council (VR, 2017-04686).
Author information
Authors and Affiliations
Contributions
R.G.Z., K.H.J., Y.P.M. and W.Z. conceived and designed the study; R.G.Z., C.L., G.Y.L., J.L., L.W., Z.X.W., Z.C., D.L., Y.Z., T.L.S., W.Z., Z.H.T., and J.F.M. collected and analyzed the data; R.G.Z., K.H.J., W.Z. T.L.S. and Z.X.W. prepared figures and tables; W.Z., K.H.J. and R.G.Z. wrote the manuscript; R.G.Z., K.H.J., Y.P.M. and W.Z. revised the manuscript; all authors approved the final manuscript.
Corresponding authors
Ethics declarations
Competing interests
The authors declare no competing interests.
Peer review
Peer review information
Nature Communications thanks the anonymous reviewers for their contribution to the peer review of this work.
Additional information
Publisher’s note Springer Nature remains neutral with regard to jurisdictional claims in published maps and institutional affiliations.
Supplementary information
Source data
Rights and permissions
Open Access This article is licensed under a Creative Commons Attribution 4.0 International License, which permits use, sharing, adaptation, distribution and reproduction in any medium or format, as long as you give appropriate credit to the original author(s) and the source, provide a link to the Creative Commons license, and indicate if changes were made. The images or other third party material in this article are included in the article’s Creative Commons license, unless indicated otherwise in a credit line to the material. If material is not included in the article’s Creative Commons license and your intended use is not permitted by statutory regulation or exceeds the permitted use, you will need to obtain permission directly from the copyright holder. To view a copy of this license, visit http://creativecommons.org/licenses/by/4.0/.
About this article

Cite this article
Zhang, RG., Lu, C., Li, GY. et al. Subgenome-aware analyses suggest a reticulate allopolyploidization origin in three Papaver genomes. Nat Commun 14, 2204 (2023). https://doi.org/10.1038/s41467-023-37939-2
Received:
Accepted:
Published:
DOI: https://doi.org/10.1038/s41467-023-37939-2
This article is cited by
-
Functional divergence of CYP76AKs shapes the chemodiversity of abietane-type diterpenoids in genus Salvia
Nature Communications (2023)
Comments
By submitting a comment you agree to abide by our Terms and Community Guidelines. If you find something abusive or that does not comply with our terms or guidelines please flag it as inappropriate.
