
Abstract
The mesothelium lines body cavities and surrounds internal organs, widely contributing to homeostasis and regeneration. Mesothelium disruptions cause visceral anomalies and mesothelioma tumors. Nonetheless, the embryonic emergence of mesothelia remains incompletely understood. Here, we track mesothelial origins in the lateral plate mesoderm (LPM) using zebrafish. Single-cell transcriptomics uncovers a post-gastrulation gene expression signature centered on hand2 in distinct LPM progenitor cells. We map mesothelial progenitors to lateral-most, hand2-expressing LPM and confirm conservation in mouse. Time-lapse imaging of zebrafish hand2 reporter embryos captures mesothelium formation including pericardium, visceral, and parietal peritoneum. We find primordial germ cells migrate with the forming mesothelium as ventral migration boundary. Functionally, hand2 loss disrupts mesothelium formation with reduced progenitor cells and perturbed migration. In mouse and human mesothelioma, we document expression of LPM-associated transcription factors including Hand2, suggesting re-initiation of a developmental program. Our data connects mesothelium development to Hand2, expanding our understanding of mesothelial pathologies.
Introduction
As a key feature of the vertebrate body plan, the mesothelium is composed of several continuous, epithelial monolayers surrounding the internal organs (visceral mesothelium) and lining the body cavities (parietal mesothelium). The mesothelium provides a protective layer against invasive microorganisms, produces serous fluid that decreases friction of moving organs, and enables the transport of cells and nutrients across serosal cavities1,2. Moreover, cell tracking studies have established that the mesothelium contributes to a multitude of downstream cell fates including smooth muscles and fibroblasts during organogenesis, tissue homeostasis, and regeneration3,4,5. While mesothelium-lined body cavities are a fundamental trait across bilaterian animals6,7,8, open questions remain about the lineage origins of vertebrate mesothelium.
The embryonic mesothelium, also called coelomic epithelium after establishing its baso-apical polarization, is a highly dynamic cell layer that undergoes epithelial-to-mesenchymal transition (EMT) during development and seeds mesenchymal cells to underlying tissues4,5. Several prior observations tie mesothelial lineage origins to the lateral plate mesoderm (LPM)9,10,11, a mesodermal progenitor territory that forms at the periphery of the early vertebrate embryo12. In vertebrates, the coelomic cavity forms stereotypically by splitting the LPM into dorsal and ventral layers13. A subset of cells within both layers differentiates into polarized epithelial cells that form visceral (splanchnic) mesothelial layers and parietal (somatic) mesothelial layers14,15,16. Ultimately, the coelom in amniotes spans from the neck to the abdomen and outlines four main body compartments: two pleural cavities (around the lungs), a pericardiac cavity (around the heart), and a peritoneal (abdominal) cavity, each with their associated mesothelial layers (Fig. 1A). While teleosts such as zebrafish lack an equivalent pleural cavity due to absence of lungs, they feature mesothelium-lined cardiac and abdominal cavities. Which territories within the emerging LPM initially harbor the mesothelial progenitors, and when the mesothelium diverges from other LPM lineages, remain uncharted.
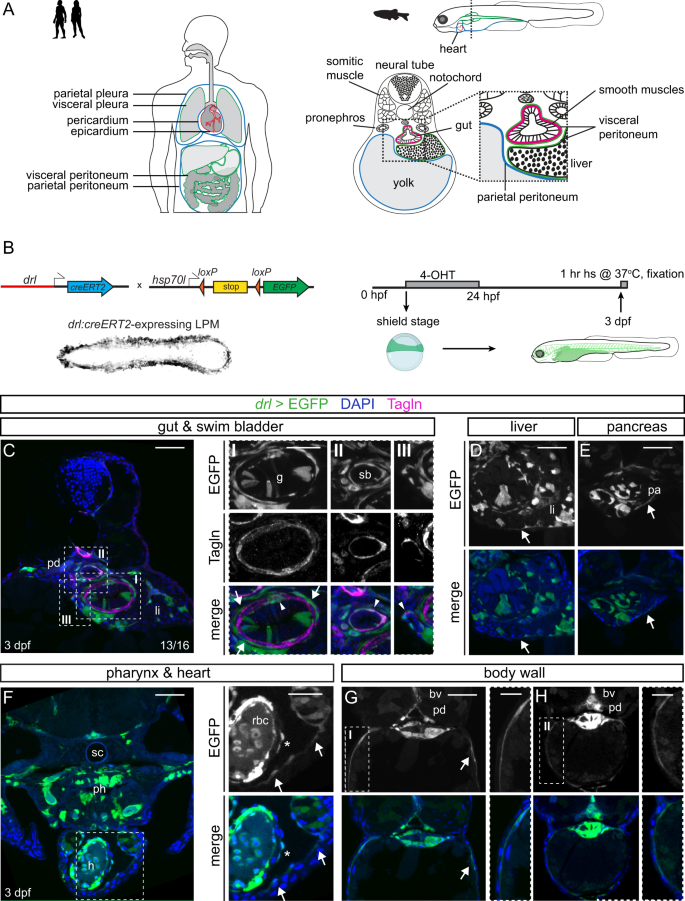
A Mesothelium in human versus zebrafish embryo. Transverse schematic of zebrafish embryo showing liver, gut, and budding swim bladder with associated mesothelium and smooth muscle at 3 dpf. B Tracing LPM using drl:creERT2 × hsp70l:Switch, 4-OHT administered at shield stage and washed off before 24 hpf. drl>EGFP indicates LPM lineage labeling. C Trunk section of drl lineage-traced 3 dpf embryo co-stained for smooth muscle (Tagln). Boxed regions show details of EGFP lineage-labeling and smooth muscle-labeling around gut (box I), swim bladder (box II), and liver ducts (box III). Arrows depict Tagln-negative;EGFP-positive cells, arrowheads depict Tagln;EGFP double-positive cells. D, E EGFP-based LPM labeling in the peritoneum around liver (D) and pancreas (E). F Rostral transverse section, lineage labeling of pericardium, ventricle (endocardium, myocardium, potentially epicardium (asterisk), blood), and LPM-derived and endoderm-derived organs in the head (head cartilage, vasculature, pharynx). G, H Sections of two regions along the anterior-posterior axis, G at yolk, H at yolk extension, showing drl-based LPM lineage labeling of parietal peritoneum forming body wall together with skin layer (boxed region). Pronephric duct (pd), liver (li), gut (g), swim bladder (sb), pancreas (pa), heart (h), blood vessel (bv), spinal cord (sc), pharynx (ph), and red blood cells (rbc). Nuclei in blue (DAPI). Scale bars C–H 50 μm and 25 μm (boxed regions).
Embryonic studies of the mesothelium have predominantly focused on developmental stages after the coelomic epithelium has formed. Several genes, including Mesothelin (Msln), Gata4, Tbx18, Tcf21, and Wilms Tumor 1 (Wt1), have enabled labeling and genetic lineage tracing of mesothelial lineages in mouse and chick5,17,18,19,20. The Wt1-expressing coelomic epithelium can contribute to the mature mesothelium, fibroblasts, stellate cells, smooth muscles, and white adipose tissue associated with the gastrointestinal tract, liver, lungs, urogenital system, and heart5,10,19,21,22,23,24,25,26,27. Further, regional specification within the mesothelial components along the developing gut is recognizable early in mouse development28,29. Studies using zebrafish have documented expression of wt1a/b, tcf21, and tbx18 in the epicardium, the visceral mesothelial layer covering the heart30,31. Despite these advances across models, expression of these conserved genes is initiated after the onset of coelomic epithelium formation, leaving the earliest differentiation steps obscure.
Compromised integrity of the adult mesothelium can result in pathologies including intra-abdominal organ adhesion32, serosal fibrosis33, pericarditis34, and mesothelioma tumors35,36. Malignant mesothelioma is a rapidly fatal solid tumor that can arise within the visceral or parietal mesothelia, predominantly as the result of environmental exposure to asbestos35,36,37,38,39. While mesothelioma cases are increasing globally despite regulatory means to curb the use of causative agents, treatment remains limited35,40. Presenting predominantly as epithelioid, sarcomatoid, and biphasic phenotypes, malignant mesothelioma frequently harbor genetic alterations affecting the tumor suppressors BAP1, NF2, CDKN2AB, and TP5341,42,43,44,45. Nonetheless, the cell of origin and the underlying aberrant molecular mechanisms leading to mesothelioma remain uncertain.
In addition to the mesothelium, the LPM gives rise to a vast array of downstream cell fates that include the cardiovascular system, blood, kidneys, and limb connective tissue12. How the LPM partitions into its diverse fates and what regulatory programs specify the individual progenitor fields remain unclear. Emerging as a dedicated mesendoderm domain, the post-gastrulation LPM segments into recognizable bilateral territories discernible by the expression of several transcription factor genes including Scl/Tal1, Lmo2, Pax2a, Nkx2.5, and Hand1/212,46,47,48. dHand/Hand2, encoding a conserved basic helix-loop-helix transcription factor, is expressed during segmentation stages in the most laterally positioned LPM progenitors in amphioxus and zebrafish13,49,50. In the developing mouse embryo, Hand2 expression has been described in the flank at comparable embryonic stages51,52,53. Studies across vertebrate models have revealed key insights into the role of Hand2 and its paralog eHand/Hand1 in anterior LPM (ALPM) progenitors that contribute to the heart, (fore)limbs, and branchial arches54,55,56. Additionally, in the posterior LPM of zebrafish and chick, Hand2 has been linked to refining the fate divergence between smooth muscle versus hemangioblast and kidney fates during somitogenesis49,57,58. The definitive fate of especially the posterior, lateral-most Hand2-expressing LPM progenitors has remained unclear.
Here, we establish several lines of evidence that hand2 in zebrafish is the earliest specific transcription factor gene demarcating the emerging mesothelial progenitors within the LPM. We provide further evidence for conservation of this property in mouse. We link the developmental function of Hand2 in mesothelium formation to a reactivation of an early coelomic epithelium-focused LPM program in mouse and human mesothelioma tumors. Our findings propose that Hand2 expression contributes to the unique properties of mesothelial progenitor cells in development and in mesothelioma.
Results
Zebrafish mesothelium is LPM-derived
To formally assess whether in zebrafish mesothelial membranes are bona fide LPM lineages, we performed genetic lineage tracing using drl:creERT2. From the onset of gastrulation until early-to-mid somitogenesis, drl:creERT2 is active in LPM-primed mesendoderm cells, resulting in lineage labeling of seemingly all LPM-assigned mesodermal lineages including cardiac, endothelial, hematopoietic, kidney, intestinal smooth muscles, and craniofacial muscles, with progressively waning labeling of the endoderm over time50,58,59,60,61,62,63,64 (Fig. 1A, B). We induced drl:creERT2;hsp70l:Switch embryos with 4-OH-Tamoxifen (4-OHT) at shield stage and analyzed the resulting EGFP-based LPM lineage labeling in transverse sections at 3 days post-fertilization (dpf) when LPM-derived organs are clearly detectable (Fig. 1A, B). EGFP expression recapitulated broad labeling of LPM-derived organs including endothelium, blood, and cardiac lineages, and sparse labeling of endoderm-derived organs, in line with previous observations using drl:creERT250,59 (Fig. 1C–G and Supplementary Fig. 1A–C). Extending the previously reported LPM lineage labeling in the Transgelin (Tagln)-positive smooth muscle layers around the zebrafish gut (Fig. 1C)58, we also observed smooth muscles around the swim bladder and ducts within the liver by double-positive staining for EGFP and Tagln (Fig. 1C). In addition, we consistently observed EGFP-positive, yet Tagln-negative cells as thin epithelial layers surrounding the gut and swim bladder (Fig. 1C), as well as around other endodermal organs including the liver and the pancreas (Fig. 1D, E). We also found EGFP-lineage labeling in the pericardial and epicardial layers surrounding the heart, confirming their LPM origin (Fig. 1F and Supplementary Fig. 1A, D–I). Of note, at this stage, the pericardium directly adheres to the body wall, forming a sac around the cardiac cavity, while in adult zebrafish the pericardium establishes a dedicated body cavity. Lastly, we observed prominent drl-based LPM lineage labeling within the body wall as an epithelial layer right underneath the skin surrounding the yolk and the yolk extension along the anterior–posterior axis (Fig. 1G, H). From these observations, we conclude that the prospective coelomic epithelium and most, if not all, developing mesothelial layers in zebrafish are LPM-derived and that drl-based reporters are suitable to label early mesothelial progenitors as part of their pan-LPM activity.
The early LPM harbors distinct hand2-expressing cells
We next sought to chart the mesothelial progenitors within the emerging LPM. To probe whether early mesothelial progenitors can be recognized within the emerging LPM, we analyzed the transcriptome of individual zebrafish LPM cells by single-cell RNA-sequencing (scRNA-seq) at tailbud stage (Fig. 2A). We dissociated a pool of drl:mCherry-expressing zebrafish embryos and sorted the mCherry-expressing cells. At this stage, the end of gastrulation, the drl:mCherry reporter-labeled LPM comprises approximately 7% of all cells in the zebrafish embryo (Fig. 2B and Supplementary Fig. 2). Upon quantifying the transcriptomes from individually sorted drl:mCherry-positive cells using CEL-Seq265, we obtained 1039 cells that passed filtering and quality control. Using graph-based clustering (Louvain algorithm66), we called 15 distinct cell populations within the drl-positive LPM at tailbud stage (Fig. 2C). We annotated these as contributing to eight major subpopulations based on canonical markers and published gene expression patterns in conjunction with marker genes identified through differential expression analysis (Fig. 2E, see “Methods” section for details). Of note, while we collected a carefully stage-matched pool of embryos, the timeframe of zebrafish matings and embryo collection might lead to slight heterogeneity among developmental stages; consequently, instead of representing bona fide distinct clusters, individual related clusters could potentially represent different developmental times of the same precursors (i.e. hemangioblasts and kidney_1 and _2).
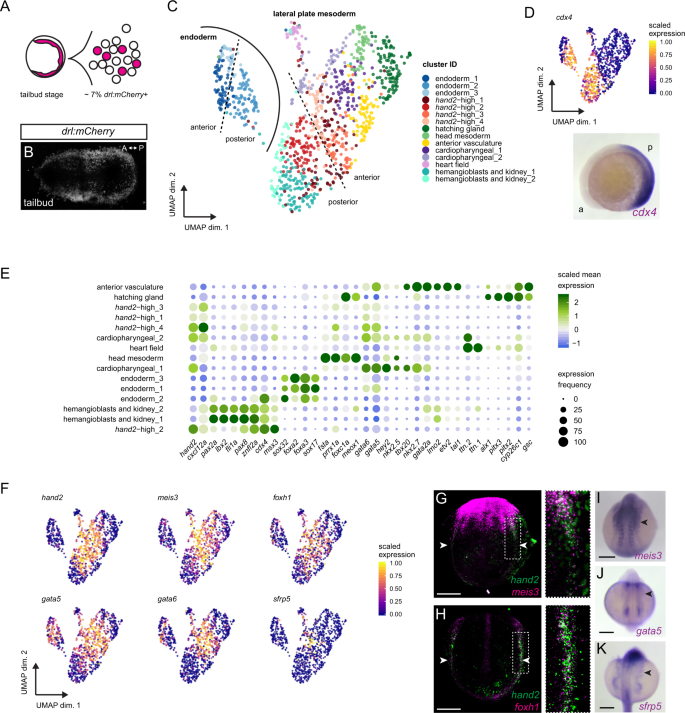
A LPM-marking drl:mCherry-positive cells of zebrafish embryos at tailbud stage, FACS-isolated, and sequenced using CEL-Seq2. B SPIM projection of drl:mCherry embryo at tailbud, labeling the LPM. C UMAP plot displaying 15 LPM cell clusters, colored by subpopulation: cardiopharyngeal (1,2), heart field, anterior vasculature, hemangioblasts/kidney (1,2), head mesoderm, hatching gland, hand2-high (1–4), and endoderm (1–3) as distinct group. D Approximate anterior-to-posterior orientation based on cdx4 (RNA ISH at 5 ss). E Dotplot including key cell fate markers to annotate clusters. Dots colored by column-scaled mean expression (log-transformed library-size-normalized counts) and sized by expression frequency (fraction of cells with non-zero counts); rows and clusters ordered by hierarchical clustering of scaled expression values. F UMAP plots of several genes co-expressed with hand2 or among cluster-determining genes in four hand2-high clusters. Cells colored by scaled expression values using lower/upper 1%-quantile boundaries. G–K Whole-mount gene expression analysis of select transcripts enriched in hand2-high cells by fluorescent in situ hybridization (ISH) (G, H) and colorimetric mRNA ISH (I–K). Fluorescent ISH of meis3 (G), foxh1 (H) with hand2 at 4 ss, revealing overlap in posterior LPM (magnified regions from dashed boxes). meis3 ISH at 10 ss (I), gata5 at 12 ss (J), and sfrp5 at 18 ss (K) showing expression in lateral-most LPM sprawling outwards (arrowheads). Scale bar G, H 100 μm, I–K 250 μm.
While mRNA in situ hybridization (ISH) and transgene expression for the earliest markers of individual LPM fate potentials renders them chiefly detectable from early somitogenesis on48, our analysis at tailbud stage resolved seemingly determined LPM progenitor fields already at the end of gastrulation, in line with and extending previous findings in zebrafish and mouse embryos59,67,68,69,70,71. Our uncovered clusters broadly represent the cardiopharyngeal, emerging head mesoderm, hatching gland progenitors, endoderm, and endothelial and hematopoietic progenitors (Fig. 2C, E). Two clusters were composed of presumptive cardiopharyngeal progenitors based on the expression of tbx20, nkx2.5, nkx2.7, hey2, gata4/5/6, ttn.1, and ttn.2 (Fig. 2C, E)72,73,74,75,76,77,78. One cluster was positive for designated markers of putative head mesoderm progenitors, including fsta, foxc1a, gsc, meox1, and prrx1a79. Based on the expression pattern of alx1, pitx2, and pitx3, we assigned a cluster to represent the hatching gland progenitors80,81, in accordance with drl reporter activity in these cells59. We additionally uncovered cells expressing the endodermal genes sox32, sox17, gata5, gata6, foxa2, and fox3a67,70,82,83 as distinct group of clusters within the analyzed cells (Fig. 2C, E). This observation is in line with previous findings that the drl reporter-positive cells at tailbud stage represent either mixed endoderm-primed and LPM-primed populations or a bi-potential LPM-fated mesendoderm population50.
Towards reconstructing rudimentary positional information back to the dissociated single cells, we mapped expression of the homeobox transcription factor gene cdx4 and several hox genes to assign whether a cluster likely represented anterior or posterior cells within the embryo (Fig. 2D and Supplementary Fig. 3). cdx4 at the five somite stage broadly demarcates in the posterior half of the developing zebrafish embryo (Fig. 2D). cdx4-positive and thus posterior clusters composed of cells expressing marker genes for endothelial and hematopoietic precursors (fli1a, lmo2, and znfl2a)84,85,86, and for the pronephros (pax2a, pax8, and lbx2)49,87,88 (Fig. 2E). The overlapping expression of hemangioblast and kidney markers possibly indicates that these two clusters represent a mixed multi-lineage progenitor pool at the end of gastrulation.
Notably, among all the prominent LPM genes we detected hand2 expression across several clusters. In addition to clusters encompassing the expected cardiac and cardiopharyngeal precursors, hand2 transcripts were abundant in four clusters we accordingly named hand2-high_1–4 (Fig. 2C, E). Further, expression of hand2 fell into both anterior and posterior expression domains, correlating with its native expression pattern in zebrafish54 (Fig. 2C, E). As anticipated, hand2 transcripts in anterior LPM cells coincided with the expression of cardiac genes in one designated cluster (Fig. 2E). However, the anterior hand2-high_3 and hand2-high_4 clusters showed no detectable expression of cardiac markers including hey2, tbx20, nkx2.5, and nkx2.7, suggesting that they encompass cells with another fate potential. We also found posterior hand2-positive cells that appeared distinct from endothelial, hematopoietic, and kidney progenitors (hand2-high_1 and hand2-high_2) (Fig. 2E). Taken together, our scRNA-seq captured hand2 expression as a central feature of several LPM progenitor clusters.
We next aimed to determine what genes are co-expressed with hand2. Our analysis revealed that several genes were enriched and individually even among the cluster-defining genes in one or more of the hand2_high clusters, including sfrp5, foxh1, gata5, gata6, and meis3 (Fig. 2F–K and Supplementary Fig. 4). In fluorescent mRNA ISH (RNAscope) and colorimetric mRNA ISH on whole-mount tailbud and early somitogenesis staged embryos, we observed that the endogenous expression pattern of meis3 expression overlaps with the hand2 domain in the anterior and posterior LPM, along with meis3 expression in other non-LPM domains (Fig. 2G, I). Moreover, foxh1 expression has previously been described in the LPM during somitogenesis stages89,90, yet the exact domain within the LPM has remained unclear. Akin to meis3, our fluorescent ISH confirmed that foxh1 is expressed in the lateral-most posterior LPM territory overlapping with hand2 expression (Fig. 2H). Notably, the in part redundant transcription factor genes gata4, gata5, and gata6 that play key roles in cardiac and endoderm development91, are also expressed in a domain lateral to the forming heart field92,93. The cells in this domain take on a spread-out, mesh-like pattern over the yolk during somitogenesis (Fig. 2J). Similarly, we found that sfrp5 demarcates lateral-most LPM cells that form a spread-out expression domain along the body axis over the yolk and yolk extension (Fig. 2K). This mesh-like pattern can also be recognized within the endogenous expression of hand2 within the ALPM54. Taken together, our data documents a collection of genes co-expressed with hand2 in the lateral-most LPM domain of as-of-yet unclear fate.
hand2 expression identifies mesothelial progenitors
Our analysis indicated that expression of hand2 and several associated genes demarcate a lateral-most LPM domain that is distinct from the cardiopharyngeal, blood, vasculature, and kidney progenitors at the end of gastrulation. Based on the previous association of Hand1/2 expression with differentiated mesenchymal structures in mouse and chick11,49,50,51,52,94, we hypothesized that the hand2-expressing LPM in zebrafish, in particular the posterior lateral-most stripe, forms the mesothelium. We turned to the transgenic line hand2:EGFP based on a BAC encompassing the zebrafish hand2 locus that faithfully recapitulates endogenous hand2 expression and that has been previously described to be expressed in mesenchymal cells55. Using time-lapse SPIM imaging and panoramic projections, we captured the dynamics of hand2:EGFP reporter activity during segmentation stages, demarcating the lateral-most drl-expressing LPM (Fig. 3A, B)49,50. Notably, and in contrast to the more medial LPM stripes that progressively migrated to the midline, a subset of the hand2:EGFP-expressing cell population sprawled out laterally over the yolk as a single-cell layer (Fig. 3C).

A, B SPIM projections of hand2:EGFP;drl:mCherry embryos at 10 ss (A) and 16 ss (B). C Confocal imaging of 16 ss hand2:EGFP;drl:mCherry embryo showing hand2:EGFP-expressing cell populations comprising lateral-most LPM. Arrowheads label single-cell layer laterally migrating over yolk. Region as annotated in B. D–F Transverse sections of 3 dpf hand2:EGFP embryos. D Boxed regions show double-positive Tagln staining (arrowheads) and Tagln-negative staining in visceral peritoneum around (I) gut, pancreatic/hepatic ducts (arrows), and (II) liver. Asterisk depicts a potential hepatic stellate cell. E hand2:EGFP expression in visceral peritoneum surrounding the pancreas. F Transverse section of hand2:EGFP labeling of parietal peritoneum. G, H Abdominal transverse sections of E14.5 Hand1EGFPCreΔNeo/+;R26R and E15.5 Hand2Cre;R26R mouse embryos, lineage-labeled cells marked by β-galactosidase staining (blue). In both groups, lineage labeling appears in the visceral peritoneum of the liver (arrowheads). I, J wt1a:EGFP (I) and wt1b:EGFP (J) expression in pronephric ducts and visceral peritoneum surrounding the gut, swim bladder, and liver. Boxed regions show double-positive Tagln staining (arrowheads) and Tagln-negative staining (arrows). Body wall (bw), diaphragm (d), gut (g), liver (li), pronephric duct (pd), swim bladder (sb). Nuclei in blue (DAPI). Scale bars D, F, I, J 50 μm, E, boxed regions D, F, I, J 25 μm, and G, H 100 μm.
In transverse sections of hand2:EGFP-transgenic embryos at 3 dpf, we observed the previously described hand2 reporter expression in Tagln-positive, LPM-derived intestinal smooth muscle cells that layer around the endodermal gut tube58 (Fig. 3D). In higher magnification analysis of transverse sections, we also observed Tagln-negative hand2:EGFP-expressing cells surrounding the gut at 3 dpf, reminiscent of coelomic epithelial cells (Fig. 3D). At 3 dpf, the hand2 reporter-expressing layers had also wrapped around other endoderm-derived organs, including the liver and the pancreas (Fig. 3D, E). In addition, in transverse sections capturing the yolk at 3 dpf, we detected hand2:EGFP expression underneath the skin in the body wall, the prospective parietal peritoneum (Fig. 3F). Extending previous observations49,55,58,95, these data suggest that hand2:EGFP reporter expression at 3 dpf in zebrafish delineates the visceral and parietal peritoneal membranes.
To extend our interpretation of zebrafish hand2 as early marker for the emerging mesothelium, we next turned to the mouse to uncover any mesothelial lineage contribution of cells expressing either of the two partially redundant murine Hand genes Hand1 and Hand2. Crossing either the Hand1EGFPCreΔNeo/+96 or Hand2Cre97 transgenic strains into the R26R loxP reporter strain98 resulted in lineage labeling along the mesothelium lining of the liver lobes at E14.5 and E15.5, respectively (Fig. 3G, H). We found lineage labeling to be more apparent and widespread using the Hand1EGFPCreΔNeo/+ strain, with strong staining in most of the mesothelium and in a subset of cells within the liver of currently unknown identity (Fig. 3G). Labeling was also present in some cells lining sinusoids, though more sporadic. Lineage analysis of Hand2Cre-descendant cells also revealed lineage labeling in the mesothelium (Fig. 3H), though staining was more restricted and less robust than that observed in Hand1 daughter cells. These differences could reflect differences between the two Cre drivers (knockin vs. transgenic) or a larger proportion of Hand1-expressing cells contributing to the liver mesothelium.
To further investigate a possible conserved link of Hand gene expression to mesothelium formation in mouse, we mined recent scRNA-seq and scATAC-seq data of early mouse embryos99 (Supplementary Fig. 5). This data harbored Hand2-expressing cell clusters that were previously assigned as “mesenchymal”, and that share co-expression of transcription factor genes we found in our zebrafish LPM dataset as associated with mesothelial progenitors, including Meis3, Gata5, and Gata6 as well as the previously LPM-associated genes Gata4, Foxf1, and Hand112 (Fig. 2 and Supplementary Fig. 5). Together, these observations indicate that also in mammals Hand gene expression is a conserved feature of the mesothelial progenitors already at early developmental stages.
To further confirm and define the hand2-expressing mesothelia, we turned to Wt1 expression that characterizes the developing visceral mesothelium in mammals100,101,102. Expression of the zebrafish Wt1 paralogs wt1a and wt1b becomes detectable at 6–8 ss as previously analysed in kidney and epicardium development30,103,104,105. During somitogenesis, we found wt1a:EGFP and wt1b:EGFP activity lateral of the differentiating kidney structures within the drl:mCherry-expressing LPM corresponding to the hand2-positive territory (Supplementary Fig. 6A, B). In transverse sections of wt1a:EGFP-expressing and wt1b:EGFP-expressing embryos, we detected EGFP signal in the coelomic epithelium surrounding the gut, liver, and pancreas in addition to the previously reported labeling of the glomerulus and pronephric tubules (Fig. 3I, J)30,103,104,105. Further, we observed wt1a/b reporter-expressing Tagln-positive smooth muscle cells around the gut and hepatic and pancreatic ducts (Fig. 3I, J). Genetic lineage tracing using wt1a- and wt1b:creERT2 from the onset of transgene expression at 6–8 ss robustly marked the visceral peritoneum around the gut, liver, and pancreas (Supplementary Fig. 6C–E). Notably, at 3 dpf, we neither detected any EGFP-labeling of the visceral peritoneum around the more posterior gut, nor did we detect any EGFP-expressing parietal peritoneum cells around the yolk, indicating these cells do not express wt1 genes in zebrafish at our analyzed time points (Supplementary Fig. 6F–G). Extending previous wt1a-based lineage tracing106. We observed that also wt1b-expressing cells contribute to the cardiac mesothelial layers in the dorsal and ventral pericardium, and in the pro-epicardial clusters (Supplementary Fig. 6H, I). These observations are consistent with LPM lineage tracing using drl:creERT2 to ventral and dorsal pericardium and to pro-epicardium (Fig. 1F and Supplementary Fig. 1D–I). We conclude that, akin to the mammalian mesothelium, expression of both Wt1 orthologs is also a feature of developing mesothelia in zebrafish. Nonetheless, in addition to the absence of wt1a/b expression in the parietal peritoneum lineage, hand2:EGFP (and hand2 gene expression itself) presents an earlier and more complete marker of all developing mesothelial membranes in zebrafish.
Primordial germ cells associate with mesothelial progenitors
We noted the chemokine-encoding gene cxcl12a as significantly co-expressed with hand2 in our scRNA-seq data set (Figs. 2E and 4A). Cxcl12a provides directional cues for the migration of several cell types107, including the guidance of primordial germ cells (PGCs)108. Through complex migration paths, the PGCs reach their final destination in the region where the gonad develops, dorsally and medially bordered by the developing pronephros, while the identity of the ventrally located tissue has not been precisely defined109,110,111. We asked whether the drl- and hand2-expressing mesothelium interacts with the migrating PGCs and if PGCs are possibly already associated with the developing LPM during gastrulation. In time-lapse imaging of transgenic zebrafish embryos expressing EGFP in the LPM (drl:EGFP transgene) and farnesylated mCherry in their PGCs (kop:mCherry-f′-nos3′UTR)112, we observed that the migrating PGCs associate with the drl reporter-expressing mesendoderm already during gastrulation (Fig. 4B, C and Supplementary Movie 1). The drl:EGFP-expressing progenitor field is gradually specifying into the LPM at the beginning of somitogenesis50 and the PGC clusters continued to associate with, and migrate within, the forming LPM (Fig. 4B, C). By 24 hpf, the PGCs reach the region where the gonads will form113 and we observed that the hand2-positive mesothelium-primed LPM is associated with the PGCs throughout these stages. Imaging mCherry-f′-nos3′UTR;hand2:EGFP embryos documented how the PGCs migrated within the hand2:EGFP-expressing LPM, and the PGCs eventually arrive at a domain within the hand2-expressing forming mesothelium (Fig. 4D). Antibody staining for the kidney transcription factor Pax2a confirmed that the PGCs end up ventral of the pronephros within the hand2-positive LPM (Fig. 4E, F), with the developing gut located medially between the PGC clusters114. These observations further support our conclusion that the PGCs migrate in close association with the forming coelomic epithelium, as marked by hand2 expression, already during early development. The functional importance of the hand2-expressing cells for the positioning of zebrafish germ cells at their target location has been previously examined115: while arriving at their targeted location, PGCs dispersed in embryos lacking Hand2 function. Together, the data suggest a model in which that following their initial arrival at their target region, the PGCs are kept in place by Cxcl12a, while in hand2 mutants the cells expressing the chemokine are affected, thereby leading to mispositioning of the germ cells.

A UMAP plots of cxcl12a, hand2, and pax2a. Cells are colored by scaled expression values using lower and upper 1%-quantiles as boundaries. B, C Snapshots of time-lapse movie (Supplementary Movie 1) showing drl:EGFP with primordial germ cell (PGC) marker mCherry-f′-nos3′UTR, with 3D renderings at 60% epiboly, 1 ss, and 10 ss (B) and maximum intensity Mercator projections for the same time points (C). The PGCs migrate from four different clusters during gastrulation into two bilateral clusters during somitogenesis (boxed regions). Note the sparse (lost) PGCs located within the endoderm (asterisks). Animal side is for 60% epiboly to the top, anterior for 1 ss and 10 ss (B) to the top and (C) to the left. D Imaging of hand2:EGFP with mCherry-f′-nos3′UTR showing a dorsal view at 24 hpf: the PGC clusters fall completely within the hand2:EGFP domain. The outlines of the yolk extension are highlighted. E Segmented 3D rendering of a hand2:EGFP; mCherry-f′-nos3′UTR double-positive embryo stained with anti-Pax2a (yellow) and DAPI (blue) at 28 hpf. F A schematic transverse section of a 24 hpf embryo showing two bilateral PGC clusters (magenta) lateral of the developing gut, ventral-lateral of the Pax2a-positive developing pronephros (yellow) within the cxcl12a-high hand2-positive LPM/coelomic epithelium (green). Scale bar D, E 250 μm.
hand2-expressing LPM forms visceral and parietal mesothelium
To clarify their mesothelial identity and to resolve the dynamics of hand2:EGFP-expressing mesothelial progenitor cells in the zebrafish embryo, we performed long-term and in toto light sheet imaging of developing hand2:EGFP;drl:mCherry double-transgenic embryos. Applying a multi-sample imaging and processing workflow116, we captured the dynamics of the hand2:EGFP expression over the course of embryonic development from 18 to 82 hpf in toto (n = 6 embryos). At imaging onset, the hand2:EGFP-expressing cells had initiated their lateral migration over the yolk, while expression of drl:mCherry refined to cardiovascular and blood lineages (Fig. 5A and Supplementary Movie 2)59.

Multiday, multi-angle SPIM of hand2:EGFP zebrafish embryos from 18 to 82 hpf (n = 6). A Maximum intensity projection (MAX) of embryo expressing the LPM-marking drl:mCherry (24 hpf onwards restricted to cardiovascular lineages) (magenta) and hand2:EGFP (greyscale) at 48 hpf. Boxes depict selected regions in C–G. B hand2:EGFP-positive populations within 48 hpf embryo, lateral view left and dorsal view right. C–E 3D-rendered hand2:EGFP embryo, focused on pericardium formation. C Rostral view, visualizing formation of pharyngeal arches (asterisks) and primary heart tube. D Ventral view, illustrating left and right flanks of the forming pericardium meeting at the midline (32 hpf, arrowheads). E Single plane, highlighting how the pericardial cavity forms within anterior LPM (arrows). hand2:EGFP labels coelomic epithelium, contributing to ventral and dorsal pericardium. F, G Single-plane cross-sections showing the migration of hand2-positive cells over yolk (G) and yolk extension (H), forming parietal peritoneum. Yellow arrows point out dorsal-ventral directed migration path. White arrows indicate inwards-migrating EGFP-expressing cells, contributing to coelomic epithelium maturing into visceral peritoneum. H Schematics of how hand2-expressing cells laterally migrate over the yolk forming parietal peritoneum, and migrating medially to wrap around endodermal-derived organs forming the visceral peritoneum. Red blood cells (rbc), heart tube (ht), pharyngeal arches (pa), and yolk (y). Scale bars A, B 500 μm and C–G 25 μm.
In the resulting time lapse imaging, we captured the hand2:EGFP-positive LPM as a dynamic cell population with distinct migration behaviors in different regions of the developing embryo. First, we observed the hand2:EGFP-expressing cells contributing to the previously described processes of pharyngeal arch formation, pectoral fin bud outgrowth, and primary heart tube extension (Fig. 5B and Supplementary Movie 2 and 3). Additionally, our light sheet imaging registered that two seemingly separated populations of hand2:EGFP-expressing cells migrate ventro-laterally, crawling over the yolk and yolk extension, and continue to form the parietal layer of the cardiac cavity (pericardium) and abdominal cavity (parietal peritoneum), respectively (Fig. 5C–G). Already at 18 hpf, we observed a dorso-ventral split in the hand2-expressing progenitor field positioned lateral of the cardiopharyngeal progenitors, forming the cardiac cavity (Fig. 5E). The pericardium surrounds the forming heart tube and maintains the pericardial fluid that supports the beating, moving heart31. The cells that will form the dorsal pericardium migrated over the yolk as a connected cell field with a clearly visible leading edge, and were already interacting with the forming primary heart tube (Figs. 3B and 5D and Supplementary Movie 2 and 3). We observed that the cells forming the more posterior-located parietal peritoneum are split from the forming pericardium by the circulation valley forming over the anterior yolk, where later the common cardinal vein (Duct of Cuvier) migrates into to ultimately enclose the circulating blood117 (as visualized by drl:mCherry, Supplementary Movie 1 and Supplementary Fig. 7). In addition, we documented how the hand2:EGFP-cells forming the presumptive parietal mesothelium reach the ventral midline earlier around the caudal yolk extension than around the main yolk, possibly due to the shorter migration distance over the yolk extension’s smaller diameter (Fig. 5F–H). Simultaneously, the more medially located hand2:EGFP-expressing cells migrated towards the midline (Fig. 5F–H), corresponding to the formation of visceral peritoneum including intestinal smooth muscles55,58. Taken together, these imaging data further support the notion that hand2:EGFP-expressing LPM progenitors emerging at the end of gastrulation in zebrafish form the visceral, parietal, and pericardial mesothelium.
hand2 mutants fail to form intact mesothelia
The prominent expression of hand2 in mesothelial progenitors of the LPM prompted us to investigate whether the loss of hand2 has an impact on the formation of the mesothelial layers. Phenotype analyses of mutant mice and zebrafish have documented that Hand2 (partially redundant with Hand1 in mice) contributes to the development of the heart, forelimbs/pectoral fins, and smooth muscle lineages54,118,119,120,121,122. Additionally, zebrafish hand2 mutants feature disorganized migration of the intestinal smooth muscle progenitors towards the gut and overall gut mislooping due to perturbed extracellular matrix remodeling55,58.
We revisited the previously established zebrafish mutant hanS6 that harbors a presumptive hand2 null allele54 as well as the established hand2 translation-blocking antisense morpholino49,123,124,125. In addition to the well-described cardiac and pectoral fin defects, we observed that hanS6-homozygous embryos displayed ventral defects of their yolk extensions and subsequent deterioration of the embryo due to yolk herniation at 3 dpf (Fig. 6A–F). Moreover, we noticed in hanS6 mutants selective blistering and shriveling of the ventral fin fold (Fig. 6B, E) and uneven distribution of mesothelial progenitors as marked by hand2:EGFP (Fig. 6C, F and Supplementary Movie 4). At the cellular level, in contrast to the connected epithelial layer forming mesothelia in wildtype embryos, we observed that LPM-derived cells (marked by genetic lineage tracing using drl:creERT2) are sparse in the abdominal cavity in hanS6-homozygous embryos (Fig. 6G). The sparse distribution of LPM-derived cells could potentially result from mosaic labeling by incomplete loxP-reporter recombination following drl-driven CreERT2 activation, as common in Cre/loxP-based experiments126. However, hanS6-homozygous embryos and hand2 morpholino-injected embryos displayed similar migration issues when we directly visualized for the mesothelial cells with the wt1a:EGFP and hand2:EGFP transgenic reporters, respectively (Fig. 6G–J and Supplementary Fig. 8). Quantification of the cells labeled by hand2:EGFP expression over the first 3 days of development based on in toto datasets of wildtype versus hand2 knockdown further indicated a reduction and stagnation of cell number over time: while wildtype embryos steadily increase the number of hand2:EGFP-expressing cells, embryos with perturbed hand2 harbor less hand2:EGFP-expressing cells and their numbers fail to increase at the same pace, most-dramatically over the trunk (Fig. 6G and Supplementary Fig. 8). Additionally, in hand2 mutant wt1a:EGFP embryos, we observed random EGFP-expressing cells in the body wall, while parietal mesothelium cannot be detected in wt1a:EGFP wildtypes (Fig. 6I and Supplementary Fig. 6), further strengthening our findings of aberrant mesothelial progenitor migration. Together, our observations indicate that loss of hand2 perturbs mesothelial progenitor migration and reduces their overall cell number. These data are in line with previous observations that documented i) coelomic epithelial progenitors migrated to the midline in hand2 mutants but failed to properly wrap around the gut55, and ii) that hand2 mutants feature perturbed heart field migration and reduced amounts of cardiac progenitor cells54,76,118,127. Of note, we only observed few LPM lineage-labeled cells and hand2:EGFP-expressing cells lining the body wall, respectively, indicating that also the ventral migration of the parietal peritoneum progenitors is perturbed in hand2 mutants (Fig. 6C, F, G–J and Supplementary Fig. 8 and Supplementary Movie 4). Consequently, hanS6-homozygous embryos also fail to form a proper body wall, likely resulting in herniation of the yolk along the anterior–posterior axis over time. These observations in zebrafish connect hand2 expression and function in dedicated LPM progenitor cells to the proper execution of mesothelial membrane formation.

A–E Lateral views of phenotypically wildtype A–C zebrafish embryos and representative hanS6 mutants (D–F) at 3 dpf. Note the abnormal phenotype of the yolk extension (representative reference wildtypes in B) in hanS6 mutant embryos (asterisks in D, E); the increasing autofluorescence of the ventral yolk is possibly caused by the progressive disorganization of the yolk tissue. SPIM-based live imaging of hand2:EGFP transgene expression that depicts mesothelial progenitors over the posterior yolk and yolk extension (wildtype reference in C) documents disorganized and only partially migrated mesothelial progenitors (arrowheads in F). G Quantification of hand2:EGFP-expressing cells in wildtype versus hand2 MO-injected embryos (morphants) over time (days post-fertilization). The left graph depicts the total amount of hand2:EGFP+ cells in an embryo (including heart and pectoral fin field), the right graph the hand2:EGFP+ in the trunk region (boxed area in schematic). See Supplementary Fig. 8 for Imaris analysis. Source data are provided as a Source Data file. H–J hanS6 in the background of drl:creERT2;hsp70l:Switch (H), wt1a:EGFP (I), and hand2:EGFP (J). Visceral peritoneum is disorganized around the internal organs (pointed out with white arrows) and the body wall and the associated parietal peritoneum are malformed (pointed out with yellow arrows) in hanS6 mutants compared to wildtype controls. Gut (g), liver (li), pancreas (pa), pronephric duct (pd), and yolk (y). Nuclei in blue (DAPI). Scale bars A, D 250 μm, B, C, E, F 125 μm, and H–J 50 μm.
Mesothelioma activates early LPM transcription factors
Upon exposure to asbestos fibers, mesothelial cells within the visceral and parietal pleura can transform into mesothelioma tumors36. As the cell(s) of origin have been hypothesized to reside within the mesothelium, we sought to determine whether mesothelioma tumors feature a transcriptional signature akin to the mesothelial progenitors we found in zebrafish (Fig. 2).
First, we revisited our transcriptomics data set obtained from mouse mesothelioma triggered by repeated exposure to crocidolite fibers (blue asbestos)128 (Fig. 7A). As previously established, genes found upregulated in human mesothelioma development (including Msln and Wt1) or downregulated (including tumor suppressors Nf2 and Bap1) behaved analogously in this mouse model, both in pre-neoplastic lesions and in fully formed tumors when compared to healthy adult mesothelium (Fig. 7B)41,42,128,129,130,131. Early LPM lineage markers, including Scl/Tal1, Etv2, and Pax2, were not detected with RNA-seq in the adult mouse mesothelium samples. Notably, the sham-treated mesothelial tissue also expressed no or low levels of transcripts for LPM-associated genes including Hand2, Gata4/5/6, Meis3, Foxf1, Mixl1, and Lmo2 (Fig. 7B). In contrast, the transition to pre-neoplastic lesions and to mesothelioma after crocidolite exposure was accompanied by the upregulation of mouse orthologs of several genes associated with mesothelium progenitors in zebrafish: expression of Hand2, Wt1, Gata4/5/6, and Meis3 increased in crocidolite-exposed mesothelium, with a particularly striking upregulation in fully formed tumors (Fig. 7B). Also Foxf1 was upregulated in crocidolite-induced tumors, a gene which has been associated with the developing splanchnic mesoderm in lamprey, chicken, and mouse, but not in zebrafish13,14,132,133 (Fig. 7B). Following immunohistochemistry for Hand2, we detected specific and prominent nuclear Hand2 immunoreactivity in crocidolite-induced mesothelioma tumor sections as well as a mosaic fraction of Hand2-expressing cells surrounded by Hand2-negative cells in crocidolite-exposed mouse mesothelium (Fig. 7C and Supplementary Fig. 9). Altogether, these observations suggest that the transformative events leading to mesothelioma in a crocidolite-based mouse model are accompanied by the upregulation (or re-initiation) of early LPM genes we found associated with mesothelial progenitors in development (Fig. 2).

A Modeling loss of mesothelial homeostasis during mesothelioma tumorigenesis: 6–8 weeks-old Nf2+/− C57Bl/6J mice exposed to crocidolite intra-peritoneally (400 µg) every 3 weeks with eight total treatments, parallel to controls. 33 weeks after initial exposure, tissue was collected. B Heatmap of LPM-associated genes, either upregulated (Msln, Wt1) or downregulated (Nf2, Bap1) mesothelioma genes, and negative control (Tubb4a). Bins colored by row-scaled log2-normalized counts; columns (samples) split by treatment group; rows and columns ordered by hierarchical clustering (scaled expression values). Right side row indicates raw count range. C Immunoreactivity of Hand2 protein in mouse mesothelioma. D Relative expression of HAND2 by qPCR in normal pleura (n = 4) and human malignant mesothelioma (n = 36); trend (p = 0.0596) towards increased HAND2 levels in tumors (Mann–Whitney two-tailed test, exact p-value). Mean ± SE. E Immunoreactivity of HAND2 protein in HAND2-high human mesothelioma. F Heatmap representing unsupervised hierarchical clustering of human mesothelioma from TCGA RNA-seq (n = 87), depicting expression of mesothelial progenitor-associated LPM genes, mesothelioma-associated genes (WT1, MSLN, BAP1, NF2, and TP53), unrelated control (YY1, OTX2, and BRCA1) and housekeeping genes (ATP5PB, GUSB, TBP, and GAPDH). Columns represent histotypes, rows represent log10-transformed, batch-normalized mRNA expression levels of mesothelioma samples. Scale bars C 50 µm, and D 100 µm.
We next sought to corroborate whether human mesothelioma also feature HAND2 expression. Analyzing expression levels of HAND2 using qPCR in human pleural mesothelioma (MPM) (n = 36) compared to healthy pleura (n = 4), we observed that individual tumors showed heterogeneous yet consistent upregulation of HAND2, with individual tumors expressing high levels of HAND2 mRNA (p = 0.0596) (Fig. 7D). We further detected nuclear HAND2 immunoreactivity in an epithelioid mesothelioma sample with high HAND2 mRNA levels (Fig. 7E). To further establish if expression of HAND2 and other mesothelial progenitor-associated LPM genes are re-activated in mesothelioma, we mined the mesothelioma-associated transcriptome data deposited in The Cancer Genome Atlas (TCGA) as generated by the TCGA Research Network ([https://www.cancer.gov/tcga]). We compared gene expression for HAND2 and other mesothelial progenitor genes with a collection of mesothelioma-associated genes, and several tissue-specific and ubiquitous house-keeping genes. We found that increased or re-activated HAND2 expression was not an obvious signature across the analyzed MPM samples, but rather a feature of a subset of tumors across the epithelioid, sarcomatoid, and biphasic classifications (Fig. 7F). HAND2 expression coincided with differential expression of the previously mesothelium- and mesothelioma-associated genes MSLN and WT1, as well as with GATA5 and MEIS2 (Fig. 7F). Notably, while we found in zebrafish mesothelial progenitors meis3 as the most-prominent MEIS family gene co-expressed with hand2 (Fig. 2), its redundant paralogs meis2a and meis2b were also enriched in hand2-expressing zebrafish progenitors (Supplementary Fig. 4)134. This HAND2-expressing group of mesothelioma tumors did not cluster notably with tumors featuring differential expression of the common mesothelioma-associated tumor suppressor genes BAP1 and CDKN2A (Fig. 7F and Supplementary Fig. 9 and Supplementary Table 1). Taken together, these observations indicate that mesothelioma tumors can upregulate or reactivate several developmental factors associated with a mesothelium progenitor state, in particular Hand2 that in zebrafish provides the earliest mesothelium progenitor marker. We postulate that, following malignant transformation, mesothelioma tumors acquire features of a developmental progenitor program deployed by the early LPM to specify mesothelium progenitors, endowing transformed cells with unique migratory and lineage properties.
Discussion
Despite their various contributions to development and homeostasis, the early embryonic origins of mesothelia and their genetic control have remained uncertain. Uniquely positioned within the developing embryo to cover inner organs and the forming body cavities, our results uncover that mesothelial progenitor cells emerge among the earliest distinguishable LPM cell fates following hand2 expression.
Our finding that expression of the transcription factor Hand2 demarcates the merging mesothelial progenitors within the post-gastrulation LPM provides means to study the mesothelium in development and disease. Hand gene function centrally contributes to cardiac, limb, and pharyngeal arch development across several models51,54,57,135,136. Our results indicate that Hand genes also act as conserved regulators of mesothelial fates. Gene expression studies have defined hand2 as a marker for the forming body wall in tilapia and medaka, and have found Hand1/2 in the flank of the developing mouse embryo53,122,137,138. Complementing studies in mice have demonstrated that Hand1-expressing progenitors contribute to cell layers of the gut including smooth muscles53,96,122. A possible ancient association of Hand genes with the LPM and thus mesothelium progenitors followed the expression of amphioxus AmpiHand and lamprey LjHandA within their presumptive LPM13. While zebrafish have seemingly lost their Hand1 ortholog139, our data suggest an early role for Hand2 and Hand factors in general in the differentiation of mesothelial progenitors from the LPM (Fig. 3).
Several fates emerging from the LPM stem from multi-lineage progenitors, such as the Scl/Tal1-positive hemangioblasts that contribute to endothelial and hematopoietic lineages140,141,142,143. Our single-cell transcriptomics analysis of the early drl reporter-expressing LPM now captured a surprising heterogeneity within the forming LPM already at the end of zebrafish gastrulation, including putative cardiopharyngeal, endothelial/hematopoietic, and here defined mesothelial progenitor clusters (Fig. 2). These data complement and expand prior scRNA-seq in mouse, zebrafish, and tunicate embryos that captured numerous mesendodermal and mesodermal cell fate territories at various developmental stages67,68,69,70,71,78. With wt1a/b expression appearing later than hand2 and seemingly restricted to the visceral mesothelial layers (Fig. 3), hand2 provides the earliest and most complete marker for mesothelial progenitors in zebrafish and possibly beyond. Our findings are applicable to in vitro differentiation protocols for multi-lineage organoids with desirable stromal components, such as to guide pluripotent stem cell differentiation into representative cell types of the gastro-intestinal tract. Further, our work provides a framework to interpret cell types deemed mesenchymal in numerous systems.
Our results provide several insights into mesothelial progenitor biology. Combined expression of hand2 with sfrp5, meis3, and foxh1 potentially defines a rudimentary mesothelial progenitor signature in the early LPM (Fig. 2E–K and Supplementary Fig. 4); nonetheless, our data could also possibly indicate progressively more differentiated mesothelial progenitors within our scRNA-seq-captured populations (within the timeframe staged of embryo collection). Individually, however, these genes have all previously been linked to mesothelial biology. sfrp5 expression has been reported in mesenchymal cells around internal organs in zebrafish and in the foregut-surrounding epithelium in Xenopus144,145. meis3 expression has been linked to mesenchymal cells lining the developing intestine and to enteric neuron migration in zebrafish123,146; we note that the potentially redundant meis2a/b are also expressed in the early LPM and mesothelial progenitors (Supplementary Fig. 4). During segmentation stages, foxh1 is involved in controlling left-right asymmetry in response to Nodal signaling in a lateral LPM domain of so-far unassigned fate89,147; our data now proposes that this activity of foxh1, and possibly the response to left-right cues, is confined to the hand2-positive mesothelial progenitors (Fig. 2H).
In addition, we observed that the PGCs migrate already from gastrulation stages associated with the mesothelium-primed LPM that establishes their ventral migration border (Fig. 4). Together with the kidney that borders their migration dorsally, our documentation of hand2-expressing mesothelium as ventral migration boundary provides additional context to the migration of PGCs to their final destination where the future gonads will form. Recent scRNA-seq studies of early mouse embryos have uncovered Hand2-expressing cell clusters that were deemed mesenchymal, and that we now likely recognize as mesothelial progenitors by their complement of LPM-associated transcripts (Supplementary Fig. 5)28,99. Altogether, these observations connect the coelomic epithelium progenitors to key aspects of body plan organization already in early development. The exact composition of a mesothelial progenitor-controlling program and its evolutionary conservation beyond the genes uncovered here warrants further attention.
Expanding previous loss-of-function analyses that documented Hand gene contribution to heart and forelimb development51,54,148,149, we here add that mesothelial progenitors fail to properly migrate and to establish normal cell number in hand2-mutant zebrafish, resulting in ventral herniation of the yolk at 3 dpf due to incomplete closure of the ventral body wall (Fig. 6 and Supplementary Fig. 8 and Supplementary Movie 4). How loss of hand2 leads to dysregulated migration and reduced cell number of the mesothelial progenitors warrants future efforts. In congenital malformations affecting the body wall including omphalocele and gastroschisis, the future ventral abdominal body wall fails to form properly, resulting in internal organ protrusion and herniation of abdominal muscles, among other phenotypes15,150,151. Among the candidate factors involved in this process is TGF-β signaling that has been repeatedly associated with Hand2 function and midline migration55,58,121, as well as Six4 and Six5152. Further, Hand2 regulates extracellular matrix components including repression of Fibronectin production, disruption of which lead to migration defects in the heart and prospective visceral mesothelium55,153. Hand2 loss however also clearly impacts the number of cardiac progenitor cells54,118, yet the underlying mechanism remains uncertain. While not exhaustive, our characterization of mesothelial phenotypes in hand2 indicates that migration and possible proliferation and cell survival defects upon hand2 loss also occur in the developing mesothelium. Altogether, our data indicate that hand2 is not only active early on during mesothelium emergence but also functionally contributes to correct mesothelium formation in zebrafish.
Asbestos-induced mesothelioma remains a global health challenge36,39. While asbestos fibers have been causally linked to pleural mesothelioma37, the transformative mechanism and the exact cell of origin await clarification. Different patient stratifications have been assigned to mesothelioma with biphasic, epithelioid, or sarcomatoid tumors based on histopathology36. Nonetheless, only a few genetic markers are known, including YAP activity and altered BAP1 expression, and their role in mesothelioma formation and maintenance remains unclear36,42. Work in mouse models has uncovered activation of stemness-related signaling pathways and an increase in Msln-expressing cells upon asbestos exposure128. Human epithelioid mesothelioma show upregulated expression of coelomic epithelium-associated genes, including WT1154,155. Notably, the non-coding RNA Fendrr (Fetal-lethal noncoding) is strongly upregulated in mouse and human epithelioid mesothelioma and shares a bidirectional promoter with the LPM transcription factor gene Foxf141,156,157. These observations indicate that at least some populations of mesothelioma cells feature a gene expression profile reminiscent of late developmental markers for the coelomic epithelium.
Aberrant reactivation of early developmental programs is increasingly recognized as contributor to tumorigenesis158,159,160. Extrapolating from our developmental findings in zebrafish, our data propose that mesothelioma might reactivate LPM-specific factors involved in initial mesothelial progenitor formation: in both mouse and human mesothelioma, we found the expression of Hand2 and additional transcription factor genes associated with early mesothelium-primed LPM (Figs. 2 and 7). Notably, crocidolite-exposed tissue showed intermediate expression levels for mesothelial progenitor genes, further supporting a model wherein mesothelioma formation involves a temporal re-activation of LPM-expressed genes as deployed in initial mesothelium development (Fig. 7). While more work is needed to establish whether and which LPM transcription factors contribute to mesothelioma formation and maintenance, our findings provide several mRNA transcript and protein expression assays to potentially further stratify mesothelioma in the clinic. We speculate that the malignant transformation of adult mesothelium, and in particular Hand2, endows altered cells with features that recapitulate the migration, proliferation, and stemness that distinguished mesothelial progenitor cells already during their initial development in the LPM.
Methods
All research described herein complies with all relevant ethical regulations as reviewed and approved by the University of Colorado School of Medicine and the University of Zurich.
Zebrafish husbandry
Zebrafish (Danio rerio) husbandry and experiments were performed according to the European Communities Council Directive (86/609/EEC), the recommendations of the Swiss authorities (Animal Protection Ordinance), and according to IACUC regulations at the University of Colorado School of Medicine, Anschutz Medical Campus. Protocols and experiments were performed as approved by the cantonal veterinary office of the Canton Zurich (Kantonales Veterinäramt, permit no. 150, TV4209), in accordance with the European Union (EU) directive 2011/63/EU as well as the German Animal Welfare Act, and as by the IACUC at the University of Colorado School of Medicine, Anschutz Medical Campus (protocol no. 00370 and no. 00979). All zebrafish were raised, kept, and handled according to established protocols161 if not noted otherwise.
Transgenic zebrafish lines and transgene activity
Established transgenic and mutant lines used in this study includes Tg(drl:EGFP)cz333159, Tg(drl:mCherry)zh705162, TgBAC(hand2:EGFP)pd24163, Tg(pax2.1:EGFP)e1164, Tg(lmo2:loxp-DsRed-loxp-EGFP)rj285, Tg(-6.8wt1a:EGFP)105, Tg(wt1b:EGFP)li1105, Tg(kop:mCherry-f’-nos3’UTR)er1112, Tg(drl:creERT2;alpha-crystallin:YFP)cz333359, Tg(-6.8wt1a:creERT2)cn10106, Tg(–3.5ubb:loxP-EGFP-loxP-mCherry)cz1701165, Tg(-1.5hsp70:loxP-STOP-loxP-EGFP;alpha-crystallin:Venus)zh70161, and hand2 mutants (hanS6)54.
The construct to generate the transgenic line TgBAC(wt1b:rtTA-p2A-creERT2)cn19 (referred to in the text as wt1b:creERT) was generated by BAC recombineering using EL250 bacteria166. Fragments were amplified by PCR, adding 50 nucleotide homology arms. First, the iTol2Amp-γ-crystallin:RFP cassette162 was amplified using primers 1. pTarBAC_HA1_iTol2_F 5′-gcgtaagcggggcacatttcattacctctttctccgcacccgacatagatCCCTGCTCGAGCCGGGCCCAAGTG-3′ and pTarBAC_HA2_iTol2CrystRFP_R 5′-gcggggcatgactattggcgcgccggatcgatccttaattaagtctactaTCGAGGTCGACGGTATCGATTAAA-3′ and recombined into the backbone of the BAC clone CH73-186G17 to replace the BAC-derived loxP site. Then, the rtTA-p2A-iCreERT2 cassette was amplified and recombined replacing the ATG of the wt1b coding sequence, with primers wt1b_HA1_rtTA_F 5′-gacattttgaactcagatattctagtgttttgcaacccagaaaatccgtcACCATGGTCGACGCCACAACCAT-3′ and wt1b_HA2_FRT_R 5′-gcgctcaggtctctgacatccgatcccatcgggccgcacggctctgtcagGGAGGCTACCATGGAGAAG-3′. Finally, the Kanamycin resistance cassette was removed by inducing expression of Flipase recombinase in the EL250 bacteria. The final BAC was purified with the HiPure Midiprep kit (Invitrogen) and injected along with synthetic Tol2 mRNA into wildtype strain zebrafish embryos. Sequence information and primer details are freely available upon request.
Six to eighteen somite staged (ss) dual-fluorescent embryos were imaged using a Leica SP8 upright confocal microscope with HCX-Apochromat W U-V-I 20×/0.5 water correction objective.
Mouse transgenic strains
The mouse strains used in this study are Hand1EGFPCreΔNeo/+96, Hand2Cre (dHand-Cre)97, and the ROSA26 Reporter (R26R)98. The Hand2Cre transgenic strain was produced using a 7.4 kb genomic fragment from the mouse Hand2 locus immediately upstream of the transcriptional start site. The Hand1EGFPCreΔNeo/+ strain was produced by knocking a Cre cassette into the mouse Hand1 locus. Abdominal transverse sections of E14.5 and E15.5 mouse embryos lineage-labeled by β-galactosidase (LacZ) expression off R26R was performed essentially as per previous analyses of Hand1/2-based lineage tracing51: briefly, embryos were dissected from the uterus and fixed in 2% paraformaldehyde (PFA) with 0.2% glutaraldehyde for up to 1 h, followed by rinsing in PBS and incubation PBS with 5 mM K3Fe(CN)6, 5 mM K4Fe(CN)6:3H20, 2 mM MgCl2, and 1 mg/ml X-gal overnight. Rinsing embryos with PBS stopped the staining reaction, followed by post-fixation in 4% PFA. Labeled embryos were dehydrated in ethanol and embedded in paraffin for sectioning. Abdominal transverse sections were cut at 10 μm intervals and dried on microscope slides. Paraffin was removed with xylene before sections sections were stained with H&E (or simply treated with cytoseal) before application of the cover slip.
Human tumor specimens
Mesothelioma tumor specimens were collected from MPM patients treated at the Department of Medical Oncology and Department of Thoracic Surgery between January 2007 and December 2014. Non-tumor pleural tissue was received from four patients undergoing mesothelioma-unrelated thoracic surgery. The Zurich Cantonal Ethics Committee approved the study under the reference number StV 24-2005 and 29-2009, and informed consent was collected from all patients. Immediately upon receiving the corresponding non-tumoral resections and tumor specimens collected from diagnostic biopsies prior to neoadjuvant chemotherapy, one part of the samples was processed for total RNA extraction and another part was fixed in 1× PBS 4% PFA for paraffin embedding.
Zebrafish CreERT2-based lineage tracing
Genetic lineage tracing experiments were performed using the Cre/loxP recombination system with 4-OHT-inducible creERT2 transgenic lines. hsp70l:Switchzh701 reporter zebrafish61 were crossed with creERT2 drivers drl:creERT259, wt1a:creERT2, and wt1b:creERT2. Lineage-labeling was induced at indicated time points using fresh or pre-heated (65 °C for 10 min) 4-Hydroxytamoxifen (4-OHT) (Sigma H7904) stock solutions in DMSO at a final concentration of 10 μM in E3 embryo medium167. To activate the EGFP transcription in hsp70l:Switch, embryos were incubated at 37 °C for 1 h and 2–3 h before fixation. Subsequently, the embryos were fixed in 4% PFA at 4 °C overnight, washed and stored in PBS, and processed for imaging.
Zebrafish histology and sectioning
Transverse sections were performed according to previous work58, in detail: 4% PFA-fixed zebrafish embryos were embedded in 6% low-melting agarose (LMA, Sigma-Aldrich) dissolved in 0.1% Tween-20 (Sigma-Aldrich) in PBS (PBS-T) and dissected into 130 μm slices with a vibratome (Leica VT 1000S). For immunostaining, the sections were incubated for 30 min in permeabilization buffer (1% BSA (AMRESCO), 1% DMSO (Sigma-Aldrich), and 0.3% Triton X-100 (Sigma-Aldrich) in PBS) and washed with PBT (0.1% Triton X-100 and 1% BSA in PBS). Antibodies were dissolved in PBT and incubated overnight at 4 °C (primary antibody) or for 4 h at room temperature (secondary antibody). Primary antibody used was α-SM22 alpha (TAGLN) antibody (AbCam, ab14106, 1:250). Secondary antibody used was goat-anti-rabbit Alexa594 (Alexa Fluor, Life Technologies, A-11012, 1:300). Sections were mounted with DAPI-containing Vectashield (Cat#H-1200, Vector Laboratories). Images were obtained with the Zeiss LSM710 confocal microscope equipped with Plan-Apochromat 40×/1.3 oil DIC M27 or 40×/1.2 immersion correction DIC M27 objectives. Images were adjusted for brightness and cropped using ImageJ/Fiji(1.52q 13, Java 8)168.
Embryos for whole-mount immunostainings were processed as described above for the sections. Primary antibodies used were anti-Pax2 (rabbit, GeneTex, GTX128127, 1:250) and anti-Myosin heavy chain (mouse, DSHB, MF20, 1:20). Secondary antibodies (1:300-1:400) used were goat-anti-rabbit Alexa633 (Alexa Fluor, Life Technologies, A-21070) and goat-anti-mouse Alexa594 (Alexa Fluor, Life Technologies, A-11032). Embryos were either imaged on a Leica SP8 upright confocal microscope or Zeiss Z.1 light sheet microscope (see details below).
Gene expression analysis and in situ hybridization (ISH)
First-strand complementary DNA (cDNA) was generated from pooled zebrafish RNA isolated from different developmental stages using SuperScript III first-strand synthesis kit (Invitrogen). DNA templates were generated using first-strand cDNA as a PCR template and the primers as specified for each gene of interest; for in vitro transcription initiation, the T7 promoter 5′-TAATACGACTCACTATAGGG-3′ was added to the 5′ ends of reverse primers. Specific primers per gene were meis3: forward 5′-TACCACAGCCCACTACCCTCAGC-3′, reverse 5′-TAATACGACTCACTATAGGGTCAGCAGGATTTGGTGCAGTTG-3′; gata5: forward 5′-CACCATGTATTCGAGCCTGGCTTTATCTTCC-3′, reverse 5′-TAATACGACTCACTATAGGGTCACGCTTGAGACAGAGCACACC-3′; sfrp5: forward 5′-GAATCACAGCAGAGGATG-3′, reverse 5′-TAATACGACTCACTATAGGGCATCTGTACTAATGGTCG-3′; cdx4: 5′-CACCATGTATCACCAAGGAGCG-3′, reverse 5′-TAATACGACTCACTATAGGGTAATCCACAACCCACGCC-3′. PCR reactions were performed under standard conditions as per manufacturer’s protocol using Phusion high-fidelity DNA polymerase (Thermo Fisher Scientific). RNA probes were generated via overnight incubation at 37 °C using 20 U/µL T7 RNA polymerase (Roche) and digoxigenin (DIG)-labeled dNTPs (Roche) as per manufacturer’s protocol. The resulting RNA was precipitated in lithium chloride and EtOH. Wildtype strain zebrafish embryos were fixed in 4% PFA in PBS overnight at 4 °C, dechorionated, transferred into 100% MeOH, and stored at −20 °C. ISH of whole-mount zebrafish embryos was performed essentially as per standard protocols169.
RNAscope assay
The RNAscope assays were carried out based on a previously published protocol170 and the manufacturer’s instruction (Advanced Cell Diagnostics). Wildtype strain or transgenic zebrafish embryos of tailbud stage until early somitogenesis were fixed in 4% PFA in PBS for 1 h at RT or overnight at 4 °C, hand dechorionation, and transferred into 100% MeOH and stored at −20 °C. Protease digestion of embryos using Protease III was performed for 20 min at RT followed by rinsing the embryos three times in 0.01% PBS-T (0.01% Tween-20). Target probe hybridization was performed overnight at 40 °C. Target probes were designed by Advanced Cell Diagnostics for hand2, foxh1, and meis3. For RNA detection, incubation with the different amplifier solutions was performed in an incubator at 40 °C. After each hybridization step, the embryos were washed three times with 0.2× SSCT for 15 min. The embryos were then incubated with ACD’s DAPI solution overnight at 4 °C. Prior to imaging, embryos were rinsed in 0.01% PBT.
Tumor RNA extraction, cDNA synthesis, and qPCR
RNA extraction, cDNA synthesis, and qPCR were performed as previously described171: in detail, upon RNA extraction using Qiagen RNAeasy Minikit (Qiagen, ID: 74106), 400–500 ng of RNA was used to perform reverse transcription using QuantiTect Reverse Transcription Kit according to manufacturer’s protocol. To determine the quantitative expression of HAND2 in MPM and non-tumoral specimens, obtained cDNA was used in SYBR-Green PCR assay and reactions were run on 7500 Fast Real-time PCR system thermal cyclers (Applied Biosystems). The following primers were used: HAND2 forward 5′-CAGGACTCAGAGCATCAACAG-3′ and reverse 5′-TCCATGAGGTAGGCGATGTA-3′. Normalization was performed based on the expression of Histone H3 detected with primers 5′-GGTAAAGCACCCAGGAAGCA-3′ and 5′-CCTCCAGTAGAGGGCGCAC-3′172. Specificity of the yielded PCR product was verified by running on a 4% agarose gel and by analyzing corresponding melting curve. The relative gene expression was determined by comparing the PCR threshold between HAND2 and histones (CtHAND2 - CtH3 = ΔCt) followed by comparing the ΔCt between tumors and non-tumor samples (ΔΔCt)172. Data were analyzed using Mann–Whitney test (two-tailed test).
Tumor immunohistochemistry
Tumor tissue sections were de-paraffinized and antigen retrieval was achieved with sodium citrate (0.01 M, pH 6.0) for antigen retrieval, followed by quenching in 0.3% H2O2 for 20 min and permeabilization in 0.05% Saponin (Fluka) for 5 min. The sections were blocked with 2% BSA/1% horse serum in 1× PBS at RT and incubated with HAND2 antibody (A-12, Sc-398167, dilution 1:100) overnight at 4 °C. Samples were washed with 1× PBS and incubated with the secondary universal antibody (Vectastain, Vector laboratories Inc., Burlingame, CA, USA, PK-6200; prepared as per manufacturer’s manual and kit reagents using 100 μL blocking serum stock in 5 mL buffer with additional 100 μL of secondary antibody stock as working solution), for 45 min at RT. To visualize the binding of the HAND2-antibody, 3,3′-diaminobenzidine tetrahydrochloride (DAB, Sigma-Aldrich) was used followed by counterstained with Vector ® Hematoxilyn QS (Vector Laboratories). Images were captured using a Leica DM6000B light microscope. Control staining was performed by omission of the primary antibody. Tumor tissue sections were de-paraffinized and antigen retrieval was achieved with sodium citrate (0.01 M, pH6) for antigen retrieval, followed by quenching in 0.3% H2O2 for 20 min and permeabilization in 0.05% Saponin (Fluka) for 5 min. The sections were blocked by incubating with 2% BSA 1× PBS supplemented with 1% horse serum at room temperature and incubated with HAND2 antibody (Santa Cruz Biotechnology A-12, Sc-398167, at dilution 1:100) overnight at 4 °C. Samples were than washed with 1× PBS and incubated with the secondary universal antibody (Vectastain, Vector laboratories Inc., Burlingame, CA, USA, PK-6200), for 45 min at room temperature, according to manufacturer instructions. To visualize the binding of the anti-HAND2 antibody, 3,3′-diaminobenzidine tetrahydrochloride (DAB, Sigma-Aldrich) was used followed by counterstained with Vector Hematoxilyn QS (Vector Laboratories)173. Images were captured with a light microscope (Leica DM6000B). Control staining was performed by omission of the primary antibody173.
Light sheet sample preparation, microscopy, and image analysis
Embryos used for long-term imaging or imaging after 1 dpf were treated with 0.003% 1-phenyl-2-thiourea (PTU, Sigma-Aldrich) to prevent melanin pigment formation.
Panoramic SPIM for hand2:EGFP;drl:mCherry imaging during somitogenesis
At 50% epiboly, embryos in the chorion were mounted in an FEP tube into 1% LMA. Up to six embryos were positioned on top of each other with a minimum gap between them. The FEP tube was mounted in the microscope imaging chamber filled with E3 medium. Time-lapse acquisition was performed with a 4-lens SPIM set up by a standardized image acquisition pipeline174. The microscope was equipped with four identical Olympus UMPlanFLN 10×/0.3 NA detection objectives. The subsequent real-time image processing, registration of time points, and 2D map (Mercator) projections were performed with previously described and publicly available Fiji scripts174. Briefly, a Z-stack was obtained from every embryo with an interval of 2 min for a period of 14–17 h. Real-time processing of the raw image date was performed during the time-lapse experiment creating radial projections of the Z-stacks, which significantly reduced the amount of raw data amount and also allowed fast image acquisition. The radial projections were post-imaging used for fusion, registration, and map projections. Map projections serve the purpose to visualize the entire surface of a spherical object and to preserve information about angles, distances, areas, and shapes. We chose for the Mercator projection, allowing cell migration analysis due to its angle-preserving properties. Due to the projections, the scale bars are not applicable anymore. Images were processed using ImageJ/Fiji (1.52q 13, Java 8).
Multidirectional SPIM (mSPIM) for long-term hand2:EGFP;drl:mCherry imaging
To prevent movement of zebrafish embryos during imaging, we injected 30 pg of α-bungarotoxin mRNA175 at the 1-cell stage. At the 20 ss, embryos that showed no sign of muscular contractions were selected and mounted in FEP tubes filled with 0.1% LMA. A detailed mounting protocol can be found in Daetwyler et al.116. Long-term time-lapse imaging was performed using a custom multidirectional SPIM (mSPIM) setup with multi-sample capacity116. The microscope was equipped with two Zeiss 10×/0.2 NA illumination objectives and an Olympus UMPlanFL N 10×/0.3 NA detection objective. Up to four embryos were imaged every 20 min for up to 4 days starting around 20 ss from four different angles. Custom-made data processing tools were used for automated data processing, including stitching and fusion of the fluorescent images116. Briefly, the acquired images were projected using maximum intensity projections and were stitched and fused with linear blending, and initialized using the translational stage positions of the mSPIM. Subsequently, the stitching parameters of the projections were applied to the 3D data to generate one 3D fused stack per timepoint, angle, channel, and fish. For successful fusion and deconvolution of the four individual angles per embryo, we manually registered them, and then applied the Fiji Multiview Reconstruction and BigStitcher plugins176,177,178 for precise registration and deconvolution. ImageJ/Fiji (1.52q 13, Java 8) and Imaris (9.5, 9.6, and 9.7, Bitplane AG, Zurich, Switzerland) were used for visualization.
Zeiss Z.1 for all other light sheet imaging
The Zeiss Z.1 microscope equipped with a Zeiss W Plan-Apochromat 20×/0.5 NA objective was used for all other light sheet microscopy and accordingly mentioned in the figure legends. Embryos were either within or out of the chorion embedded in 1% LMA in respectively a 50 or 20 µL glass capillary. Alive embryos older than 16 ss were additionally mounted with 0.016% ethyl 3-aminobenzoate methanesulfonate salt (Tricaine, Sigma) in the LMA and added to the E3 medium to prevent movement during imaging. For live imaging of the heart, the heartbeat was stopped with 30 mM 2,3-butanedione monoxime (BDM, Sigma). For the multi-angle imaging data sets: we manually registered the four individual angles per embryo and then applied the Fiji Multiview Reconstruction and BigStitcher plugins for fusion and deconvolution of the images176,177,178. Images and movies were further processed using ImageJ/Fiji168 (as described above) and Imaris (9.5, 9.6, and 9.7). The movies were annotated using standard ImageJ/Fiji tools and plugin SPIM_DrawArrowInMovie179.
Cell quantifications were performed on hand2:EGFP transgenic embryos injected with the previously validated49,123 hand2 antisense morpholino (MO2-hand2 5′-CCTCCAACTAAACTCATGGCGACAG-3′) at the 1-cell stage at 1:2 dilution (1 nL). The embryos were raised at 28 °C and imaged in the Z.1 as above at 1, 2, and 3 dpf, alongside uninjected hand2:EGFP controls. In Imaris, the baseline and background was subtracted and spots rendering was performed to automate cell picking and counting. Data was plotted using GraphPad Prism (9.3.0.).
Map projections for drl:EGFP;kop:mCherry-F-actin-nanos-3′UTR
All pre-processing steps and map projection were performed using custom-developed algorithms in MATLAB (9.7). The overall size and shape of the fused embryo were first determined in an image that was binned four times to increase the processing speed. The binned image was binarized using an adaptive threshold (imbinarize function with a sensitivity of 0.4), and the isosurface of the resulting image was determined. A sphere fit was then performed using linear least squares with the ellipsoid_fit function from Mathworks ([https://ch.mathworks.com/matlabcentral/fileexchange/24693-ellipsoid-fit]). The center and radius of the sphere were then used for performing Mercator projection of the fused images. The rational for using Mercator projections in described above under Panoramic SPIM.
For each fused image, a multi-layered projection was performed by generating concentric circles with different radii (step size: 2 µm). This allowed for unwrapping different layers of the 3D fused embryo onto 2D surfaces. For each layer of the map projection, a dummy image in polar coordinates was first generated that extended from −90° to +90° in latitude and 0° to 360° in longitude. Using Mercator projection formulas, the latitudes and longitudes that correspond to each position in the projected map were then determined. The cartesian (x,y,z) positions that correspond to each of these (latitude, longitude) points in the projected map was obtained using standard spherical to cartesian coordinate system conversion formulas. Once this was obtained, a direct mapping of the pixel values corresponding to an x,y,z position in the fused image onto the projected map was performed yielding the map-projected image.
Single-cell RNA sequencing of LPM
Sample preparation and sorting
Wildtype strain and drl:mCherry-positive zebrafish embryos were grown until tailbud stage and chorions were removed by incubating in 1 mg/mL Pronase (Roche), followed by washing in E3 medium. Around 300 embryos were used to generate the sample. The E3 medium was replaced by 1× PBS and the embryos were stored on ice until further processing. The embryos were dissociated using 2 mg/mL collagenase IV (Worthington) in DMEM (high glucose (4.5 g/L) and NaHCO3, without l-glutamine and sodium pyruvate, Sigma-Aldrich) and incubated for 5 min in a water bath at 37 °C. The embryonic tissues were triturated into a single-cell suspension by pipetting carefully up and down. When the embryos were not yet dissociated sufficiently, they were incubated for another 5 min. Cells were filtered through a 35 μm cell-strainer (Falcon, round-bottom tubes with cell-strainer cap) and briefly centrifuged at 4427 × g for 30 s. Cell pellets were resuspended in 1× HBSS (Gibco) containing 2% FBS and subjected to an additional round of centrifugation and resuspension. After washing, the cells were resuspended in 1× PBS.
drl:mCherry-positive cells were sorted using a FACS Aria III cell sorter (BD Bioscience) and data handled using FlowJo 10.2. Cells were gated based on size and forward scattering, to exclude debris and doublets. The gating for the negative population was determined based on wildtype tailbud stage embryos. See also Supplementary Fig. 2 for gate setting. The SORTseq single-cell RNA-sequencing protocol was carried out as according to published information65: live mCherry-positive single cells were sorted in four 384-well plates (BioRad) containing 5 μL of CEL-Seq2 primer solution in mineral oil (24 bp polyT stretch, a 4 bp random molecular barcode (UMI), a cell-specific barcode, the 5’Illumina TruSeq small RNA kit adapter and a T7 promoter), provided by Single Cell Discoveries (Utrecht, the Netherlands). After sorting, the plates were immediately placed on ice and stored at −80 °C.
Single Cell Discoveries further processed the four plates. In brief, ERCC Spike-in RNA (0.02 μL of 1:50,000 dilution) was added to each well before cell lysis with heat shocking. Reverse transcription and second-strand synthesis reagents were dispensed using the Nanodrop II (GC biotech). After generation of cDNA from the original mRNA, all cells from one plate were pooled and the pooled sample was amplified linearly with in vitro transcription180. To generate sequencing libraries, RPI-series index primers were used for library PCR. Libraries were sequenced on an Illumina Nextseq500 using 75 bp paired-end sequencing.
Single-cell analysis
The CEL-Seq2 barcoded sequences were obtained from Single Cell Discoveries. STAR v2.5.3a181 was used to create an index based on the Ensembl GRCz10.91 genome and annotation, after manually adding drl:mCherry. Gene abundances were estimated separately for each plate using zUMIs v0.0.4182, retaining cells with at least 100 reads and setting the Hamming distance threshold to 1 for both UMI and cell barcode identification. Finally, the exonic UMI counts for all four plates were merged into a single matrix.
Quality control and filtering were performed using the scater R package183. Upon removal of genes that were undetected across all cells, we removed cells whose percentage of mitochondrial genes fell beyond 2 Median Absolute Deviations (MADs) of the median. Secondly, features with a count greater than 1 in at least ten cells were retained for downstream analysis. Finally, we discarded cells measured on plate 4, as it was of overall low quality (low number of counts, high percentage of mitochondrial genes).
Next, we used Seurat184 for clustering and dimension reduction. Clustering was performed using the 2000 most highly variable genes (HVGs) identified via Seurat’s FindVariableFeatures function with default parameters; clustering and dimension reductions were computed using the first 20 principal components. For clustering, we considered a range of resolution parameters (0.2–2.4); downstream analyses were performed on cluster assignments obtained from resolution 1.8 (15 subpopulations).
Cluster annotations were performed manually on the basis of canonical markers in conjunction with marker genes identified programmatically with Seurat’s FindAllMarkers function, and complementary exploration with iSEE185.
For Supplementary Fig. 4, the three endoderm clusters were excluded and the remaining clusters manually merged into six major subpopulations. For each subpopulation, genes that were differentially expressed (DE) against at least three others were identified using scater’s findMarkers function with pval.type = “some”183. The top 50 DE genes (in terms of effect size) at FDR < 5% and with an average positive log-fold change (summary.logFC > 0) were selected for visualization.
Mesothelioma RNA-sequencing data
Mouse model, sample preparation, and RNA-seq analysis
Samples were derived from our previous work128, where C57Bl/6J Nf2+/− mice were repeatedly intra-peritoneally injected with either resuspended crocidolite fibers or with saline solution (sham-exposed) every 3 weeks for eight rounds and sacrificed at 33 weeks, 12 weeks after the last crocidolite exposure (see experimental outline in Fig. 7). Tumor masses and scrapped mesothelium were collected from euthanized mice and consecutively processed for histopathological diagnosis and analysis and for RNA-seq analysis. The mice sacrificed corresponded to three groups: sham, crocidolite-exposed but no tumor, and mice exposed to crocidolite with observable tumors128. RNA-seq data from this previous study was used as deposited at the European Nucleotide Archive (ENA) under project accession PRJEB15230 ([http://www.ebi.ac.uk/ena/data/view/PRJEB15230]):expression values of genes associated with early LPM and mesothelium development and diagnostic markers (Msln, Wt1, Bap1, and Nf2) were extracted; counts were normalized using size factors calculated with DESeq2’s estimateSizeFactors function186; heatmap values correspond to log10-transformed, scaled and centered (scale with default parameters) normalized counts. Right-hand side row annotations in Fig. 7 display (unscaled) log10-transformed count ranges.
Human RNA-seq analysis
Analysis of human mesothelioma was performed using TCGA data downloaded from cBioportal ([http://www.cBioportal.org])187. To perform unsupervised clustering analysis on the mRNA of TCGA mesothelioma samples, we used the complexHeatmap R package188. Heatmap values correspond to log10-transformed, batch-normalized mRNA counts.
Reproducibility and statistics
Statistical details of individual experiments are outlined directly in text and figures where these experiments are described. See “Methods” sections on scRNA-seq and its analysis for details on statistics. For imaging-based analysis, embryos were excluded that had aborted development following manipulation issues and technical reasons during image acquisition. Image analysis was performed on anonymized datasets. All imaging and expression analyses were performed at least twice, the majority at least three times. For the data presented in Supplementary Movie 2 and 4 individual embryos were imaged in toto, one dataset was fully stitched and deconvolved, and observations confirmed by the additional imaging presented in main and supplementary figures.
Reporting summary
Further information on research design is available in the Nature Research Reporting Summary linked to this article.
Data availability
All sequencing datasets generated for this study have been deposited on the ArrayExpress database under accession code E-MTAB-9727. Source data for the quantification in Fig. 6G, Supplementary Fig. 8, and the heatmaps in Fig. 7 are provided with this manuscript. All reagents used and (3D) imaging datasets are freely available upon request. Raw scRNA-seq data, intermediate, and metadata files to reproduce all analyses and figures are available at [https://doi.org/10.6084/m9.figshare.13221053.v1]. The data can be explored by downloading the RDS files and using iSEE, an interactive user interface implemented with RStudio’s Shiny185. Source data are provided with this paper.
Code availability
All scRNA-seq analyses were run in R v4.0.2, with Bioconductor v3.11. Data preprocessing and analysis code are deposited at [https://doi.org/10.5281/zenodo.5849126], and available as a browsable workflowr website189. All package versions used throughout this study are captured in the session info provided therein. The human mesothelioma RNA-seq analyses based on TCGA data (derived from [http://www.cBioportal.org]) were run in R v4.1.0. Data preprocessing and analysis code are desposited at [https://doi.org/10.5281/zenodo.5879980]. Code of the custom-made processing steps for the mSPIM are available at [https://github.com/DaetwylerStephan/multi_sample_SPIM]. MATLAB image processing codes for the map projections of drl:EGFP;kop:mCherry-F-actin-nanos-3′UTR are available at [https://github.com/sundar07/Mesothelium].
References
Mutsaers, S. E. Mesothelial cells: their structure, function and role in serosal repair. Respirology 7, 171–191 (2002).
Mutsaers, S. E. & Wilkosz, S. Structure and function of mesothelial cells. Cancer Treat. Res. 134, 1–19 (2007).
Koopmans, T. & Rinkevich, Y. Mesothelial to mesenchyme transition as a major developmental and pathological player in trunk organs and their cavities. Commun. Biol. 1, 170 (2018).
Carmona, R., Ariza, L., Cano, E., Jiménez-Navarro, M. & Muñoz-Chápuli, R. Mesothelial-mesenchymal transitions in embryogenesis. Semin. Cell Dev. Biol. https://doi.org/10.1016/j.semcdb.2018.09.006 (2018).
Rinkevich, Y. et al. Identification and prospective isolation of a mesothelial precursor lineage giving rise to smooth muscle cells and fibroblasts for mammalian internal organs and their vasculature. Nat. Cell Biol. 14, 1251–1260 (2012).
Technau, U. & Scholz, C. B. Origin and evolution of endoderm and mesoderm. J. Dev. Biol. 47, 531–539 (2003).
Monahan-Earley, R., Dvorak, A. M. & Aird, W. C. Evolutionary origins of the blood vascular system and endothelium. J. Thromb. Haemost. 11, 46–66 (2013).
Hartenstein, V. & Mandal, L. The blood/vascular system in a phylogenetic perspective. BioEssays 28, 1203–1210 (2006).
Winters, N. I., Thomason, R. T. & Bader, D. M. Identification of a novel developmental mechanism in the generation of mesothelia. Development 139, 2926–2934 (2012).
Carmona, R. et al. Conditional deletion of WT1 in the septum transversum mesenchyme causes congenital diaphragmatic hernia in mice. Elife 5, e16009 (2016).
Ahn, D. G., Kourakis, M. J., Rohde, L. A., Silver, L. M. & Ho, R. K. T-box gene tbx5 is essential for formation of the pectoral limb bud. Nature 417, 754–758 (2002).
Prummel, K. D., Nieuwenhuize, S. & Mosimann, C. The lateral plate mesoderm. Development 147, dev175059 (2020).
Onimaru, K., Shoguchi, E., Kuratani, S. & Tanaka, M. Development and evolution of the lateral plate mesoderm: comparative analysis of amphioxus and lamprey with implications for the acquisition of paired fins. Dev. Biol. 359, 124–36 (2011).
Funayama, N., Sato, Y., Matsumoto, K., Ogura, T. & Takahashi, Y. Coelom formation: binary decision of the lateral plate mesoderm is controlled by the ectoderm. Development 4138, 4129–4138 (1999).
Sadler, T. W. & Feldkamp, M. L. The embryology of body wall closure: relevance to gastroschisis and other ventral body wall defects. Am. J. Med. Genet. Part C 148C, 180–185 (2008).
Sheng, G. The developmental basis of mesenchymal stem/stromal cells (MSCs). BMC Dev. Biol. 15, 44 (2015).
Chau, Y.-Y. et al. Visceral and subcutaneous fat have different origins and evidence supports a mesothelial source. Nat. Cell Biol. 16, 367–375 (2014).
Ariza, L., Carmona, R., Cañete, A., Cano, E. & Muñoz-Chápuli, R. Coelomic epithelium-derived cells in visceral morphogenesis. Dev. Dyn. 245, 307–322 (2016).
Delgado, I. et al. GATA4 loss in the septum transversum mesenchyme promotes liver fibrosis in mice. Hepatology 59, 2358–2370 (2014).
Alghamdi, S. et al. Wt1-expressing cells contribute to mesoderm-derived tissues in intestine and mesentery in two distinct phases during murine embryonic development. bioRxiv https://doi.org/10.1101/2020.08.21.257154 (2020).
Cano, E., Carmona, R. & Muñoz-Chápuli, R. Wt1-expressing progenitors contribute to multiple tissues in the developing lung. Am. J. Physiol. Cell. Mol. Physiol. 305, L322–L332 (2013).
Asahina, K., Zhou, B., Pu, W. T. & Tsukamoto, H. Septum transversum-derived mesothelium gives rise to hepatic stellate cells and perivascular mesenchymal cells in developing mouse liver. Hepatology 53, 983–995 (2011).
Lua, I., James, D., Wang, J., Wang, K. S. & Asahina, K. Mesodermal mesenchymal cells give rise to myofibroblasts, but not epithelial cells, in mouse liver injury. Hepatology 60, 311–322 (2014).
Lee, K. Y. et al. Developmental and functional heterogeneity of white adipocytes within a single fat depot. EMBO J. 38, e99291 (2019).
Sebo, Z. L., Jeffery, E., Holtrup, B. & Rodeheffer, M. S. A mesodermal fate map for adipose tissue. Development 145, dev166801 (2018).
Martínez-Estrada, O. M. et al. Wt1 is required for cardiovascular progenitor cell formation through transcriptional control of Snail and E-cadherin. Nat. Genet. 42, 89–93 (2010).
Zhou, B. et al. Epicardial progenitors contribute to the cardiomyocyte lineage in the developing heart. Nature 454, 109–113 (2008).
Han, L. et al. Single cell transcriptomics identifies a signaling network coordinating endoderm and mesoderm diversification during foregut organogenesis. Nat. Commun. 11, 4158 (2020).
Kishimoto, K. et al. Bidirectional Wnt signaling between endoderm and mesoderm confers tracheal identity in mouse and human cells. Nat. Commun. 11, 4159 (2020).
Peralta, M., González-Rosa, J. M., Marques, I. J. & Mercader, N. The epicardium in the embryonic and adult zebrafish. J. Dev. Biol. 2, 101–116 (2014).
Peralta, M. et al. Heartbeat-driven pericardiac fluid forces contribute to epicardium morphogenesis. Curr. Biol. 23, 1726–1735 (2013).
Tsai, J. M. et al. Surgical adhesions in mice are derived from mesothelial cells and can be targeted by antibodies against mesothelial markers. Sci. Transl. Med. https://doi.org/10.1126/scitranslmed.aan6735 (2018).
Mutsaers, S. E. et al. Mesothelial cells in tissue repair and fibrosis. Front. Pharmacol. 6, 113 (2015).
Chiabrando, J. G. et al. Management of acute and recurrent pericarditis: JACC state-of-the-art review. J. Am. Coll. Cardiol. https://doi.org/10.1016/j.jacc.2019.11.021 (2020).
Yap, T. A., Aerts, J. G., Popat, S. & Fennell, D. A. Novel insights into mesothelioma biology and implications for therapy. Nat. Rev. Cancer https://doi.org/10.1038/nrc.2017.42 (2017).
Carbone, M. et al. Mesothelioma: scientific clues for prevention, diagnosis, and therapy. Cancer J. Clin. 69, 402–429 (2019).
Wagner, J. C., Munday, D. E. & Harington, J. S. Histochemical demonstration of hyaluronic acid in pleural mesotheliomas. J. Pathol. Bacteriol. 84, 73–78 (1962).
Odgerel, C. O. et al. Estimation of the global burden of mesothelioma deaths from incomplete national mortality data. Occup. Environ. Med. 74, 851–858 (2017).
Felley-Bosco, E. & Macfarlane, M. Asbestos: Modern Insights for Toxicology in the Era of Engineered Nanomaterials. Chemical Research in Toxicology vol. 31 994–1008 (American Chemical Society, 2018).
Hinz, T. K. & Heasley, L. E. Translating mesothelioma molecular genomics and dependencies into precision oncology-based therapies. Semin. Cancer Biol. https://doi.org/10.1016/j.semcancer.2019.09.014 (2019).
Bueno, R. et al. Comprehensive genomic analysis of malignant pleural mesothelioma identifies recurrent mutations, gene fusions and splicing alterations. Nat. Genet. https://doi.org/10.1038/ng.3520 (2016).
Hmeljak, J. et al. Integrative molecular characterization of malignant pleural mesothelioma. Cancer Discov. 8, 1548–1565 (2018).
Quetel, L. et al. Genetic alterations of malignant pleural mesothelioma: association with tumor heterogeneity and overall survival. Mol. Oncol. https://doi.org/10.1002/1878-0261.12651 (2020).
Tate, J. G. et al. COSMIC: the Catalogue Of Somatic Mutations In Cancer. Nucleic Acids Res. https://doi.org/10.1093/nar/gky1015 (2019).
Cheng, J. Q. et al. p16 Alterations and deletion mapping of 9p21–p22 in malignant mesothelioma. Cancer Res. 54, 5547–5551 (1994).
Takasato, M. & Little, M. H. The origin of the mammalian kidney: implications for recreating the kidney in vitro. Development 142, 1937–1947 (2015).
Chal, J. & Pourquié, O. Making muscle: skeletal myogenesis in vivo and in vitro. Development 144, 2104–2122 (2017).
Davidson, A. J. & Zon, L. I. The ‘definitive’ (and ’primitive’) guide to zebrafish hematopoiesis. Oncogene 23, 7233–7246 (2004).
Perens, E. A. et al. Hand2 inhibits kidney specification while promoting vein formation within the posterior mesoderm. Elife 5, e19941 (2016).
Prummel, K. D. et al. A conserved regulatory program initiates lateral plate mesoderm emergence across chordates. Nat. Commun. 10, 3857 (2019).
Firulli, A. B., McFadden, D. G., Lin, Q., Srivastava, D. & Olson, E. N. Heart and extra-embryonic mesodermal defects in mouse embryos lacking the bHLH transcription factor Hand1. Nat. Genet. 18, 266–270 (1998).
Charité, J., Mcfadden, D. G. & Olson, E. N. The bHLH transcription factor dHAND controls Sonic hedgehog expression and establishment of the zone of polarizing activity during limb development. Development 2470, 2461–2470 (2000).
Srivastava, D., Cserjesi, P. & Olson, E. N. A subclass of bHLH proteins required for cardiac morphogenesis. Science 270, 1995–1999 (1995).
Yelon, D. et al. The bHLH transcription factor hand2 plays parallel roles in zebrafish heart and pectoral fin development. Development 127, 2573–2582 (2000).
Yin, C., Kikuchi, K., Hochgreb, T., Poss, K. D. & Stainier, D. Y. R. Hand2 regulates extracellular matrix remodeling essential for gut-looping morphogenesis in zebrafish. Dev. Cell 18, 973–984 (2010).
Funato, N. et al. Hand2 controls osteoblast differentiation in the branchial arch by inhibiting DNA binding of Runx2. Development 136, 615–625 (2009).
Shin, M., Nagai, H. & Sheng, G. Notch mediates Wnt and BMP signals in the early separation of smooth muscle progenitors and blood/endothelial common progenitors. Development 136, 595–603 (2009).
Gays, D. et al. An exclusive cellular and molecular network governs intestinal smooth muscle cell differentiation in vertebrates. Development 144, 464–478 (2017).
Mosimann, C. et al. Chamber identity programs drive early functional partitioning of the heart. Nat. Commun. 6, 1–10 (2015).
Henninger, J. et al. Clonal fate mapping quantifies the number of haematopoietic stem cells that arise during development. Nat. Cell Biol. 19, 17–27 (2017).
Felker, A. et al. Continuous addition of progenitors forms the cardiac ventricle in zebrafish. Nat. Commun. 9, 1–14 (2018).
Herbomel, P., Thisse, B. & Thisse, C. Ontogeny and behaviour of early macrophages in the zebrafish embryo. Development 126, 3735–3745 (1999).
Sagarin, K. A., Redgrave, A. C., Mosimann, C., Burke, A. C. & Devoto, S. H. Anterior trunk muscle shows mix of axial and appendicular developmental patterns. Dev. Dyn. 248, 961–968 (2019).
Pfefferli, C., Moran, H. R., Felker, A., Mosimann, C. & Jaźwińska, A. Persistent ventricle partitioning in the adult zebrafish heart. J. Cardiovasc. Dev. Dis. 8, 41 (2021).
Muraro, M. J. et al. A single-cell transcriptome Atlas of the human pancreas. Cell Syst. 3, 385–394 (2016).
Blondel, V. D., Guillaume, J.-L., Lambiotte, R. & Lefebvre, E. Fast unfolding of communities in large networks. https://doi.org/10.1088/1742-5468/2008/10/P10008 (2008).
Farrell, J. A. et al. Single-cell reconstruction of developmental trajectories during zebrafish embryogenesis. Science 360, eaar3131(2018).
Pijuan-Sala, B. et al. A single-cell molecular map of mouse gastrulation and early organogenesis. Nature https://doi.org/10.1038/s41586-019-0933-9 (2019).
Scialdone, A. et al. Resolving early mesoderm diversification through single-cell expression profiling. Nature 535, 289–293 (2016).
Wagner, D. E. et al. Single-cell mapping of gene expression landscapes and lineage in the zebrafish embryo. Science 360, 981–987 (2018).
Mohammed, H. et al. Single-cell landscape of transcriptional heterogeneity and cell fate decisions during mouse early gastrulation. Cell Rep. 20, 1215–1228 (2017).
Lu, F., Langenbacher, A. & Chen, J.-N. Tbx20 drives cardiac progenitor formation and cardiomyocyte proliferation in zebrafish. Dev. Biol. 421, 139–148 (2017).
Gibb, N. et al. Hey2 regulates the size of the cardiac progenitor pool during vertebrate heart development. Development https://doi.org/10.1242/dev.167510 (2018).
Lee, K.-H., Xu, Q. & Breitbart, R. E. A Newtinman-related Gene,nkx2.7, anticipates the expression ofnkx2.5andnkx2.3in zebrafish heart and pharyngeal endoderm. Dev. Biol. 180, 722–731 (1996).
Peterkin, T. & Gibson, A. & Patient, R. Dev. 101, 45–49 (2009).
Bloomekatz, J. et al. Platelet-derived growth factor (PDGF) signaling directs cardiomyocyte movement toward the midline during heart tube assembly. Elife 6, e21172 (2017).
Shih, Y.-H. et al. Cardiac transcriptome and dilated cardiomyopathy genes in zebrafish. Circ. Cardiovasc. Genet. 8, 261–269 (2015).
Wang, W. et al. A single-cell transcriptional roadmap for cardiopharyngeal fate diversification. Nat. Cell Biol. 21, 674–686 (2019).
Wang, H., Holland, P. W. H. & Takahashi, T. Gene profiling of head mesoderm in early zebrafish development: insights into the evolution of cranial mesoderm. Evodevo 10, 14 (2019).
Zilinski, C. A., Shah, R., Lane, M. E. & Jamrich, M. Modulation of zebrafish pitx3 expression in the primordia of the pituitary, lens, olfactory epithelium and cranial ganglia by Hedgehog and Nodal signaling. Genesis https://doi.org/10.1002/gene.20094 (2005).
John, L. B., Trengove, M. C., Fraser, F. W., Yoong, S. H. & Ward, A. C. Pegasus, the ‘atypical’ Ikaros family member, influences left-right asymmetry and regulates pitx2 expression. Dev. Biol. https://doi.org/10.1016/j.ydbio.2013.02.017 (2013).
Schier, A. F. & Talbot, W. S. Nodal signaling and the zebrafish organizer. Int. J. Dev. Biol. 45, 289–297 (2001).
Warga, R. M. & Nüsslein-Volhard, C. Origin and development of the zebrafish endoderm. Development 838, 827–838 (1999).
Lawson, N. D. & Weinstein, B. M. In vivo imaging of embryonic vascular development using transgenic zebrafish. Dev. Biol. 248, 307–318 (2002).
Zhu, H. et al. Regulation of the lmo2 promoter during hematopoietic and vascular development in zebrafish. Dev. Biol. 281, 256–269 (2005).
Hogan, B. M., Pase, L., Hall, N. E. & Lieschke, G. J. Characterisation of duplicate zinc finger like 2 erythroid precursor genes in zebrafish. Dev. Genes Evol. 216, 523–529 (2006).
Pfeffer, P. L., Gerster, T., Lun, K., Brand, M. & Busslinger, M. Characterization of three novel members of the zebrafish Pax2/5/8 family: dependency of Pax5 and Pax8 expression on the Pax2.1 (noi) function. Development 125, 3063–74 (1998).
Naylor, R. W. et al. BMP and retinoic acid regulate anterior-posterior patterning of the non-axial mesoderm across the dorsal-ventral axis. Nat. Commun. 7, 12197 (2016).
Slagle, C. E., Aoki, T. & Burdine, R. D. Nodal-dependent mesendoderm specification requires the combinatorial activities of FoxH1 and Eomesodermin. PLoS Genet. 7, e1002072 (2011).
Pogoda, H. M., Solnica-Krezel, L., Driever, W. & Meyer, D. The zebrafish forkhead transcription factor FoxH1/Fast1 is a modulator of nodal signaling required for organizer formation. Curr. Biol. 10, 1041–1049 (2000).
Tremblay, M., Sanchez-Ferras, O. & Bouchard, M. GATA transcription factors in development and disease. Development 145, dev164384 (2018).
Reiter, J. F. et al. Gata5 is required for the development of the heart and endoderm in zebrafish. Genes Dev. 13, 2983–2995 (1999).
Jiang, Y., Drysdale, T. A. & Evans, T. A role for GATA-4/5/6 in the regulation of Nkx2.5 expression with implications for patterning of the precardiac field. Dev. Biol. 216, 57–71 (1999).
Fernandez-Teran, M. et al. Role of dHAND in the anterior-posterior polarization of the limb bud: Implications for the Sonic hedgehog pathway. Development 127, 2133–2142 (2000).
Mao, Q., Stinnett, H. K. & Ho, R. K. Asymmetric cell convergence-driven zebrafish fin bud initiation and pre-pattern requires Tbx5a control of a mesenchymal Fgf signal. Development 142, 4329–4339 (2015).
Barnes, R. M., Firulli, B. A., Conway, S. J., Vincentz, J. W. & Firulli, A. B. Analysis of the Hand1 cell lineage reveals novel contributions to cardiovascular, neural crest, extra-embryonic, and lateral mesoderm derivatives. Dev. Dyn. 239, 3086–3097 (2010).
Ruest, L.-B. et al. dHAND-Cre transgenic mice reveal specific potential functions of dHAND during craniofacial development. Dev. Biol. 257, 263–277 (2003).
Soriano, P. Generalized lacZ expression with the ROSA26 Cre reporter strain. Nat. Genet. 21, 70–71 (1999).
Pijuan-Sala, B. et al. Single-cell chromatin accessibility maps reveal regulatory programs driving early mouse organogenesis. Nat. Cell Biol. 22, 1–11 (2020).
Parenti, R. et al. Immunohistochemical expression of Wilms’ tumor protein (WT1) in developing human epithelial and mesenchymal tissues. Acta Histochem. 115, 70–75 (2013).
Walker, C. et al. Wilms’ tumor suppressor gene expression in rat and human mesothelioma. Cancer Res. 54, 3101–3106 (1994).
Chen, Y.-T. et al. Lineage tracing reveals distinctive fates for mesothelial cells and submesothelial fibroblasts during peritoneal injury. J. Am. Soc. Nephrol. 25, 2847–2858 (2014).
Perner, B., Bates, T., Naumann, U. & Englert, C. in The Wilms’ Tumor (WT1) Gene (ed. Hastie, N.) 119–128 (Humana Press, 2016).
Endlich, N. et al. Two-photon microscopy reveals stationary podocytes in living zebra fish larvae. J. Am. Soc. Nephrol. 25, 681–686 (2014).
Bollig, F. et al. A highly conserved retinoic acid responsive element controls wt1a expression in the zebrafish pronephros. Development 136, 2883–2892 (2009).
Sánchez-Iranzo, H. et al. Transient fibrosis resolves via fibroblast inactivation in the regenerating zebrafish heart. Proc. Natl Acad. Sci. USA 115, 4188–4193 (2018).
Lewellis, S. W. & Knaut, H. Attractive guidance: how the chemokine SDF1/CXCL12 guides different cells to different locations. Semin. Cell Dev. Biol. 23, 333–340 (2012).
Grimaldi, C. & Raz, E. Germ cell migration—evolutionary issues and current understanding. Semin. Cell Dev. Biol. 100, 152–159 (2020).
Doitsidou, M. et al. Guidance of primordial germ cell migration by the chemokine SDF-1. Cell 111, 647–659 (2002).
Richardson, B. E. & Lehmann, R. Mechanisms guiding primordial germ cell migration: strategies from different organisms. Nat. Rev. Mol. Cell Biol. 11, 37–49 (2010).
Stebler, J. et al. Primordial germ cell migration in the chick and mouse embryo: the role of the chemokine SDF-1/CXCL12. Dev. Biol. 272, 351–361 (2004).
Blaser, H. et al. Transition from non-motile behaviour to directed migration during early PGC development in zebrafish. J. Cell Sci. 118, 4027–4038 (2005).
Raz, E. Primordial germ-cell development: the zebrafish perspective. Nat. Rev. Genet. 4, 690–700 (2003).
Paksa, A. et al. Repulsive cues combined with physical barriers and cell-cell adhesion determine progenitor cell positioning during organogenesis. Nat. Commun. 7, 11288 (2016).
Weidinger, G. et al. Regulation of zebrafish primordial germ cell migration by attraction towards an intermediate target. Development 129, 25–36 (2002).
Daetwyler, S., Günther, U., Modes, C. D., Harrington, K. & Huisken, J. Multi-sample SPIM image acquisition, processing and analysis of vascular growth in zebrafish. Development 146, dev173757 (2019).
Hamm, M. J., Kirchmaier, B. C. & Herzog, W. Sema3d controls collective endothelial cell migration by distinct mechanisms via nrp1 and plxnD1. J. Cell Biol. https://doi.org/10.1083/jcb.201603100 (2016)
Yelon, D. & Stainier, D. Y. R. Hand2 regulates epithelial formation during myocardial differentiation. Curr. Biol. 15, 441–446 (2005).
Santoro, M. M., Pesce, G. & Stainier, D. Y. Characterization of vascular mural cells during zebrafish development. Mech. Dev. 126, 638–649 (2009).
Galli, A. et al. Distinct roles of Hand2 in initiating polarity and posterior Shh expression during the onset of mouse limb bud development. PLoS Genet. https://doi.org/10.1371/journal.pgen.1000901 (2010).
Laurent, F. et al. HAND2 target gene regulatory networks control atrioventricular canal and cardiac valve development. Cell Rep. 19, 1602–1613 (2017).
Srivastava, D. et al. Regulation of cardiac mesodermal and neural crest development by the bHLH transcription factor, dHAND. Nat. Genet. 16, 154–60 (1997).
Reichenbach, B. et al. Endoderm-derived Sonic hedgehog and mesoderm Hand2 expression are required for enteric nervous system development in zebrafish. Dev. Biol. 318, 52–64 (2008).
Maves, L., Tyler, A., Moens, C. B. & Tapscott, S. J. Pbx acts with Hand2 in early myocardial differentiation. Dev. Biol. 333, 409–418 (2009).
Hinits, Y. et al. Zebrafish Mef2ca and Mef2cb are essential for both first and second heart field cardiomyocyte differentiation. Dev. Biol. 369, 199–210 (2012).
Carney, T. J. & Mosimann, C. Switch and trace: recombinase genetics in zebrafish. Trends Genet. 34, 362–378 (2018).
Schoenebeck, J. J., Keegan, B. R. & Yelon, D. Vessel and blood specification override cardiac potential in anterior mesoderm. Dev. Cell 13, 254–267 (2007).
Rehrauer, H. et al. How asbestos drives the tissue towards tumors: YAP activation, macrophage and mesothelial precursor recruitment, RNA editing, and somatic mutations. Oncogene https://doi.org/10.1038/s41388-018-0153-z (2018).
Sekido, Y. et al. Neurofibromatosis type 2 (NF2) gene is somatically mutated in mesothelioma but not in lung cancer. Cancer Res. https://doi.org/10.1016/0169-5002(95)90162-0 (1995).
Bianchi, A. B. et al. High frequency of inactivating mutations in the neurofibromatosis type 2 gene (NF2) in primary malignant mesotheliomas. Proc. Natl Acad. Sci. USA https://doi.org/10.1073/pnas.92.24.10854 (1995).
Bott, M. et al. The nuclear deubiquitinase BAP1 is commonly inactivated by somatic mutations and 3p21.1 losses in malignant pleural mesothelioma. Nat Genet. https://doi.org/10.1038/ng.855 (2011).
Ormestad, M., Astorga, J. & Carlsson, P. Differences in the embryonic expression patterns of mouse Foxf1 and -2 match their distinct mutant phenotypes. Dev. Dyn. 229, 328–333 (2004).
Mahlapuu, M., Ormestad, M., Enerbäck, S. & Carlsson, P. The forkhead transcription factor Foxf1 is required for differentiation of extra-embryonic and lateral plate mesoderm. Development 128, 155–166 (2001).
Schulte, D. & Geerts, D. MEIS transcription factors in development and disease. Development 146, dev174706 (2019).
Barnes, R. M. et al. Hand2 loss-of-function in Hand1-expressing cells reveals distinct roles in epicardial and coronary vessel development. Circ. Res. 108, 940–949 (2011).
Han, Z. & Olson, E. N. Hand is a direct target of Tinman and GATA factors during Drosophila cardiogenesis and hematopoiesis. Development 132, 3525–3536 (2005).
Tanaka, M., Yu, R. & Kurokawa, D. Anterior migration of lateral plate mesodermal cells during embryogenesis of the pufferfish Takifugu niphobles: insight into the rostral positioning of pelvic fins. J. Anat. https://doi.org/10.1111/joa.12324 (2015).
Tanaka, M. Revealing the mechanisms of the rostral shift of pelvic fins among teleost fishes. Evol. Dev. 13, 382–390 (2011).
Howe, K. et al. The zebrafish reference genome sequence and its relationship to the human genome. Nature 496, 498–503 (2013).
Vogeli, K. M., Jin, S. W., Martin, G. R. & Stainier, D. Y. A common progenitor for haematopoietic and endothelial lineages in the zebrafish gastrula. Nature 443, 337–339 (2006).
Sabin, F. R. Preliminary note on the differentiation of angioblasts and the method by which they produce blood-vessels, blood-plasma and red blood-cells as seen in the living chick. 1917. J. Hematother. Stem Cell Res. 11, 5–7 (1917).
Choi, K., Kennedy, M., Kazarov, A., Papadimitriou, J. C. & Keller, G. A common precursor for hematopoietic and endothelial cells. Development 125, 725–732 (1998).
Murray, P. D. F. The development in vitro of the blood of the early chick embryo. Proc. R. Soc. B Biol. Sci. 111, 497–521 (1932).
Stuckenholz, C. et al. Sfrp5 modulates both Wnt and BMP signaling and regulates gastrointestinal organogenesis [corrected] in the zebrafish, Danio rerio. PLoS ONE 8, e62470 (2013).
Li, Y. et al. Sfrp5 coordinates foregut specification and morphogenesis by antagonizing both canonical and noncanonical Wnt11 signaling. Genes Dev. https://doi.org/10.1101/gad.1687308 (2008).
Uribe, R. A. & Bronner, M. E. Meis3 is required for neural crest invasion of the gut during zebrafish enteric nervous system development. Mol. Biol. Cell 26, 3728–3740 (2015).
Tavares, A. T., Andrade, S., Silva, A. C. & Belo, J. A. Cerberus is a feedback inhibitor of Nodal asymmetric signaling in the chick embryo. Development 134, 2051–2060 (2007).
Osterwalder, M. et al. HAND2 targets define a network of transcriptional regulators that compartmentalize the early limb bud mesenchyme. Dev. Cell 31, 345–357 (2014).
Firulli, B. A. et al. Analysis of a Hand1 hypomorphic allele reveals a critical threshold for embryonic viability. Dev. Dyn. 239, 2748–2760 (2010).
Brewer, S. & Williams, T. Finally, a sense of closure? Animal models of human ventral body wall defects. BioEssays https://doi.org/10.1002/bies.20137 (2004).
Boylan, M., Anderson, M. J., Ornitz, D. M. & Lewandoski, M. The Fgf8 subfamily (Fgf8, Fgf17 and Fgf18) is required for closure of the embryonic ventral body wall. Development 147, dev189506 (2020).
Takahashi, M., Tamura, M., Sato, S. & Kawakami, K. Mice doubly deficient in Six4 and Six5 show ventral body wall defects reproducing human omphalocele. Dis. Model. Mech. 11, dmm034611 (2018).
Garavito-Aguilar, Z. V., Riley, H. E. & Yelon, D. Hand2 ensures an appropriate environment for cardiac fusion by limiting Fibronectin function. Development 137, 3215–3220 (2010).
de Reyniès, A. et al. Molecular classification of malignant pleural mesothelioma: identification of a poor prognosis subgroup linked to the epithelial-to-mesenchymal transition. Clin. Cancer Res. 20, 1323–1334 (2014).
Bozzi, F. et al. Epithelioid peritoneal mesothelioma: a hybrid phenotype within a mesenchymal-epithelial/epithelial-mesenchymal transition framework. Oncotarget 7, 75503–75517 (2016).
Felley-Bosco, E. & Rehrauer, H. Non-coding transcript heterogeneity in mesothelioma: insights from asbestos-exposed mice. Int. J. Mol. Sci. https://doi.org/10.3390/ijms19041163. (2018).
Grote, P. et al. The tissue-specific lncRNA Fendrr is an essential regulator of heart and body wall development in the mouse. Dev. Cell 24, 206–214 (2013).
Kaufman, C. K. et al. A zebrafish melanoma model reveals emergence of neural crest identity during melanoma initiation. Science 351, aad2197 (2016).
Pomerantz, M. M. et al. Prostate cancer reactivates developmental epigenomic programs during metastatic progression. Nat. Genet. 52, 790–799 (2020).
Aiello, N. M. & Stanger, B. Z. Echoes of the embryo: using the developmental biology toolkit to study cancer. Dis. Model. Mech. 9, 105–114 (2016).
Westerfield, M. The Zebrafish Book: A Guide for the Laboratory Use of Zebrafish (Danio rerio). (University of Oregon Press, 2007).
Sánchez-Iranzo, H. et al. Tbx5a lineage tracing shows cardiomyocyte plasticity during zebrafish heart regeneration. Nat. Commun. 9, 428 (2018).
Kikuchi, K. et al. Short article retinoic acid production by endocardium and epicardium is an injury response essential for zebrafish heart regeneration. Dev. Cell 20, 397–404 (2011).
Picker, A., Scholpp, S., Böhli, H., Takeda, H. & Brand, M. A novel positive transcriptional feedback loop in midbrain-hindbrain boundary development is revealed through analysis of the zebrafish pax2.1 promoter in transgenic lines. Development 129, 3227–3239 (2002).
Mosimann, C. et al. Ubiquitous transgene expression and Cre-based recombination driven by the ubiquitin promoter in zebrafish. Development 138, 169–177 (2011).
Lee, E. C. et al. A highly efficient Escherichia coli-based chromosome engineering system adapted for recombinogenic targeting and subcloning of BAC DNA. Genomics 73, 56–65 (2001).
Felker, A. et al. In vivo performance and properties of tamoxifen metabolites for CreERT2 control. PLoS ONE 11, e0152989 (2016).
Schindelin, J. et al. Fiji: an open-source platform for biological-image analysis. Nat. Methods 9, 676–682 (2012).
Thisse, C. & Thisse, B. High-resolution in situ hybridization to whole-mount zebrafish embryos. Nat. Protoc. 3, 59–69 (2008).
Gross-Thebing, T., Paksa, A. & Raz, E. Simultaneous high-resolution detection of multiple transcripts combined with localization of proteins in whole-mount embryos. BMC Biol. 12, 55 (2014).
Thurneysen, C. et al. Functional inactivation of NF2/merlin in human mesothelioma. Lung Cancer 64, 140–147 (2009).
Andre, M. & Felley-Bosco, E. Heme oxygenase-1 induction by endogenous nitric oxide: influence of intracellular glutathione. FEBS Lett. 546, 223–227 (2003).
Frei, C. et al. Pleural mesothelioma side populations have a precursor phenotype. Carcinogenesis https://doi.org/10.1093/carcin/bgr127 (2011).
Schmid, B. et al. High-speed panoramic light-sheet microscopy reveals global endodermal cell dynamics. Nat. Commun. 4, 2207 (2013).
Swinburne, I. A., Mosaliganti, K. R., Green, A. A. & Megason, S. G. Improved long-term imaging of embryos with genetically encoded α-Bungarotoxin. PLoS ONE 10, e0134005 (2015).
Hörl, D. et al. BigStitcher: reconstructing high-resolution image datasets of cleared and expanded samples. Nat. Methods 16, 870–874 (2019).
Preibisch, S. et al. Efficient Bayesian-based multiview deconvolution. Nat. Methods 11, 645–648 (2014).
Preibisch, S., Saalfeld, S., Schindelin, J. & Tomancak, P. Software for bead-based registration of selective plane illumination microscopy data. Nat. Methods 7, 418–419 (2010).
Daetwyler, S., Modes, C. D. & Fiolka, R. Fiji plugin for annotating movies with custom arrows. Biol. Open 9, bio056200 (2020).
Hashimshony, T. et al. CEL-Seq2: sensitive highly-multiplexed single-cell RNA-Seq. Genome Biol. 17, 77 (2016).
Dobin, A. et al. STAR: ultrafast universal RNA-seq aligner. Bioinformatics 29, 15–21 (2013).
Parekh, S., Ziegenhain, C., Vieth, B., Enard, W. & Hellmann, I. zUMIs—a fast and flexible pipeline to process RNA sequencing data with UMIs. Gigascience 7, giy059 (2018).
McCarthy, D. J., Campbell, K. R., Lun, A. T. L. & Wills, Q. F. Scater: pre-processing, quality control, normalization and visualization of single-cell RNA-seq data in R. Bioinformatics 33, btw777 (2017).
Stuart, T. et al. Comprehensive integration of single-cell data. Cell 177, 1888–1902.e21 (2019).
Rue-Albrecht, K., Marini, F., Soneson, C. & Lun, A. T. L. iSEE: interactive summarized experiment explorer. F1000Research 7, 741 (2018).
Love, M. I., Huber, W. & Anders, S. Moderated estimation of fold change and dispersion for RNA-seq data with DESeq2. Genome Biol. https://doi.org/10.1186/s13059-014-0550-8 (2014).
Gao, J. et al. Integrative analysis of complex cancer genomics and clinical profiles using the cBioPortal. Sci. Signal. 6, pl1 (2013).
Gu, Z., Eils, R. & Schlesner, M. Complex heatmaps reveal patterns and correlations in multidimensional genomic data. Bioinformatics 32, 2847–2849 (2016).
Blischak, J. D., Carbonetto, P. & Stephens, M. Creating and sharing reproducible research code the workflowr way. F1000Research 8, 1749 (2019).
Acknowledgements
We thank Single Cell Discoveries for executing the single-cell RNA-sequencing, as well as the Center for Microscopy and Image Analysis (ZMB) and the Cytometry Facility (FCF) of the University of Zurich for technical support and equipment. We also thank Dr. Deborah Yelon, Dr. Richard M. White, Dr. Charles K. Kaufman, and the members of the Mosimann lab for critical input on the manuscript. Species schematics in Figs. 1 and 7 were adjusted from templates provided by PhyloPic (phylopic.org). Zebrafish schematics in Fig. 1 were adjusted from BioRender (biorender.com). This work has been supported by Swiss National Science Foundation (SNSF) professorship PP00P3_139093, SNSF R’Equip grant 316030_150838 (Light Sheet Fluorescence Microscopy), SNSF CRSII5_180345, a Marie Curie Career Integration Grant from the European Commission (CIG PCIG14-GA-2013-631984), the Canton of Zurich, the UZH Foundation for Research in Science and the Humanities, the Swiss Heart Foundation, the ZUNIV FAN/UZH Alumni, the University of Colorado School of Medicine, Department of Pediatrics and Section of Developmental Biology, and the Helen and Arthur E. Johnson Foundation and Children’s Hospital Colorado Foundation to C.M.; the Swiss Bridge Foundation to A.B. and C.M; a UZH CanDoc to S.N.; EuFishBioMed and Company of Biologists travel fellowships to K.D.P.; SNSF postdoc mobility fellowship P400PB_191057 to J.K.R.; Human Frontier Science Program (HFSP) long-term postdoctoral fellowship LT000078/2016 to S.R.N.; SNSF grant 320030_182690 and Stiftung für Angewandte Krebsforschung to E.F.B.; SNSF 310030L_182575 and ERC Starting Grant 2013 337703 to N.M.; SNSF grants 310030_175841 and CRSII5_177208 and University of Zurich’s Research Priority Program Evolution in Action to M.D.R..
Author information
Authors and Affiliations
Contributions
K.D.P. and C.M. conceived the project and designed the study. K.D.P. performed the zebrafish experiments together with E.C.B. and Z.L. K.D.P., S.N., and A.K. performed and interpreted gene expression analysis in zebrafish embryos. K.D.P. and S.N. prepared and interpreted the scRNA-seq. H.L.C., C.S., and M.D.R. processed and analyzed the scRNA-seq data. S.D. and K.D.P. acquired data with multidirectional SPIM (mSPIM) and processed the data. S.R.N. generated map projection scripts. A.E. and H.S. generated wt1b:creERT2. D.E.C. and A.B.F. performed mouse lineage tracing experiments. M.R. performed the IHC of mouse and human tumor samples, M.R. and J.K. performed qPCR on mesothelioma human patient samples, E.F.B., M.R., and J.K. analyzed the mouse and human samples, J.K. and R.O. analyzed TCGA data. E.R., N.M., J.H., E.F.B., A.B., M.D.R., and C.M. supervised. K.D.P. compiled the data and K.D.P. and C.M. wrote the manuscript with input from all co-authors, E.F.B wrote sections of the manuscript related to mesothelioma.
Corresponding author
Ethics declarations
Competing interests
The authors declare no competing interests.
Peer review
Peer review information
Nature Communications thanks the anonymous reviewers for their contribution to the peer review of this work. Peer reviewer reports are available.
Additional information
Publisher’s note Springer Nature remains neutral with regard to jurisdictional claims in published maps and institutional affiliations.
Source data
Rights and permissions
Open Access This article is licensed under a Creative Commons Attribution 4.0 International License, which permits use, sharing, adaptation, distribution and reproduction in any medium or format, as long as you give appropriate credit to the original author(s) and the source, provide a link to the Creative Commons license, and indicate if changes were made. The images or other third party material in this article are included in the article’s Creative Commons license, unless indicated otherwise in a credit line to the material. If material is not included in the article’s Creative Commons license and your intended use is not permitted by statutory regulation or exceeds the permitted use, you will need to obtain permission directly from the copyright holder. To view a copy of this license, visit http://creativecommons.org/licenses/by/4.0/.
About this article

Cite this article
Prummel, K.D., Crowell, H.L., Nieuwenhuize, S. et al. Hand2 delineates mesothelium progenitors and is reactivated in mesothelioma. Nat Commun 13, 1677 (2022). https://doi.org/10.1038/s41467-022-29311-7
Received:
Accepted:
Published:
DOI: https://doi.org/10.1038/s41467-022-29311-7
This article is cited by
Comments
By submitting a comment you agree to abide by our Terms and Community Guidelines. If you find something abusive or that does not comply with our terms or guidelines please flag it as inappropriate.
