
Abstract
Hard disk drives (HDDs) are used as secondary storage in digital electronic devices owing to low cost and large data storage capacity. Due to the exponentially increasing amount of data, there is a need to increase areal storage densities beyond ~1 Tb/in2. This requires the thickness of carbon overcoats (COCs) to be <2 nm. However, friction, wear, corrosion, and thermal stability are critical concerns below 2 nm, limiting current technology, and restricting COC integration with heat assisted magnetic recording technology (HAMR). Here we show that graphene-based overcoats can overcome all these limitations, and achieve two-fold reduction in friction and provide better corrosion and wear resistance than state-of-the-art COCs, while withstanding HAMR conditions. Thus, we expect that graphene overcoats may enable the development of 4–10 Tb/in2 areal density HDDs when employing suitable recording technologies, such as HAMR and HAMR+bit patterned media
Introduction
There has been an incessant increase in data generation over the past few decades1. The annual data creation rate was ~16.1 zettabytes/year (ZB, 1ZB = trillion gigabytes (GB)) in 20161, and is expected to increase to ~163 ZB/year by 20251. While various devices are used to store digital information, e.g., tape2 and flash drives3,4, hard disk drives (HDDs) remain the primary choice as a secondary storage devices, due to their low cost <0.1$/GB at 2016 prices3 and large storage capacity >10 TB with 3.5 inch HDDs3. HDDs will rule storage technologies at least for the next 5–10 years5 in terms of capacity3,4, price3,4, production3,4, and shipment3,4. Supplementary Note 1 provides the key background concepts on HDD technology and the main technological challenges.
Solid state drives3,4 are the main competing technology, posing a threat to future HDD viability4. Thus, novel technologies are needed to enable HDDs with high areal density (AD) >1 Tb/in23,6.
One option is to reduce the head-hard disk medium (HDM) spacing, since this decreases the signal-to-noise ratio6 and limits AD growth6. There are many contributors to the head-HDM spacing (Fig. 1a and Supplementary Note 1), whereby the HDM overcoat is the largest contributor.

a Schematic cross-section of a hard disk drive with magnetic medium, disk overcoat, lubricant, fly height, head overcoat, head. The head-medium spacing and fly height/clearance are indicated by arrows. The slider containing the read/write head and the head overcoat are shown as well. For 1 Tb/in2, the head-media spacing is ~8.9–6.5 nm6, based on the sum of overcoat thickness (2.5–2 nm)6, lubricant thickness (1.2–1 nm)6, touch down height (2–1 nm)6, fly clearance (1.2–1 nm)6 and head overcoat thickness (2–1.5 nm)6. b Full stack of bare CoCrPt:Oxide-based hard disk media comprising a glass substrate, seed bottom underlayer, and antiferromagnetic layer (A-FM) between two soft-magnetic under layers (SUL), followed by two intermediate layers and a co-based magnetic recording layer. c Bare medium (BM). d Magnetic medium with ~2.7 nm commercial COC. e Magnetic medium with ~2.7 nm commercial COC and ~1 nm commercial lube. f Full stack of bare FePt-based hard disk medium (HDM) containing glass substrate, a layer of CrRu followed by layers of MgO and FePt.
Carbon-based overcoats (COCs) are widely used to protect HDM from mechanical damage7,8,9,10,11,12 and corrosion8,13,14,15, to ensure maintained functionality and durability13,14. By extrapolating Fig. 2 in ref. 6, a COC thickness <1 nm would be required for ~10 Tb/in2. However, current COCs lose most of their appealing properties, such as anti-friction11,12,15, wear resistance11,12, Young’s Modulus7,8,13,16, and corrosion protection7,8,13,16, when their thickness is below 2–3 nm.
The ideal overcoat needs to provide: (1) corrosion protection, requiring complete coverage11,14 without pinholes13,14; (2) coefficient of friction (COF), i.e. the ratio of frictional to normal force, below 0.3–0.5, lower than in 2.7 nm commercial COCs11,15 and wear resistance11,12,14, requiring better lubricating properties11,12, hardness and elasticity with Young’s modulus of at least ~400 GPa7,14; (3) lubricant compatibility14; (4) surface smoothness16,17,18, i.e., root mean square roughness ~0.2–0.3 nm14. Given the limitations to achieve most of these properties with conventional COCs below 2 nm7,8,13,19, either the search for novel overcoats or engineering of existing overcoats is required to enable future ultra-high AD HDDs.
Another critical bottleneck hindering AD growth is the superparamagnetic limit20,21, which contributes to the magnetic trilemma, linking the three problems: AD increase, thermal stability, writability6,20,21,22 (see Supplementary Note 1).
To overcome writability issues in materials with high magnetic anisotropy, heat assisted magnetic recording (HAMR) was suggested23,24,25. HAMR uses a laser to heat the magnetic medium for ~1 ns23 in order to decrease its coercivity, bringing the material to its Curie temperature, TC, above which it is writable with a magnetic field ~0.8 T by conventional heads26. After cooling to room temperature, the coercivity goes back to its original value, and data is retained27. While HAMR appears to be a solution to all issues, such as small grain size, high magnetic anisotropy, and writability, and paves the way to increasing AD, it raises concerns on the thermal stability of COCs against laser irradiation28,29,30. As TC is ~ 700–750 K for FePt22,28,29, reached by laser irradiation, the overcoats for HAMR require thermal stability at least up to ~700–800 K to avoid degradation over time23,28,29.
Efforts are ongoing to test the thermal stability of HDM overcoats, e.g., by using laser28,29 and thermal annealing30, and by changing the thermal treatment time28,30,31 and heating rate28,29,30,31, to design HAMR-compatible overcoats. Reference 28 reported oxidation, degradation, and removal of a ~5 nm hydrogenated amorphous carbon, a-C:H,-based commercial COC on HAMR-compatible HDM in HAMR-like conditions, with 0.25 s total irradiation time. Reference 29 also reported degradation of 4 nm a-C:H-based commercial COC on a FePt-based HDM in HAMR-like conditions, with total heating time ~0.1 ms, corresponding to a 5-year drive life or 157.68 × 10⁶ s29 (see Supplementary Note 1).
Better thermal stability was reported in filtered cathodic vacuum arc (FCVA)-based COCs under laser irradiation in HAMR-like conditions29 and thermal annealing up to ~940 K32, consistent with the good thermal stability, i.e., no change in sp3 content up to 1100 °C, found in tetrahedral a-C (ta-C) films33. However, FCVA-based COCs are not yet used as HDM overcoats due to the presence of macro-particles6,34.
Graphene is an emerging material for lubrication35,36,37,38,39, as well as oxidation40 and corrosion protection41,42,43. Reference 37 reported that single-layer graphene (1LG) reduced the steel COF from 0.9 to 0.3 with a coating lifetime up to 6500 cycles, and decreased the wear rate by two orders of magnitude. Multilayer graphene (MLG) (3–4 layers) showed excellent tribological performance with a COF < 0.2, a decrease of wear rate by three orders of magnitude, and sliding lifetime up to 47000 cycles on steel37. Reference 35 reported that 1LG exhibits superlubricity35 and reduced the COF by 2–3 times and wear rate by two orders of magnitude for Au-based electrical contacts38. 1LG decreases the oxidation and corrosion of various metals, such as Ni40,41,43, Co41, Fe41, Pt41, Cu40,42,43, Ag42. Reduced graphene oxide was also used as a barrier coating44. Reference 45 reported that suspended 1LG has good thermal stability up to 2600 K, with a thermal conductivity up ~ 2000 W/mK46. In ref. 47, we showed that it is possible to achieve high mobilities ~30,000 cm2 V/s at room temperature in wet transferred, polycrystalline 1LG. Thus, scalable processes, such as wet transfer, can be used for integration and packaging47,48. All these characteristics make 1LG promising as a protective overcoat for both existing and HAMR-based technologies.
Here we use 1–4 layers of chemical vapor deposition (CVD) grown graphene (1–4LG) transferred on Co-alloy (current technology) and FePt-based (HAMR technology) HDMs, and test friction, wear, corrosion, thermal stability, and lube compatibility. We demonstrate that 1LG shows better performances than current 2.7 nm COCs on Co-alloy-based HDM, and good tribological properties with a COF < 0.2 for >10,000 cycles. We achieve very low COF ~ 0.15 for 1LG, indicating high wear resistance and corrosion protection, with corrosion current densities < 5 nA/cm2 for 2–3LG. Thermal stability tests confirm that 1LG on FePt can withstand HAMR-like conditions, without degradation. Graphene’s superior performance and its thinness can enable the development of ultra-high-density magnetic data storage technologies, based either on current technology, as well as on HAMR, or HAMR combined with bit patterned media (BPM), where the magnetic storage layer is patterned into an array of pillars, each representing a single bit49. The combination of 1LG + HAMR + BPM may increase AD > 10 Tb/in2.
Results
Magnetic media substrates
We use CoCrPt:Oxide-based bare HDM (BM) from Hitachi Global Storage Technologies (now Western Digital). These comprise multiple layers: seed bottom layer, soft-magnetic under layers (SUL), antiferromagnetic layer (A-FM), intermediate layers, and CoCrPt:Oxide storage layer (Fig. 1a, b). We also use other HDM from Western Digital with ~2.7 nm commercial COC (CMC, Fig. 1c), and ~2.7 nm commercial COC + ~1 nm commercial PFPE lube (CMCL, Fig. 1d) as reference.
The details and nomenclature of the COCs are in Table 1. The structural properties of the FCVA and sputter-deposited COCs can be found in refs. 50,51. HAMR-compatible FePt-based HDMs are shown in Fig. 1f. See Supplementary Notes 2 and 3 for further details.
Graphene growth and transfer
Graphene is grown by chemical vapor deposition (CVD) and placed on the HMD by wet transfer52,53, as described in the “Methods” section. The quality and uniformity of the samples are assessed by Raman spectroscopy54. Unpolarized Raman spectra are recorded at 514.5, as well as at 785 nm, close to the 850 nm used for HAMR writing tests25,55, with a Renishaw InVia spectrometer equipped with a Leica DM LM microscope and a ×100 objective with a numerical aperture 0.85. A 514.5 nm Raman spectrum of 1LG on Cu before the transfer is shown in Fig. 2a. The photoluminescence (PL) background due to the Cu foil is removed using baseline subtraction56. The D to G intensity ratio I(D)/I(G) is <0.1, indicating a defect concentration nd < 2.4 × 1010 cm−2 54,57,58,59 (Fig. 2b). The 2D peak position can be fitted with a single Lorentzian with Pos(2D) ~ 2705 cm−1 and full-width-half-maximum, FWHM(2D) ~ 33 cm−1, a signature of 1LG54,60. The G peak position and FWHM(G) are ~1593 cm−1 and 16 cm−1. I(2D)/I(G) and A(2D)/A(G) are ~2.3 and 4.9.

a 514.5 nm Raman spectra of as-grown 1LG on Cu (before transfer) and 1–4LG transferred on CoCrPt:Oxide after CoCrPt:Oxide background subtraction. b 514.5 nm Raman spectra of CoCrPt:Oxide substrates and 1–4LG transferred onto CoCrPt:Oxide. c, d 785 nm Raman spectra of 1LG on (c) Si/SiO2 and (d) FePt-based HAMR-HDM, for different laser power densities.
Representative Raman spectra of 1–4LG transferred on HDM are in Fig. 2a, with the HDM spectrum subtracted. The HDM spectrum and the spectra of 1L–4LG on HDM before background subtraction are in Fig. 2b. By subtracting the reference spectrum, using the N2 Raman peak from the air for normalization, from the spectrum taken on 1LG-coated HDM, we can reveal the 1LG contribution. After transfer, all peaks are downshifted and broader, with Pos(2D)1LG ~ 2672 cm−1, Pos(2D)2LG ~ 2681 cm−1, Pos(2D)3LG ~ 2687 cm−1, Pos(2D)4LG ~ 2682 cm−1, FWHM(2D)1LG ~ 61 cm−1, FWHM(2D)2LG ~ 57 cm−1, FWHM(2D)3LG ~ 49 cm−1, FWHM(2D)4LG ~ 53 cm−1. Assuming 2686 cm−1 as unstrained Pos(2D)61 and a rate of change in Pos(2D) with strain δPos(2D)/ δϵ ~ −64 cm−1/%61, this would give ~0.22% uniaxial strain in 1LG, consistent with the large FWHM(2D)61,62. We assume the strain to be mostly uniaxial, because it is unlikely to have biaxial, i.e., perfectly isotropic strain, in all directions, unless this is induced on purpose. There is a small increase in I(D)/I(G) to ~0.2 for 2–4LG on HDM.
Current commercial HDD technology uses a ~2.5–3 nm COC deposited by plasma-based processes12,63. The thickness and roughness of 1–4LG are measured by Atomic Force Microscopy (AFM), as discussed in Supplementary Note 5. This shows that the thickness of 4LG on HDM is ~2.1 nm (Supplementary Fig. 3), well below that of the current commercial COC. Graphene is transferred without such an energetic process as that used for commercial COC deposition. Thus, it does not adversely affect the magnetic performance. Even considering that COCs slightly affect the HDM magnetic properties, the influence of graphene will be much less than commercial COCs deposited by energetic processes, where energetic atoms/ions (neutrals also) hit and participate in deposition onto the HDM. Reference 64 reported that 1LG grown by CVD on Co (and Ni) does not affect the magnetic properties of these materials. In order to confirm this in our case, we perform polar magneto-optical Kerr effect measurements on BM, BM covered with ~2–3 nm COC, and BM covered with 1–4LG. 1–4LG coating results in a small change in the hysteresis loop. The coercivity changes from 510 mT (BM) to ~545 mT (1–4LG and COC). The remanent magnetization is unchanged at ~97–98% of the saturation magnetization when compared to BM. The coercivity and the remanent magnetization of 1–4LG-coated BM are similar to BM+COC, indicating that graphene coating does not have any detrimental effect on the media, see Supplementary Note 6 for details.
Laser irradiation stability
HAMR is not possible without laser heating. References 22,25,65 reported that FePt does not degrade upon laser heating, with lubricant and COC being the main concerns when it comes to laser irradiation. Consistent with refs. 25,55, here we use an IR laser to examine the 1–4LG irradiation stability. To test whether 1LG can withstand HAMR conditions we consider 1LG transferred on L10-FePt-based HDM25,27,55 and on Si/SiO2. Reference 55 achieved Tc at ~1.3 mW/μm2 by optimizing aperture optics. Reference 25 suggested using a laser power density ~107 W/cm2 and ~0.35 × 10⁷ W/cm2 for FePt-based HDM. We perform Raman measurements at 785 nm, the available Raman wavelength closest to that used in HAMR (~830 nm25,55), with a spot size ~1.24 μm, as determined by the razor blade technique, see Supplementary Note 7 for details. We vary the power density from ~1.3mW/μm2 (0.013 × 10⁷ W/cm2) to ~31.5 mW/μm2 (0.315 × 10⁷ W/cm2) in order to examine the laser irradiation-driven evolution of the SLG Raman spectrum under HAMR power densities.
We first consider Si/SiO2/1LG. We record spectra at different power densities for ~4 min to achieve a good signal-to-noise ratio. Figure 2c shows that 1LG on Si/SiO2 has no D peak even for the highest power density. Pos(G) downshifts from ~1588 to 1583 cm−1, indicating an increase in T ~ 312.5 K with respect to room temperature, by taking ~−0.016 cm−1/K as a shift of Pos(G) with T66. Figure 2d plots the data for 1LG on FePt HDM, with I(G) normalized to that at 1.3 mW/μm2. In this case, the FePt substrate is rotated at 4100 rpm on a circular track with a diameter ~4 mm to simulate rotating HDD conditions, with a 20 min acquisition time, much larger than the total laser irradiation time expected for a 5-years life of HAMR-based HDDs29. No D peak is seen for all power densities, thus confirming the stability of 1LG. The Raman data show that no visible changes occur during the irradiation test measurements.
Friction and wear
The HDM comprises magnetic/metallic layers, including Co-alloys-based magnetic storage layers14,20, with a high COF ~0.6–0.811,15 and wear11,15. Therefore, they can experience mechanical damage whenever intermittent contact occurs with the head11,15, and are susceptible to corrosion8,11,14 and oxidation11,15, leading to HDD degradation or damage. The current ~ 2.7 nm commercial COCs have a high COF ~ 0.3–0.511,15 and wear in a ball-on-disk tribological environment11,15, which can result in damage, hence durability concerns, see Supplementary Note 1 for more details.
Reference 11 used FCVA to deposit ~1.5–2 nm carbon films for protection of Co-alloy-based HDM and reported low COF ~0.25, wear, and corrosion. Here, we use 1–4LG grown by CVD for Co-alloy-based and HAMR HDDs.
Since in HDDs the HDM spins during operation, COF and wear need to be examined in a setup mimicking HDD operation. AFM and other tip-based tools are used to measure COF and wear39. In contrast to setups with rotating geometry, tip-based tools measure the COF based on the movement of the tip in the lateral direction39. Ball-on-disk measurements (rotation-based geometry) have a similar assembly as HDDs, with samples rotating while the counterface is in contact with the surface11,35, thus measuring COF. We perform ball-on-disk tests using a nano-tribometer (CSM Instruments) in a cleanroom, to have a controlled environment with T = 23 ± 1 °C and a relative humidity ~55 ± 5%. A sapphire ball (Al2O3) of diameter ~2.0 ± 0.1 mm and surface roughness ~5.0 ± 0.1 nm is used as the counterface because the hard disk head is made of an Al2O3-based composite6. During the test, a normal load ~20 mN and a rotational speed ~100 rpm are used, corresponding to a linear speed ~1.05 cm/s for 10,000 cycles.
Since in HDDs the contact occurs occasionally6, the 10,000 cycles in our setup are much higher than the HDD operational lifetime. After each test, the wear track and ball images are captured using an optical microscope. To check repeatability, tests are performed 2–7 times. When two surfaces are in contact, and at least one of the surfaces starts to slide with respect to the other, friction and wear occur67. As a result, a wear track is formed.
Figure 3 plots representative friction curves for BM, CMC, CMCL, and BML (Fig. 3a) coated with 1–4LG (Fig. 3b), and BM coated by FCVA (Fig. 3c). The average COFs are in Fig. 4, including HDM coated by DC-sputtering. BM has the highest COF ~ 0.8, with substantial wear, as confirmed by optical images of balls and wear tracks in Figs. 5 and 6. The COF of ~2.7 nm CMC reaches ~0.4 at 10,000 cycles, but with strong fluctuations between ~0.2 and 0.6 at 1500 up to ~3500 cycles (Fig. 3a), and negligibly improves wear with respect to BM (Fig. 3a). The transfer of 1–4LG reduces COF < 0.2 for all samples, and gives non-fluctuating, smooth friction curves. The COF for 1–4LG-coated samples (without lube) is ~4 times lower than BM and ~2 times lower than CMC, despite a reduction of thicknesses ~7 times (for 1LG) to 2 times (for 4LG), using the theoretical 1LG thickness, with respect to CMC. Figures 5b, d and 6b, d reveal that the wear track width of 1–4LG-coated samples is ~2–4 times lower and debris transferred to the ball are smaller than BM and CMC, indicating higher wear resistance. All FCVA COCs with thicknesses from ~0.3 to ~1.8 nm show ~2–5 times higher COF than 1–4LG-coated samples, with and without lube, apart from 1LG without lube. Pulsed DC sputtered COCs have ~2–3 times higher COF than 1–4LG-coated samples.

Representative friction curves for (a) BM, commercial medium with commercial ~2.7 nm COC (CMC), commercial medium with commercial ~2.7 nm COC and ~1.0 nm PFPE lube (CMCL), BM coated with ~1.2 ± 0.2 nm PFPE lube (BML). b HDM coated with 1–4LG. c HDM with FCVA-ta-C of different thicknesses with 0.3 (3CF), 0.6 (6CF), 1.2 (12CF), and 1.8 nm (18CF) FCVA-deposited ta-C. d HDM coated with 1–4LG and ~1.2 ± 0.2 nm PFPE lubricant (L).

Average COF from measurements in Fig. 3, with and without lubricant, for 1–4LG and all COC reference samples. The red shaded region highlights the bare media and media with a commercial overcoat, the yellow region highlights media with graphene overcoat, and the blue region highlights media with FCVA-ta-C. The horizontal red dashed line is a reference at COF = 0.2. The error bars indicate the spread around the average COF.

Raman spectra, normalized to I(G), recorded across wear tracks of (a) 1LG and (c) 2LG and corresponding optical pictures in (b) and (d). In (b), (d) The Raman spectra are recorded across the wear tracks at the positions indicated by the yellow circles to compare graphene before and after friction and wear tests. The colors of the traces are due to a mixture of graphene, HDM components, and polymer residues coming from graphene transfer.

Raman spectra, normalized to I(G), recorded across wear tracks of (a) 3LG and (c) 4LG and corresponding optical pictures in (b) and (d). In (b), (d) The Raman spectra are recorded across the wear tracks at the positions indicated by the yellow circles to compare graphene before and after friction and wear tests. The colors of the traces are due to a mixture of graphene, HDM components, and polymer residues coming from graphene transfer.
To further analyze the wear tracks, Auger Electron Spectroscopy (AES) imaging is performed using a JEOL JAMP Auger Microprobe, see Supplementary Note 4 and Supplementary Fig. 1 for details. Before AES, scanning electron microscope images are taken to select the AES locations. The AES images inside and outside the wear tracks show the carbon-containing sites, and indicate that the amount of carbon on the wear track increases with increasing number of graphene layers, N. The Co and Cr intensities inside the wear tracks are higher for 1LG, and decrease with increasing N, due to the increase in C and the <1–3 nm sampling depth of AES68. The O signal in the wear track appears due to ambient oxygen as the samples are exposed to air before AES, with some contribution from the HDM oxide.
After ball-on-disk tests, the wear tracks are analyzed by recording Raman spectra across the wear track at different positions. Reference 58 introduced a three-stage model of amorphization. Stage 1: graphene to nanocrystalline graphene. Stage 2: nanocrystalline graphene to low sp3 amorphous carbon. Stage 3: low sp3 to high sp3 amorphous carbon. For all spectra in Figs. 5 and 6, as the D peak increases, D′ and D+D′ appear, whereas the I(2D) weakens when approaching the wear track, indicating an increase in disorder according to stage 1. The broad peak between 500 and 1000 cm−1 is due to the glass substrate69. At the center of the wear track, all second-order Raman features (i.e., 2D, 2D′, and D+D′) merge, while I(D) decreases and D,G become broader, indicating an increase of disorder58. 2–4LG is less damaged than 1LG, as for the spectra in Fig. 5a, c and I(D)/I(G) in Fig. 7a, from at least 5 positions as a function of COF, without and with lubricant (L). Overall, there seems to be no significant trend of I(D)/I(G) with COF. However, a difference is seen without lubricant: I(D)/I(G) is ~0.95 and ~1 for 3–4LG, while for 1–2LG it is ~1.33 and ~1.25. Thus, there are less defects in 3–4LG compared to 1–2LG. The peaks <1000 cm−1 in Fig. 7b are due to the HDM: those ~470 cm−1 (Eg), 513 cm−1(F2g), 606 cm−1(F2g), 673 cm−1 (A1g) are from Co3O470,71, while the Ag mode ~550 cm−1 is from Cr2O372.

a Mean I(D)/I(G) of 1–4LG-coated samples, with and without lube, after friction tests, as a function of COF. The error bars come from averaging over the intensity ratios of the peaks in the Raman spectra recorded across the wear tracks. b Raman spectrum on a wear track. The region ~400–750 cm−1 shows peaks of the underlying substrate.
Effect of lubricant
Current commercial HDDs use a layer of perfluoropolyether (PFPE) lubricant (lube)11 on top of COCs to further reduce friction and wear, and minimize surface energy. Given the lubricating and corrosion protection properties of 1LG itself, lube may not be needed for 1LG. However, exploring the compatibility of 1LG with lube is useful from the fundamental viewpoint.
Friction measurements on lube-coated samples (Fig. 3) show that in certain cases the COF is higher with L, than without. Taking the error bars into account, a significant difference in COF is only observed for 1LG and 1LGL. 1LG has wetting transparency73, i.e., it is thin enough that its introduction does not affect the wettability of an underlying substrate. Without overcoat, the L containing HDM, as in BML, shows very high COF ~ 0.55 and wear, due to the metal (medium) L-induced catalysis74. 1LG is not enough to avoid the interaction of L with medium, hence higher COF ~ 0.45 and wear is observed in 1LGL. Without L, 1LG shows very low COF ~ 0.15 and wear. A minor difference in case of 2LG versus 2LGL can be seen. However, for 3LG versus 3LGL and 4LG versus 4LGL the difference in average COF is marginal. L on 1LG results in higher and inconsistent COF and wear, as some measurements show lower COF ~ 0.15, some higher ~0.78, with COF increasing after few thousands cycles. The COF of 1LG, on an average, is ~0.45, i.e., ~3 times its non-lubricated counterpart. Thus, COFs of 2–4LG are more or less similar to those of the non-lubricated counterparts, suggesting that 2–4LG without L are lubricious enough, and that L does not improve lubricity. The D and G peaks in the Raman measurements in Figs. 5 and 6 on 1–4LG confirm the presence of carbon on the wear tracks, and transfer of debris to the balls, similar to the non-lubricated counterparts.
Corrosion
Co-alloys have a great propensity to corrode, mainly due to Co oxidation75. This results in the loss of magnetic properties75, hence this is one of the major concerns for the long-term functionality and durability of HDDs14,51,75. To examine the corrosion protection efficiency of 1–4LG and compare their performance with state-of-the-art COCs, the corrosion of different uncoated- and coated-HDM, exposed to an electrolyte solution ~0.1 M NaCl similar to that used in refs. 75 on a ~0.24 cm2 area, is investigated using an electrochemical corrosion method51,75. The measurements are performed with a 3-electrode setup with a Pt wire as counter electrode, Ag/AgCl as reference electrode and HDM as working electrode, to which the potential is applied51. Each test consists of anodic and cathodic sweeps, where the potential is varied and the corresponding current measured51. Every sweep is conducted at different locations, with at least 3 sets of 6 sweeps on each sample. The so-called Tafel’s analysis75 is done by plotting anodic and cathodic curves on a semi-logarithmic scale of potential versus log current. The linear part of the logarithmic anodic and cathodic currents are extrapolated75, and the intercept of these lines gives the corrosion current75, and the corrosion current density Jcorr when divided by the contact area.
The corrosion protection efficiency (CPE) defines how efficient the COC is in protecting against HDM corrosion. This is defined as51:
where \({J}_{\,\text{corr}\,}^{0}\) is the BM corrosion current density and Jcorr that of coated HDM.
When a metal is exposed to a corrosive solution, it releases ions that leave behind electrons, which can be observed in an anodic reaction as75:
where M represents the metal and n the number of electrons released by it. For Co-alloy-based systems, the metal dissolution, which decreases the anode conductivity75, can be written as75:
As the corrosion reaction involves the transfer of electrons and ions between metal and solution75, the corrosion rate varies with corrosion current75, hence Jcorr varies inversely with corrosion resistance, i.e., the COC ability to reduce the HDM corrosion51,75.
The BM shows the highest Jcorr, indicating the greatest propensity to corrode (Fig. 8). Introduction of 1–4LG reduces HDM corrosion. Jcorr decreases with N, from ~5.3 nA/cm2 for 2LG to ~4.4 nA/cm2 for 4LG, Fig. 8, and CPE increases. The COC defects and pinholes are the active corrosion sites75, and their electrical conductivity could further add galvanic corrosion75. The COC should be defect- and pinhole-free, smooth, and with excellent barrier properties to minimize HDM oxidation and corrosion. Reference 43 showed that 1LG can be used as a corrosion barrier for metallic surfaces, and suggested that this should be uniform and defect-free to achieve corrosion protection. In our case, 1LG reduces Jcorr by ~2.5 times with respect to BM, but it is twice that of BM with ~2.7 nm COC. For 2LG, Jcorr is ~3.8 times smaller than BM, and marginally higher than COC. This is remarkable as the 2LG thickness ~0.7 nm, is ~4 times lower than ~2.7-nm-thick COC. Beyond 2LG, Jcorr and CPE remain similar, adding marginal anti-corrosion improvement (Fig. 8). The higher corrosion protection in 2–4LG with respect to 1LG is mainly due to the fact that the increase in N improves the HDM coverage, leading to the reduction of active corrosion sites. 2–4LG display corrosion protection similar to COC, attributed to better barrier properties. Figure 8 indicates that, for a similar thickness, graphene-based overcoats have lower Jcorr than amorphous COCs, indicating greater protection. Figure 8 shows that the corrosion resistance performance of 1LG is ~2.5 times better than BM, but ~2 times higher than COCs. By adding graphene layers the corrosion resistance is improved. The difference in corrosion current density between COC and 2–4LG is 30–10%. Thus, the corrosion resistance of 2–4LG approaches that of COCs. Taking into account that the theoretical thickness of 1LG is ~8–9 times lower than state of the art COCs, and that a COC having the same thickness as 1LG would provide no protection and be full of holes19, 1LG comfortably beats any COC of the same thickness (i.e., same storage density).

Corrosion current density Jcorr and corrosion protection efficiency (CPE) for different samples. The corrosion resistance varies inversely with Jcorr51. 2–4LG have similar CPE to ~2.7 nm CMC and ~1.8 nm COC in sample 18CF. The dotted line is a guide to the eye for Jcorr of different samples. The arrow compares various 1–4LG-COCs pairs, such as 1LG → 3CF, 2LG → 8CS, 3LG → 12CS, and 4LG → 18CF, as the 1–4LG-based sample in each pair is always slightly thinner than the amorphous COC. The red shaded region highlights the bare media and media with a commercial overcoat, the yellow region highlights media with graphene overcoats and the blue region highlights media with FCVA-deposited ta-C. The horizontal red dashed line is a reference at Jcorr = 4 nA/cm2. The error bars stem from taking the average of multiple repeated measurements.
Discussion
Friction is defined as resistance to sliding36,76. At the macroscopic level, Amonton’s law76 states that the frictional force between two bodies varies proportionally to the normal force. Hence:
where F [mN] is the frictional force and W [mN] is the normal force. This does not take into account the area of contact at the microscopic level76. Reference 76 suggested that the contact between two bodies contains several smaller contacts, called asperities, with the sum of the areas of these asperities being lower than the apparent macroscopic area76. Thus, from ref. 76, F in micro-tribology can be expressed as:
where τ is the shear strength, i.e., the stress required to shear the contacting interfaces and enable sliding, expressed as shear force/area and ∑Aasp is the sum of the areas of the asperities, also called real contact area76. Hence, friction also depends on ∑Aasp. Reference 76 showed that the stresses over regions of contact reach the elastic limit of the material and cause plastic deformation. Thus, the average pressure (p) in a contact region is governed by the normal force, and is given by p = W/A77. The zone of deformation increases with increase in load, and p on the region of contact tends to a stable value, which eventually causes the deformation to become entirely plastic. The process continues until the area of contact becomes sufficient to support the load W. Consequently, the normal force can be expressed as:
A co-alloy is mechanically softer78 than Al2O379. When a metallic co-alloy surface slides against Al2O3, it causes the HDM surface to undergo plastic deformation76, generating wear and high COF ~0.8, Figs. 3 and 4, consistent with the friction results for metallic surfaces in ref. 76. This could be due to the formation of an adhesive contact at the HDM-ball interface, due to the high surface energy of Co-alloy-based HDM ~ 42.8 mN/m80, and the presence of contaminants at the interface that may enhance the interaction between the two bodies81. When 1LG is placed on HDM, the COF decreases ~4 times and negligibly changes with N.
At the nanoscale, the friction of 1LG on Si/SiO2 against Si tips, measured at a low load ~1 nN and scan speed ~1–10 μm/s, was explained based on out-of-plane deformation in front of a scanning probe tip, the so-called puckering effect39,82. This enhances the contact area, hence friction. The out-of-plane deformation is suppressed with increasing N82, resulting in reduced COF. This is not applicable to ball-on-disk tribological tests of 1–4LG, due to the significantly larger dimension (ball radius ~ 2.0 ± 0.1 mm) of the counterface, much higher load ~20 mN and higher speed ~100 rpm or 1.05 cm/s, which do not precisely differentiate the frictional characteristics of 1–4LG. Thus, all coated media show similar friction (Fig. 3b). Since the layers are coupled by van-der-Waals forces, they shear easily, as their interfacial shear strength is low, with a shear force per unit area α ~ 12.8 ⋅ 1018 N/m3 83 and a resulting shear modulus C44 ~ 4.3 GPa83. The ease of shearing at sliding contacts results in smoother frictional curves (and marginally lower COF) in 2–4LG with respect to 1LG. The improved wear resistance for 1–4LG-coated HDM is attributed to reduced friction, wear, and excellent mechanical properties of 1LG: breaking strength ~42 N/m84, Young’s Modulus ~ 1 TPa84, flexibility (1LG can be stretched up to ~20% without breaking84).
When compared to BM, the COF reduction of 1–4LG-coated HDM could be attributed to reduced adhesive interaction (lower surface energy)36,85, as well as incommensurability of the lattice planes sliding against each other at the tribological interface35, occurring when the hills of a surface with lattice spacing a do not match the valleys of another surface of lattice spacing b, such that b/a is an irrational number35. This is consistent with what suggested in ref. 35 for 3–4LG on Si/SiO2 sliding against an a-C:H-coated steel ball, and for 1–3LG on a steel sliding against a steel ball35,37 in macroscale ball-on-disk conditions, e.g., with a normal force in the z direction Nz ~ 0.5–3 N, and speeds ~0.6–25 cm/s.
The AES on the wear tracks and Raman measurements across the wear tracks, after ball-on-disk tribological tests, in Figs. 5 and 6 show that a C signal is still present in all 1–4LG samples, even though disorder-induced peaks appear. Reference 86 also found C on wear tracks after microscale friction and wear tests of graphene on SiC. The counterface also reveals transferred debris, consisting of disordered carbon and underlying substrate atoms. This implies that, when a 20 mN load is applied and the sample starts to rotate at ~2.1 cm/s, 1LG could be turned into patches, due to the large contact load. Reference 86 reported transformation of continuous layers of 1–2LG into 1–2LG patches during microscale tribology, despite using lower load ~0.1–1 mN and speeds ~30–50 μm/s compared to us. This led to a distribution of 1LG patches along the wear track, and transfer of 1LG-containing debris on the counterface. This also happens for 2–4LG-coated HDM. Raman measurements in Figs. 5 and 6 show disordered carbon on the wear tracks, with disorder lower than for 1LG, as revealed by I(D)/I(G) (Fig. 7). This implies that 1LG acts as lubricant when in contact with another 1LG, and is not completely removed during tribological tests. AES also reveals a progressive increase in C and C-containing sites on the wear tracks with increasing number of layers. The debris transferred to the ball also contain C. Therefore, the formation of disordered carbon debris on both surfaces facilitates smooth sliding, and contributes to maintaining the low COF. The marginally lower friction in 2–4LG as compared to 1LG can be linked to I(D)/I(G) (Fig. 7a), with lower disorder corresponding to lower friction, although this does not apply for 1–4LGL.
Figure 9 is the proposed mechanism for friction reduction for 1LG and 3LG-coated HDM, where C debris are on both ball and wear track. To validate these assumptions, we perform molecular dynamics (MD) simulations of a Co∣Pt–sapphire system with and without 1 and 4LG, as discussed in Supplementary Note 8.
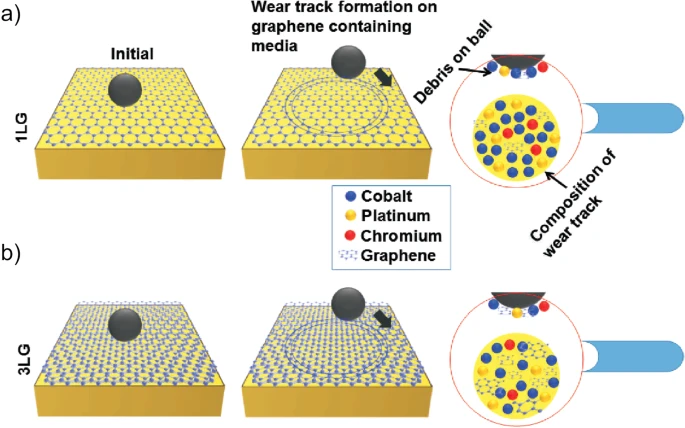
Interaction of counterface ball (sapphire) with (a) 1LG and (b) 3LG. The zoomed-in images represent 1LG and 3LG, and underlying substrate atoms (Co, Pt, Cr, etc.) on counterface ball and wear track, where the amount of C debris increases with N. The debris generated on both interacting bodies maintain the lower COF of 1–4LG with respect to BM.
The COF is estimated as the ratio of sliding and normal force, block averaged every 25 ps. Figure 10a–e compares the computed COF and surface disorder of Co∣Pt, 1LG, and 4LG. The surface disorder represents the friction-induced damage/wear of the HDM, and its value is derived considering 0% surface disorder before friction measurements. The amount of disorder in HDM is quantified using the centrosymmetry parameter, a measure of the local lattice disorder around an atom. This is 0 for a perfect lattice, whereas when a point defect exists, i.e., when the symmetry is broken, it assumes a larger positive value, see Supplementary Note 8 for details. The simulations indicate that BM develops substrate disorder up to ~14.5% within 350 ps (Fig. 10b, e).

Light green spheres indicate Co∣Pt, red and blue spheres indicate Al2O3. a Simulation setup for evaluating wear between Al2O3 and Co∣Pt. Simulations are performed for BM, 1, 4LG at 300 K, with materials sliding against each other at 1 m/s. b Interfacial surface atoms of bare Co∣Pt showing disorder. Two representative disorder regions are indicated by circles. c Structure of defected 1LG. d Structure of 4LG. The top two layers are attracted towards the Al2O3 block with the formation of sp3 cross-links. e Disorder of interfacial Co∣Pt surface using the centrosymmetry parameter.
High wear is also observed for BM in the experiments in Fig. 3a. An additional 250 ps where the forces on atoms are also collected are used to obtain the COF (Supplementary Fig. 5). The COF averaged over these 250 ps is ~0.82 ± 0.1. 1LG reduces the average simulated COF to ~0.18 ± 0.02. Figure 10c shows that 1LG maintains its structural integrity with fraction of disorder ~1% on average, as a consequence of the low COF between the blocks, indicating higher resistance to wear as compared to BM. 4LG further improves the tribological behavior. The COF drops slightly to ~0.14 ± 0.0.02 and substrate disorder is reduced to ~0.1%, much lower than in BM, suggesting that the BM surface remains mostly unaffected. Simulations suggest partial transfer of graphene patches to the sapphire ball. The Raman analysis of wear tracks in Figs. 5 and 6 shows tribo-induced disorder in 1–4LG transfer of C to the ball. Thus, the patches containing debris on both surfaces are responsible for the lower COF in 1–4LG-coated HDM, maintaining higher wear resistance than BM.
Reference 87 showed that potential corrugations on sliding surfaces can impact friction force and anisotropy of MLG. It reported that higher friction forces result from larger corrugations of the potential energy and depend on N. This is consistent with our experiments in Figs. 3 and 4, and simulations in Fig. 10.
In summary, we analyzed 1–4LG-coated media and found that they can overcome the tribological and corrosion issues of current Co-alloy-based HDM, with laser irradiation stability on FePt-based HDM for HAMR. The overall performance of graphene-coated media exceeds that of thicker commercial COC, as well as other amorphous carbons of comparable/higher thicknesses prepared by FCVA and sputtering. Given the tribological, corrosion, and thermal stability characteristics coupled with an AFM thickness ~4 times (for 1LG) to ~1.3 times (for 4LG) lower than state-of-the-art 2.7-nm COCs, we expect 1–4LG-based overcoats to meet the requirements for 4–10 Tb/in2 areal density HDDs, when employing suitable recording technologies, such as HAMR and HAMR+BPM. Graphene-coated media have better corrosion and wear resistance with a COF < 0.2. A single layer of graphene is enough to reduce corrosion ~2.5 times and can withstand HAMR conditions. Our results imply that >2LG-based coatings could be used as a tribological interface for various other materials/devices, such as micro- and nano-electromechanical systems.
Methods
Graphene growth and transfer
1LG is grown by CVD on a 35 μm Cu foil. The substrate is loaded into a hot wall tube furnace evacuated to ~1 mTorr. The Cu foil is annealed in hydrogen at 1000 °C for 30 min. This reduces the copper oxide surface and increases the Cu grain size. The growth process starts when 5 sccm CH4 is added to H2. After 30 min the substrate is cooled down for several hours in vacuum (~1 mTorr) to room temperature and unloaded.
We use a polymethyl methacrylate (PMMA)-based wet transfer52,53. First, ~500 nm PMMA is spin-coated on the sample. The PMMA/1LG/Cu stack is then placed in an aqueous solution of ammonium persulfate to etch Cu52. When Cu is fully etched, the graphene/PMMA-stack is placed into a de-ionized (DI) water bath to rinse any acid residuals and subsequently fished out using the HDM substrate. After drying for one day at room temperature, the sample is placed in acetone to remove PMMA, leaving 1LG on the HDM. By repeating the steps described above, several 1LGs are transferred to create an MLG stack. The same procedure is used to place 1LG and MLG onto FePt.
Data availability
All relevant data are available from the authors upon reasonable requests. Unique identifiers such as DOI and hyperlinks for any other data sets are also available from the authors upon reasonable request. Source data are provided with this paper.
Code availability
All relevant custom software is available from the authors upon reasonable request
Change history
02 June 2021
A Correction to this paper has been published: https://doi.org/10.1038/s41467-021-23869-4
References
Reinsel, D., Gantz, J. & Rydning, J. Data age 2025: The Evolution of Data to Life-Critical. IDC White Paper 1–25 (2017).
Furrer, S. et al. 201 Gb/in2 Recording areal density on sputtered magnetic tape. In Digest of 28th Magnetic Recording Conference 97–98 (2017).
Grochowski, E. & Goglia, P. Magnetic hard disk drive today’s technical status and future. https://www.snia.org/sites/default/files/SDC/2016/presentations/keynote_general/Grochowski-Goglia_Magnetic_Hard_Disk_Drive.pdf. (2016).
Statista Research Department. WW HDD market declining to 395 million units shipped in 2017-statista. Storage Newsletter. https://www.storagenewsletter.com/2017/10/10/ww-hdd-market-declining-to-395-million-units/-shipped-in-2017-statista/ (2017).
Nordrum, A. The fight for the future of the disk drive. IEEE Spectrum 56, 44–47 (2018).
Marchon, B. et al. The head-disk interface roadmap to an areal density of 4 Tbit/in2. Adv. Tribol. 2013, 521086 (2013).
Casiraghi, C., Ferrari, A. C., Ohr, R., Chu, D. & Robertson, J. Surface properties of ultra-thin tetrahedral amorphous carbon films for magnetic storage technology. J. Diam. Rel. Mats. 13, 1416–1421 (2004).
Casiraghi, C. et al. Ultra-thin carbon layer for high density magnetic storage devices. Diam. Rel. Mats. 13, 1480–1485 (2004).
Piazza, F. et al. Large area deposition of hydrogenated amorphous carbon films for optical storage disks. Diam. Rel. Mats. 13, 1505–1510 (2004).
Piazza, F. et al. Protective diamond-like carbon coatings for future optical storage disks. Diam. Rel. Mats. 14, 994–999 (2005).
Dwivedi, N. et al. Ultrathin carbon with interspersed graphene/fullerene-like nanostructures: a durable protective overcoat for high density magnetic storage. Sci. Rep. 5, 11607 (2015).
Rajauria, S., Canchi, S. V., Schreck, E. & Marchon, B. Nanoscale wear and kinetic friction between atomically smooth surfaces sliding at high speeds. Appl. Phys. Lett. 106, 081604 (2015).
Ferrari, A. C. Diamond-like carbon for magnetic storage disks. Surf. Coat. Technol. 180, 190–206 (2004).
Casiraghi, C., Robertson, J. & Ferrari, A. C. Diamond-like carbon for data and beer storage. Mater. Today 10, 44–53 (2007).
Dwivedi, N. et al. Understanding the role of nitrogen in plasma-assisted surface modification of magnetic recording media with and without ultrathin carbon overcoats. Sci. Rep. 5, 7772 (2015).
Casiraghi, C., Ferrari, A. C. & Robertson, J. The smoothness of tetrahedral amorphous carbon. Diam. Rel. Mats. 14, 913–920 (2005).
Moseler, M., Gumbsch, P., Casiraghi, C., Ferrari, A. C. & Robertson, J. The ultrasmoothness of diamond-like carbon surfaces. Science 309, 1545 (2005).
Pisana, S., Casiraghi, C., Ferrari, A. C. & Robertson, J. Roughness evolution during growth of hydrogenated tetrahedral amorphous carbon. Diam. Rel. Mats. 15, 898–903 (2006).
Casiraghi, C. et al. Dynamic roughening of tetrahedral amorphous carbon. Phys. Rev. Lett. 91, 226104 (2003).
Piramanayagam, S. N. Perpendicular recording media for hard disk drives. J. Appl. Phys. 102, 011301–22 (2007).
Plumer, M. L., van Ek, J. & Cain, W. C. New paradigms in magnetic recording. Phys. Canada 67, 25–29 (2011).
Weller, D. et al. FePt heat assisted magnetic recording media. J. Vac. Sci. Technol. B 34, 060801–10 (2016).
Weller, D. & Moser, A. Thermal effect limits in ultrahigh-density magnetic recording. IEEE Trans. Magn. 35, 4423–4439 (1999).
Kryder, M. H. et al. Heat assisted magnetic recording. Proc. IEEE 96, 1810–1835 (2008).
Challener, W. A. et al. Heat-assisted magnetic recording by a near-fieldtransducer with efficient optical energy transfer. Nat. Photonics 3, 220–224 (2009).
Vogler, C. et al. Noise mechanisms of heat-assisted-magnetic recording. J. Appl. Phys. 120, 153901 (2016).
Plumer, M. L., van Ek, J. and Weller, D. The Physics Of Ultrahigh Density Magnetic Recording 1–352 (2001).
Jones, P. M., Ahner, J., Platt, C. L., Tang, H. & Hohlfeld, J. Understanding Disk Carbon Loss Kinetics for Heat Assisted Magnetic Recording. IEEE Trans. Magn. 50, 3300704 (2014).
Ji, R., Ma, Y., Shakerzadeh, M., Seet, H. L. & Hu, J. F. Laser irradiation effect on carbon overcoat for HAMR application. Surf. Interface Anal. 46, 204–208 (2014).
Mangolini, F., Rose, F., Hilbert, J. & Carpick, R. W. Thermally induced evolution of hydrogenated amorphous carbon. Appl. Phys. Lett. 103, 161605 (2013).
Wang, N., Komvopoulos, K., Rose, F. & Marchon, B. Structural stability of hydrogenated amorphous carbon overcoats used in heat-assisted magnetic recording investigated by rapid thermal annealing. J. Appl. Phys. 113, 083517 (2013).
Pathem, B. K. et al. Carbon overcoat oxidation in heat-assisted magnetic recording. IEEE Trans. Magn. 49, 3721–3724 (2014).
Ferrari, A. C. et al. Stress reduction and bond stability during thermal annealing of tetrahedral amorphous carbon. J. Appl. Phys. 85, 7191–7197 (1999).
Teo, K. B. K. et al. Highest optical gap tetrahedral amorphous carbon. Diam. Rel. Mats. 11, 1086–1090 (2002).
Berman, D., Deshmukh, S. A., Subramanian, S. K. R. S., Erdemir, A. & Sumant, A. V. Friction. Macroscale superlubricity enabled by graphene nanoscroll formation. Science 348, 1118–1122 (2015).
Berman, D., Erdemir, A. & Sumant, A. V. Graphene: a new emerging lubricant. Mater. Today 17, 31–42 (2014).
Berman, D., Deshmukh, S. A., Subramanian, S. K. R. S., Erdemir, A. & Sumant, A. V. Extraordinary macroscale wear resistance of one atom thick graphene layer. Adv. Funct. Mater. 24, 6640–6646 (2014).
Berman, D., Erdemir, A. & Sumant, A. V. Graphene as a protective coating and superior lubricant for electrical contacts. Appl. Phys. Lett. 105, 231907 (2014).
Lee, C. et al. Frictional characteristics of atomically thin sheets. Science 328, 76–80 (2010).
Chen, S. et al. Oxidation resistance of graphene-coated Cu and Cu/Ni alloy. ACS Nano 5, 1321–1327 (2011).
Weatherup, R. S. et al. Long-term passivation of strongly interacting metals with single-layer graphene. J. Am. Chem. Soc. 137, 14358–14366 (2015).
Kravets, V. G. et al. Graphene-protected copper and silver plasmonics. Sci. Rep. 4, 5517 (2014).
Prasai, D., Tuberquia, J. C., Harl, R. R., Jennings, G. K. & Bolotin, K. I. Graphene: corrosion-inhibiting coating. ACS Nano 6, 1102–1108 (2012).
Su, Y. et al. Impermeable barrier films and protective coatings based on reduced graphene oxide. Nat. Commun. 5, 4843 (2014).
Kim, K. et al. High-temperature stability of suspended single-layer graphene. Phys. Stat. Solidi RRL 4, 302–304 (2010).
Balandin, A. A. et al. Superior thermal conductivity of single-layer graphene. Nano Lett. 8, 902–7 (2008).
De Fazio, D. et al. High-mobility, wet-transferred graphene grown by chemical vapor deposition. ACS Nano 13, 8926–8935 (2019).
Giambra, M. A. et al. Wafer-scale integration of graphene-based photonic devices. ACS Nano 15, 3171–3187 (2021).
Albrecht, T. R. et al. Bit-patterned magnetic recording: Theory, media fabrication, and recording performance. IEEE Trans. Magn. 51, 0800342 (2015).
Goohpattader, P. S. et al. Probing the role of C+ ion energy, thickness and graded structure on the functional and microstructural characteristics of ultrathin carbon films (<2 nm). Tribo. Int. 81, 73–88 (2015).
Dwivedi, N. et al. Enhanced characteristics of pulsed DC sputtered ultrathin (< 2 nm) amorphous carbon overcoats on hard disk magnetic media. Diam. Relat. Mater. 51, 14–23 (2015).
Bonaccorso, F. et al. Mater. Today 15, 564 (2012).
Bonaccorso, F., Sun, Z., Hasan, T. & Ferrari, A. C. Nat. Photonics 4, 611 (2010).
Ferrari, A. C. & Basko, D. M. Raman spectroscopy as a versatile tool for studying the properties of graphene. Nat. Nanotechnol. 8, 235–46 (2013).
Hussain, S., Bhatia, C. S., Yang, H. Y. & Danner, A. Characterization of C-apertures in a successful demonstration of heat-assisted magnetic recording. Opt. Lett. 40, 3444–3447 (2015).
Lagatsy, A. A. et al. 2 μ m solid-state laser mode-locked by single-layer graphene. Appl. Phys Lett. 102, 013113–1 (2013).
Cançado, L. G. et al. Quantifying defects in graphene via Raman spectroscopy at different excitation energies. Nano Lett. 11, 3190–6 (2011).
Ferrari, A. C. & Robertson, J. Interpretation of Raman spectra of disordered and amorphous carbon. Phys. Rev. B 61, 14095 (2000).
Bruna, M. et al. Doping dependence of the raman spectrum of defected graphene. ACS Nano 8, 7432–7441 (2014).
Ferrari, A. C. et al. Raman spectrum of graphene and graphene layers. Phys. Rev. Lett. 97, 187401 (2006).
Mohiuddin, T. M. G. et al. Uniaxial strain in graphene by Raman spectroscopy: G peak splitting, Gruneisen parameters and sample orientation. Phys. Rev. B 79, 205433 (2009).
Yoon, D., Son, Y.-W. & Cheong, H. Strain-dependent splitting of the double-resonance Raman scattering band in graphene. Phys. Rev. Lett. 106, 155502 (2011).
Rose, F. et al. Complete characterization by Raman spectroscopy of the structural properties of thin hydrogenated diamond-like carbon films exposed to rapid thermal annealing. J. Appl. Phys. 116, 123516 (2014).
Yang, H. et al. Significant Dzyaloshinskii-Moriya interaction at graphene-ferromagnet interfaces due to the Rashba effect. Nat. Mater. 17, 605 (2018).
Ono, T. et al. Addition of Ru to L10-FePt thin film to lower Curie temperature. Appl. Phys. Express 9, 123002 (2016).
Calizo, I., Balandin, A. A., Bao, W., Miao, F. & Lau, C. N. Temperature dependence of the Raman spectra of graphene and graphene multilayers. Nano Lett. 7, 2645–2649 (2007).
Erdemir, A. et al. Carbon-based tribofilms from lubricating oils. Nature 536, 67–71 (2016).
Prutton, M. & Gomati, M. M. El. Scanning Auger Electron Microscopy (2006).
White, W. B. & Minser, D. G. Raman spectra and structure of natural glasses. J. Non-Crystal. Solids 67, 45–59 (1984).
Gallant, D., Pezolet, M. & Simard, S. Optical and physical properties of cobalt oxide films electrogenerated in bicarbonate aqueous media. J. Phys. Chem. B 110, 6871–6880 (2006).
Hadjiev, V. G., Iliev, M. N. & Vergilov, I. V. The Raman spectra of Co3 O4. J. Phys. C 21, L199–L201 (1988).
Banerjee, I., Kim, H. K. D., Pisani, D., Mohanchandra, K. P. & Carman, G. P. Magnetic anisotropy and magnetodielectric coefficients in Cr2O3 and Fe0.4 Cr1.6O3. J. Alloys Compd 614, 305 (2014).
Rafiee, J. et al. Wetting transparency of graphene. Nat. Mater. 11, 217 (2012).
Kondo, H. Tribochemistry of Ionic Liquid Lubricant on Magnetic Media. Adv. Tribol. 2012, 526726 (2012).
Tomcik, B., Osipowicz, T. & Lee, J. Y. Diamond-like film as a corrosion protective layer on the hard disk. Thin Solid Films 360, 173–180 (2000).
Bowden, F. P. & Tabor, D. Mechanism of metallic friction. Nature 150, 197–199 (1942).
Krim, J. Resource Letter: FMMLS-1: Friction at macroscopic and microscopic length scales. Am. J. Phys. 70, 890 (2002).
Liu, X. et al. Mechanical properties of soft, electrodeposited Fe-Co-Ni films for magnetic recording heads. IEEE Trans. Magn. 38, 2231 (2002).
Riedl, A. et al. Tribological properties of Al2O3 hard coatings modified by mechanical blasting and polishing post-treatment. Wear 289, 9–16 (2012).
Rana, A. et al. Correlation of nanoscale behaviour of forces and macroscale surface wettability. Nanoscale 8, 15597–15603 (2016).
Li, S. et al. Nature 59, 541–545 (2016).
Li, Q., Lee, C., Carpick, R. W. & Hone, J. The evolving quality of frictional contact with graphene. Phys. Status Solidi B 247, 2909–2914 (2010).
Tan, P. H. et al. The shear mode of multilayer graphene. Nat. Mater. 11, 294–300 (2012).
Lee, C., Wei, X. D., Kysar, J. W. & Hone, J. Measurement of the elastic properties and intrinsic strength of monolayer graphene. Science 321, 385 (2008).
Berman, D., Erdemir, A. & Sumant, A. V. Few layer graphene to reduce wear and friction on sliding steel surfaces. Carbon 54, 454–459 (2013).
Marchetto, D., Feser, T. & Dienwiebel, M. Microscale study of frictional properties of graphene in ultra high vacuum. Friction 3, 161–169 (2015).
Zhuang, C. & Liu, L. Atomic-scale friction modulated by potential corrugation in multi-layered graphene materials. J. Appl. Phys. 117, 114302 (2015).
Acknowledgements
We acknowledge funding from the National Research Foundation, Prime Minister’s Office, Singapore under its Competitive Research Program (CRP Award No. NRF-CRP 4-2008-06), the EU Graphene Flagship, EU grant CareRAMM, ERC Grant Hetero2D, EPSRC Grants EP/K01711X/1, EP/ K017144/1, EP/N010345/1, EP/L016057/1, EU grant Neurofibres, the National Energy Research Scientific Computing Center, a DOE Office of Science User Facility, supported by the Office of Science of the U.S. Department of Energy under Contract No. DE-AC02-05CH11231, the Center for Nanoscale Materials by the U.S. Department of Energy, Office of Science, Office of Basic Energy Sciences, under Contract DE-AC02-06CH11357, the Exeter Time-Resolved Magnetism Facility (EXTREMAG, EPSRC Grant EP/R008809/1)
Author information
Authors and Affiliations
Contributions
A.C.F. and C.S.B. conceived the idea, designed the project and supervised the work. N.D. and T.D. prepared the media substrates. N.D. applied lubricant. A.K.O., C.D., U.S., D.D.F., O.B., S.S., J.Z., and A.K.K. prepared different sets of graphene containing samples. N.D. performed tribological measurements. A.K.O. performed Raman spectroscopy and AFM. A.K.O. and G.S. performed the irradiation measurements. A.K.O. and P.S.K. performed MOKE measurements. R.J.Y. performed corrosion measurements. K.S., B.N., and S.K.R.S.S. performed MD simulations. N.D., A.K.O., R.J.Y., K.S., and B.N. analyzed the results with inputs from A.K.S., S.K.R.S.S., A.C.F. N.D., A.K.O. C.S.B., and A.C.F. wrote the manuscript. All the authors critically reviewed the manuscript. N.D. and A.K.O. contributed equally to this work.
Corresponding author
Ethics declarations
Competing interests
The authors declare no competing interests
Additional information
Peer review information Nature Communications thanks Vinod Sangwan and the other anonymous reviewer(s) for their contribution to the peer review of this work.
Publisher’s note Springer Nature remains neutral with regard to jurisdictional claims in published maps and institutional affiliations.
Supplementary information
Source data
Rights and permissions
Open Access This article is licensed under a Creative Commons Attribution 4.0 International License, which permits use, sharing, adaptation, distribution and reproduction in any medium or format, as long as you give appropriate credit to the original author(s) and the source, provide a link to the Creative Commons license, and indicate if changes were made. The images or other third party material in this article are included in the article’s Creative Commons license, unless indicated otherwise in a credit line to the material. If material is not included in the article’s Creative Commons license and your intended use is not permitted by statutory regulation or exceeds the permitted use, you will need to obtain permission directly from the copyright holder. To view a copy of this license, visit http://creativecommons.org/licenses/by/4.0/.
About this article

Cite this article
Dwivedi, N., Ott, A.K., Sasikumar, K. et al. Graphene overcoats for ultra-high storage density magnetic media. Nat Commun 12, 2854 (2021). https://doi.org/10.1038/s41467-021-22687-y
Received:
Accepted:
Published:
DOI: https://doi.org/10.1038/s41467-021-22687-y
Comments
By submitting a comment you agree to abide by our Terms and Community Guidelines. If you find something abusive or that does not comply with our terms or guidelines please flag it as inappropriate.
