
Series Editors’ Note
We are pleased to add this typescript to the Bone Marrow Transplantation Statistics Series. We realize the term cubic splines may be a bit off-putting to some readers, but stay with us and don’t get lost in polynomial equations. What the authors describe is important conceptually and in practice. Have you ever tried to buy a new pair of hiking boots? Getting the correct fit is critical; shoes that are too small or too large will get you in big trouble! Now imagine if hiking shoes came in only 2 sizes, small and large, and your foot size was somewhere in between. You are in trouble. Sailing perhaps?
Transplant physicians are often interested in the association between two variables, say pre-transplant measurable residual disease (MRD) test state and an outcome, say cumulative incidence of relapse (CIR). We typically reduce the results of an MRD test to a binary, negative or positive, often defined by an arbitrary cut-point. However, MRD state is a continuous biological variable, and reducing it to a binary discards what may be important, useful data when we try to correlate it with CIR. Put otherwise, we may miss the trees from the forest.
Another way to look at splines is a technique to make smooth curves out of irregular data points. Consider, for example, trying to describe the surface of an egg. You could do it with a series of straight lines connecting points on the egg surface but a much better representation would be combining groups of points into curves and then combining the curves. To prove this try drawing an egg using the draw feature in Microsoft Powerpoint; you are making splines.
Gauthier and co-workers show us how to use cubic splines to get the maximum information from data points, which may, unkindly, not lend themselves to dichotomization or a best fit line. Please read on. We hope readers will find their typescript interesting and exciting, and that it will give them a new way to think about how to analyse data. And no, a spline is not a bunch of cactus spines.
Robert Peter Gale, Imperial College London, and Mei-Jie Zhang, Medical College of Wisconsin and CIBMTR.
It is quite common in clinical research, and in the field of hematopoietic cell transplantation (HCT) in particular, to explore the association and predictive ability of a continuous variable with an outcome. For example, one might wish to predict the occurrence of acute graft-versus-host disease (aGvHD) from the serum concentration of a specific cytokine or maybe the cell count of a newly discovered immune-cell subset. Or one might be interested in the association of post-HCT blood glucose with the risk of non-relapse mortality (NRM). In such situations, there are many ways to model the continuous variable of interest.
George Box is largely credited with the aphorism “all models are wrong, but some are useful” [1]. Indeed, we wish to stress that there is not a single model that is correct, rather that there will almost always be many that are useful. There are, however, similarly many models that are not nearly as useful as they will lead to poor predictions of outcome or fit to the observed data.
Among the more common approaches to modelling continuous data is dichotomising (e.g., biomarkerhigh versus biomarkerlow) or splitting the variable into several categories. Another common approach is to model the marker as a continuous variable but additionally imposing a linear relationship between the variable and (some function of) the outcome. However, these approaches carry relatively stringent assumptions (see below), and as a result can lead to loss of information. This information loss might impair the predictive ability of the model, or provide a poor fit of the association between the variable and the studied outcome, or damage both. We will try to convince the reader that, at a minimum, alternative modelling approaches should be explored.
The assumption attached to dichotomising a continuous variable into two (or more groups) is that all values of the variable being modelled falling into a common category have the exact same association with outcome. While this assumption maybe approximately true in some cases, it is likely rare that this would hold biologically. For example, if one is interested in modelling age and categorises as 40 and above vs. less than 40, this dichotomisation assumes that a 40-year old has the same association with outcome as, say, a 75-year old but a different association from, say, a 39-year old. It is difficult to imagine that in this example, or in similar scenarios, our assumption would hold true.
Another approach is to model a linear relationship between the continuous variable and outcome. The assumption attached to this modelling is that any change in the variable of a specified size is associated with the same change in outcome, regardless of where the variable “starts”. For example, if a model suggests that an increase in bilirubin of one unit leads to an increase in the odds of day-100 NRM of 30%, this change in odds is the same if bilirubin increases from 1.2 to 2.2 mg/dL or if bilirubin increases from 6.4 to 7.4 mg/dL. It is likely the case that this assumption of linearity would more often be approximately true than the assumption associated with dichotomising data. It is also likely, however, that there are many instances where this assumption would break down.
As a potential alternative to these modelling strategies (categorising a continuous variable or imposing the assumption of a linear association on a continuous variable), we advocate exploration of non-linear continuous associations. There are many ways to do this, but we shall focus on one possibility—restricted cubic splines [2,3,4,5]. As shown in Figs. 1a, b, a cubic spline is essentially a piecewise cubic polynomial, where the number of “pieces” is dictated by the number of windows used. Within each window is effectively a cubic polynomial, and these windows are defined by “knots”. The mathematics are a bit more complicated than simply fitting a cubic polynomial within each window, as further restrictions need to be imposed so that the spline is continuous (i.e., there is no gap in the spline curve) and “smooth” at each knot. To better understand this smoothing process, one can imagine trying to model the curved surface of an egg only using straight lines. Intuitively, a much better approach would be to bend or smooth these lines to follow more closely the curvature of the egg (Fig. 2). A restricted cubic spline has the additional property that the curve is linear before the first knot and after the last knot. The number of knots used in the spline is determined by the user, but in practice we have found that generally five or fewer knots are sufficient. The location of the knots also needs to be specified by the user, but it is common that the knot with the smallest value is relatively close to the smallest value of the variable being modelled (e.g., the 5th percentile), while the largest knot is in the neighbourhood of the largest value of the variable being modelled (e.g., the 95th percentile).

a Black dots: “observed” data points (n = 200). Blue lines: linear regression lines (left of the 5th percentile and right of the 95th percentile) and cubic polynomials within windows (5th–25th, 25th–50th, 50th–75th, and 75th–95th percentiles; vertical grey lines). b Black dots: “observed” data points (n = 200). Blue line: restricted cubic spline regression line with five knots located at the 5th, 25th, 50th, 75th, and 95th percentiles (vertical grey lines) (colour figure online)

Modelling non-linear shapes: example of the surface of an egg
Consider the scatter plot shown in Fig. 1a, with five knots included along the x-axis (at the 5th, 25th, 50th, 75th, and 95th percentiles) and the resulting windows. Within the first and last windows is a simple least-squares regression line fitting the data. Within each of the interior windows is a cubic polynomial fit to the data. But recall that the cubic spline requires the curve to be continuous and smooth at the knots, so after imposing this condition we get the restricted cubic spline shown in Fig. 1b.
A cubic spline with k knots will have k components—one constant value (the y-intercept), one component that is linear in the variable being modelled (the x-value), and k-2 non-linear (cubic) components in the modelled variable. In other words, in equation form, y (the outcome) and x (the modelled variable) are associated as
where Ci(x) is the cubic component that falls in the ith window, and g is a so-called link function (for example, for logistic regression g is the “logit” (see below) of the probability of outcome, and for Cox regression g is the so-called log-log transformation of the survivor function).
We can take this idea of a cubic spline to the regression setting, where one assumes that some function of outcome, y, is associated with a continuous variable, x, via the equation specified above. As in any regression setting, the data on outcome and the corresponding value of the covariate for each subject are then used to estimate the coefficients (β0 and the βi’s) that best fit the observed data. If one is further interested in testing the hypothesis that the modelled association is linear, this can be done by testing that the coefficients associated with the non-linear components are equal to zero. If we fail to reject this null hypothesis, we might surmise that the association between outcome and the modelled covariate is approximately linear and such a model might be perfectly appropriate as the more complex non-linear components do not add significant information. If we reject this null hypothesis, however, we conclude that a non-linear association better describes the data than does a linear association.
Let us consider a few examples, some from simulated data (where we know the true underlying association between a variable and an outcome), and others from real data (where we do not know the true underlying association).
Example 1, Simulated data
Consider a fictitious biomarker (fictitin-1) that is associated with the probability of aGvHD after allogeneic HCT (allo-HCT). We assume a non-linear relationship between fictitin-1 and the risk of aGvHD. Technically, we assume a non-linear relationship between fictitin-1 and a function of the probability of aGvHD, the so-called logit of aGvHD, or the log of the odds of aGvHD, but visually we will use the probability rather than the logit. This assumed-true relationship is shown in the solid blue line depicted in Fig. 3. We randomly generate a value of fictitin-1 from a specified distribution of fictitin-1 values, and for each value calculate the corresponding probability of aGvHD based on the assumed-true association. If this is done n times, we have a simulated data set consisting of n patients, each simulated patient having a fictitin-1 value and either having or not having aGvHD. From these “observed” data, we can fit a logistic regression model by modelling the fictitin-1 value in any way that is desired. If we repeat this process m times (say, m = 1000 times), we can then take the average of the regression coefficients estimated in each simulated data set (n patients), and use these to plot the “average” association under the model that is used to describe the association between fictitin-1 and the risk of aGvHD. We consider three different ways to model fictitin-1: (1) dichotomising fictitin-1 into two groups (e.g., at the median, Fig. 3a); (2) categorising fictitin-1 into four groups (e.g., quartiles, Fig. 3b); and (3) modelling fictitin-1 as a restricted cubic spline (Fig. 3c).
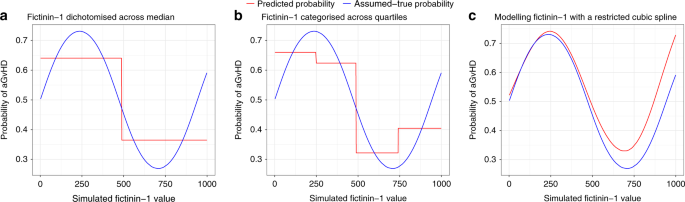
Red line: fitted probabilities of a GvHD obtained from a logistic regression model (average of 1000 simulations). Blue line: assumed-true association between fictitin-1 and the probability of a GvHD. c Fictinin-1 was modelled using a restricted cubic spline function with five knots placed at the 5th, 25th, 50th, 75th, and 95th percentiles. (colour figure online)
First, we can appreciate visually that only two or four probabilities can be predicted using the models splitting fictinin-1 across its median (Fig. 3a) or quartiles (Fig. 3b). In contrast, leaving the variable as continuous allows making (potentially unique) predictions for any value of fictitin-1 (Fig. 3c). In other words, categorising fictitin-1 led to loss of information. Second, our predictions (the fitted model shown in red in Fig. 3) tend to be further from the “truth” (the assumed-true probabilities of aGVHD, depicted in blue in Fig. 3) after categorisation, reflected by the red line (our predictions) not overlapping with the blue line (the assumed-true relationship). In summary, when we modelled fictitin-1 using the restricted cubic spline, our predictions were much closer to the assumed-true probabilities (Fig. 3c).
Example 2, Real data
While it is never possible to capture the exact nature of the relationship between a variable and an outcome in the real world, some modelling tools maybe better than others at describing this relationship. Using a dataset of 589 patients who underwent an allo-HCT at our institution we will compare different ways of modelling a continuous predictor (in this case the serum glucose concentration measured at day 30 after allo-HCT). Here we are interested in predicting the risk of day 200 NRM after allo-HCT among patients who survive without relapse to day 30 post-HCT. Since our outcome is specified by day 200 and all patients have complete follow-up by this time, we will use logistic regression for this example as was done above. Similar to our previous example, we consider three different ways to model glucose concentration: (1) dichotomising glucose into two groups (at the median); (2) categorising glucose into four groups (across quartiles); (3) modelling glucose as a restricted cubic spline. Next, we graph the predicted probability of day 200 NRM using these three models (Fig. 4).

Solid line, predicted probabilities of day 200 NRM; shaded areas, 95% confidence intervals. c The day 30 serum glucose concentration was modelled using a restricted cubic spline function with five knots placed at the 5th, 25th, 50th, 75th, and 95th percentiles
We again visualise the loss of information associated with categorising the glucose variable across its median (Fig. 4a) or quartiles (Fig. 4b). Modelling glucose with the restricted cubic spline suggests a strongly non-linear relationship between glucose and NRM and allows potentially unique predictions for any glucose concentration. As expected, extreme values (both very low and very high) are associated with an increase in the risk of NRM, while a lower risk is predicted for intermediate values (Fig. 4c). At odds with human physiology, the models categorising glucose predicted lower NRM for very low concentrations of glucose. More consistent with medical knowledge, an increase in the risk of NRM is predicted by the model using the restricted cubic spline for very low concentrations of glucose. In this example, restricted cubic splines helped us model a complex, non-linear relationship between glucose concentration and the risk of NRM.
In both the simulated and real data examples above, we utilised logistic regression for illustrative purposes, where the y-axis represents the probability of the outcome under study (acute GVHD in the first, day 200 NRM in the second). One could similarly plot on the y-axis the logit of the probability of failure, or additionally one could plot on the y-axis the odds ratio of failure relative to a particular value of the parameter being modelled. Many outcomes in HCT, however, are modelled as time-to-event endpoints with censored observations contributing to the observed data. In such cases, Cox proportional-hazards models are often fit, allowing for appropriate consideration of censored observations. Cubic splines, or any other method of modelling continuous data as a non-linear function, can also be used in the time-to-event setting in a manner similar to that in the setting of binary outcomes. In fact, these methods can be used in any regression setting. In the case of Cox regression, plots similar to those for logistic regression can be generated, with the y-axis representing the modelled probability of failure at a particular time or the hazard ratio of failure relative to a particular value of the parameter being modelled.
Restricted cubic splines are not devoid of limitations. In some situations, the use of a large number of knots may lead to “overfitting” the data—a phenomenon where the fit of the model corresponds too closely to the observed data, and may therefore fail to provide adequate fit to additional data or predict future observations reliably. In other words, the model may fit “noise” more than “signal”. However, this problem can be managed by evaluating different statistical metrics that are beyond the scope of this editorial. Moreover, the concept of overfitting is not, of course, unique to cubic splines. In general, “good regression” practices should be applied with or without the use of restricted cubic splines. We also note that while splines may use more degrees of freedom (the number of parameters that require estimation in a regression model) than a categorical model, a three-knot spline uses three degrees of freedom, as does a quartile model. The fit or predictive ability of cubic splines in the “tails” of the distribution of the variable being modelled can also deteriorate, this due to sparcity of data. But this is not an issue with splines, per se, rather a problem that exists with any sort of modelling.
Clinicians frequently use cutpoints or threshold values to help the decision-making process. Despite their prominence in the field of medicine, their usefulness remains controversial [6]. Cutpoints generally fit only to the currently observed data and therefore rarely replicate across independent studies or data sets. As we have just demonstrated, cutpoints result in the categorisation of a continuous predictor that can be detrimental to risk prediction. That said, there maybe situations in which categorisation of a continuous variable could be helpful. For example, if a particular biomarker has been identified as being important for an outcome and a clinical trial is proposed to target this biomarker, it might be of value to restrict enrolment to patients who have a “high” level of this biomarker. Categorisation also lends itself to visual presentation of the data that are more natural and familiar to most readers, or an outcome could be based on a particular variable falling within a prescribed window. In any event, we caution the reader to carefully consider the ramifications of categorisation of a continuous variable if, indeed, such categorisation occurs.
In conclusion, restricted cubic splines are a flexible tool to model complex, non-linear relationships between a continuous variable and an outcome. In general, categorising continuous variables will lead to loss of information and poor predictions (particularly if splitting into only two groups), and this approach should be avoided in most settings [7, 8], or at minimum used with caution. When faced with continuous data, we recommend the exploration of non-linear associations between the continuous variable being modelled and outcome and we argue that a useful method for such exploration is the use of restricted cubic splines. This approach can be implemented with many statistical software programmes currently available (e.g., R software, “rms” and “splines” package; SAS software). A Shiny web application (https://drjgauthier.shinyapps.io/spliny/) is also offered, allowing interactive visualisations of the use of restricted cubic splines in logistic regression. This app models various non-linear relationships and compares predictions between a conventional logistic regression model and a model using a restricted cubic spline.
Change history
03 May 2023
A Correction to this paper has been published: https://doi.org/10.1038/s41409-023-01993-7
References
Box GEP. Robustness in Statistics. Academic Press; 1979. p. 201–36. https://doi.org/10.1016/b978-0-12-438150-6.50018-2
Stone CGKCY. Additive splines in statistics. In: Proceedings of the American Statistical Association; 1985. p. 45–8.
Devlin TF. Spline functions for logistic regression modelling. In: Proceedings of the 11th Annual SAS Users Group International Conference; 1986. p. 646–51.
Harrell JFE. Regression modeling strategies. Springer; 2015. https://doi.org/10.1007/978-3-319-19425-7.
Heinzl H, Kaider A. Gaining more flexibility in Cox proportional hazards regression models with cubic spline functions. Comput Methods Prog Biomed. 1997;54:201–8. https://doi.org/10.1016/s0169-2607(97)00043-6.
Altman DG, Lausen B, Sauerbrei W, Schumacher M. Dangers of using “Optimal” cutpoints in the evaluation of prognostic factors. JNCI J Natl Cancer Inst. 1994;86:829–35. https://doi.org/10.1093/jnci/86.11.829.
Royston P, Altman DG, Sauerbrei W. Dichotomizing continuous predictors in multiple regression: a bad idea. Stat Med. 2006;25:127–41. https://doi.org/10.1002/sim.2331.
Altman DG, Royston P. The cost of dichotomising continuous variables. Br Med J. 2006;332:1080 https://doi.org/10.1136/bmj.332.7549.1080.
Author information
Authors and Affiliations
Corresponding author
Ethics declarations
Conflict of interest
The authors declare that they have no conflict of interest.
Additional information
Publisher’s note Springer Nature remains neutral with regard to jurisdictional claims in published maps and institutional affiliations.
The original online version of this article was revised: The legend of Fig. 1 has been corrected.
Rights and permissions
About this article

Cite this article
Gauthier, J., Wu, Q.V. & Gooley, T.A. Cubic splines to model relationships between continuous variables and outcomes: a guide for clinicians. Bone Marrow Transplant 55, 675–680 (2020). https://doi.org/10.1038/s41409-019-0679-x
Received:
Accepted:
Published:
Issue Date:
DOI: https://doi.org/10.1038/s41409-019-0679-x
This article is cited by
-
Reproductive factors and risk of cardiovascular diseases and all-cause and cardiovascular mortality in American women: NHANES 2003–2018
BMC Women's Health (2024)
-
Assessing dynamical resilience indicators in older adults: a prospective feasibility cohort study
European Geriatric Medicine (2024)
-
Risk analysis of air pollutants and types of anemia: a UK Biobank prospective cohort study
International Journal of Biometeorology (2024)
-
Association between prolonged corticosteroids use in COVID-19 and increased mortality in hospitalized patients: a retrospective study with inverse probability of treatment weighting analysis
Critical Care (2023)
-
Frequency-based rare diagnoses as a novel and accessible approach for studying rare diseases in large datasets: a cross-sectional study
BMC Medical Research Methodology (2023)
