
Abstract
Background
Our understanding of the normative concentrations of urine biomarkers in premature neonates is limited.
Methods
We evaluated urine from 750 extremely low gestational age (GA) neonates without severe acute kidney injury (AKI) to determine how GA affects ten different urine biomarkers at birth and over the first 30 postnatal days. Then, we investigated if the urine biomarkers changed over time at 27, 30, and 34 weeks postmenstrual age (PMA). Next, we evaluated the impact of sex on urine biomarker concentrations at birth and over time. Finally, we evaluated if urine biomarkers were impacted by treatment with erythropoietin (Epo).
Results
We found that all ten biomarker concentrations differ at birth by GA and that some urine biomarker concentrations increase, while others decrease over time. At 27 weeks PMA, 7/10 urine biomarkers differed by GA. By 30 weeks PMA, 5/10 differed, and by 34 weeks PMA, only osteopontin differed by GA. About half of the biomarker concentrations differed by sex, and 4/10 showed different rates of change over time between males vs. females. We found no differences in urine biomarkers by treatment group.
Conclusions
The temporal patterns, GA, and sex differences need to be considered in urine AKI biomarker analyses.
Impact
-
Urine biomarker concentrations differ by GA at birth.
-
Some urine biomarkers increase, while others decrease, over the first 30 postnatal days.
-
Most urine biomarkers differ by GA at 27 weeks PMA, but are similar by 34 weeks PMA.
-
Some urine biomarkers vary by sex in premature neonates.
-
Urine biomarkers did not differ between neonates randomized to placebo vs. Epo.
Introduction
Neonatal acute kidney injury (AKI) is common and negatively impacts survival1,2,3,4 in critically ill neonates, yet the current diagnostic approach using serum creatinine and urine output is challenging in premature neonates.5,6,7,8 Studies in premature infants suggest that certain urine biomarkers can predict who will develop AKI,9,10,11,12,13,14,15,16 mortality,15,17 and chronic lung disease.18,19 Urine biomarkers may provide a noninvasive way to diagnose kidney disease early in the disease process, clarify the underlying cause of AKI, and identify patients who may most benefit from therapeutic intervention, which can improve the care of neonates at risk for kidney-related disease. In addition, urine biomarker concentrations and patterns over time may inform developmental and pathobiological pathways.
A clear understanding of normal urine biomarker concentrations and urine biomarker/creatinine (Cr) ratios is needed. Specifically, understanding how these biomarkers differ at birth and over time by gestational age (GA) and sex is important. Furthermore, understanding whether these biomarkers “normalize” at different developmental timepoints is needed before we can apply them to clinical practice. Using small single-center cohorts, we and others have shown that urine biomarker concentrations vary by GA in the first postnatal week.20,21,22,23 Sex impacts the normative concentrations of some, but not all, urine biomarker concentrations in premature8,23 and term neonates.24 A more detailed evaluation using larger sample sizes over a longer period of time is needed to understand how differences in the degree of prematurity affect urine biomarker concentrations over chronological time and over time from conception. The term postmenstrual age (PMA) is used to define time from conception (GA plus chronological age). The changes in urine biomarkers as a function of PMA in premature neonates have been reported for oxytocin25 and coproporphyrin,26 but not for urine candidate AKI biomarkers.
We evaluated ten urine biomarkers and their respective urine biomarker/Cr ratios from birth to 30 days in 750 extremely low GA neonates (24–27 6/7 weeks GA) without severe AKI to understand how the degree of prematurity, sex, chronological time, developmental time, and erythropoietin (Epo) impact urine biomarker values. We evaluated the following urine biomarkers: albumin, beta-2-microglobulin (B2M), cystatin C, epithelial growth factor (EGF), neutrophil gelatinase-associated lipocalin (NGAL), osteopontin (OPN), and uromodulin (UMOD), kidney injury molecule-1 (KIM-1), clusterin, and alpha-glutathione-S-transferase (αGST). Our research questions include:
-
1.
Do urine biomarker concentrations and biomarker/Cr ratios differ by GA at birth? Do the temporal patterns differ by GA over the first 30 postnatal days?
-
2.
Do urine biomarker concentrations and urine biomarker/Cr ratio differ at 27, 30, and 34 weeks PMA by GA?
-
3.
Do urine biomarker concentrations and biomarker/Cr ratios differ by sex at birth? Do the temporal patterns differ by sex over the first 30 postnatal days?
-
4.
Do urine biomarker concentrations differ in those randomized to Epo vs. placebo at birth? Do the temporal patterns differ by Epo Status over the first 30 postnatal days?
Methods
Patient population
The Preterm Erythropoietin Neuroprotection Trial (PENUT) is a randomized, placebo-controlled, double-blind clinical trial of recombinant Epo in 24–28 weeks of GA neonates performed across 19 academic centers and comprised of 30 NICUs across 13 states in the United States from December 2013 to September 2016. PENUT screened 3366 neonates, of whom 941 were enrolled in the study. Of those who met the inclusion/exclusion criteria, the main reason for exclusion from PENUT included parents uninterested, research team unavailable, participation in a competing study, and died before screening. The description of randomization, reasons for non-enrollment, and the neurocognitive and kidney-related outcomes for this randomized trial have been described in detail elsewhere.27,28
Of the 941 subjects enrolled in the study, 750 met the inclusion/exclusion criteria for the current analysis. The reasons for exclusion are outlined in Fig. 1 (4 were not randomized, 1 was ineligible, 13 died within 2 days of birth, 7 did not have urine biomarkers collected, and 166 had at least one episode of severe AKI, defined as a doubling of serum Cr from baseline according to stage 2 or 3 of the neonatal KDIGO AKI definition at any point in the NICU stay).4,29 Subjects with severe AKI were excluded a priori as this analysis is designed to evaluate the effect of GA, time, and sex on biomarker levels, and elimination of those with severe AKI is necessary given that severe AKI causes sharp changes in the concentration of urine biomarkers. We chose to keep those with stage 1 AKI as we and others have shown that a small rise in serum Cr (SCr) of 0.3 mg/dL is extremely common in extremely low GA neonates, as they establish a steady-state SCr in the first days after birth,30,31 and may not represent true kidney damage/injury.

Demarcation of the reasons for exclusion from the analysis.
We use the term GA as the number of weeks and days from conception, postnatal age as the time elapsed after birth, and PMA to define time from conception (GA plus chronological age) as previously described.32 Day of birth is defined as day 0.
Urine collection and analysis
We collected urine using a cotton ball in the diaper. As this was an ancillary proposal to an existing study, the collection of urine was not mandatory, although sites were encouraged to get the urine at postnatal days 1, 3, 5, 7, 9, 14, 21, and 28 and at 30 and 34 weeks PMA. Of the 750 subjects, urine was collected in 679 (days 0 and 1), 242 (days 2 and 3), 374 (days 4 and 5), 484 (days 6 and 7), 202 (days 8 and 9), 623 (days 13–15), 540 (days 20–22), and 519 (days 27–29). Urine was available for 689 at 27 weeks PMA, 492 at 30 weeks PMA, and 325 at 34 weeks PMA.
Urine was frozen at the individual sites and remained in a −70 °C freezer (and under dry ice during shipment) until analysis. We chose urine biomarkers that have been reported in the literature as plausible biomarkers of AKI.10,33,34 Urine was analyzed at the University of Alabama at Birmingham on multianalyte electrochemiluminescent with a Meso QuickPlex SQ120 multiplexing imager (Meso Scale Discovery (MSD), Gaithersburg, MD). Albumin, B2M, cystatin C, EGF, NGAL, OPN, and UMOD were measured with MSD Human Kidney Injury Panel 5. Urine was diluted 500-fold before being added to plates. Urine KIM-1, clusterin, and αGST were assayed with an MSD custom 3-plex assay and were diluted 10-fold before being added to plates. Samples were prepared as per the manufacturer’s protocol and analyzed on the multiplexing imager. Samples were run in duplicate, and the average concentration was used for reporting. The coefficient of variation (% CV) for nine of the ten biomarker concentrations was excellent with a range from 0.47 to 5.6%. The %CV for B2M was poor at 29.6% (likely because 41% of the samples were higher than the upper level of detection on the standard curve). Urine Cr was measured using tandem mass spectroscopy (UAB O’Brien Core Center for Acute Kidney Injury Research) (% CV = 3.8%). We assigned a concentration as the lower detection concentration/2 for results lower than the lowest detection limit. We assigned a concentration as the average of the highest detected concentration and the detection limit for results that were higher than the highest limit of detection.
Statistical analyses
The cohort is divided into four GA groups (24, 25, 26, and 27 weeks). Baseline demographic data by the GA group are shown in Table 1. We rounded down to the nearest GA week (e.g., neonates who had a GA of 24 weeks + 0–6 days are categorized as 24 weeks). Continuous demographic variables are compared between GA groups using means and standard deviations (SDs). Categorical variables are reported as the total number and percentage.
Biomarker concentrations are reported as pg/mL for consistency, noting that some of the biomarker values will be represented as value times 1 × 10x pg/mL. Urine Cr is reported as mg/dL. The urine biomarker/Cr ratios (pg/mL divided by mg/dL) are reported as a unitless term multiplied by a coefficient of 1 × 10⁻⁷. When comparing biomarker concentration differences between groups, we transformed the biomarker data to log10 values to account for skewness in the data. We transformed to the original scale to present results. Figures are presented on log10 scale. For each biomarker we performed the following analyses:
-
(A)
Differences between biomarkers at birth and % changes per week by GA (Table 2and Fig. 2): To evaluate differences in biomarker concentrations among GA groups, we use linear regression models with generalized estimating equations (GEE) to account for the potential within sibship correlation.35 The GEE models include GA, time, GA × time interaction, and account for mother as a clustering variable. For each biomarker and biomarker/Cr ratio, we used the following mean model: β0 + βDAY DAY + βGA25 1 (GA = 25) + βGA26 1 (GA = 26) + βGA27 1 (GA = 27) + βDAY × GA25 DAY × 1 (GA = 25) + βDAY × GA26 DAY × 1 (GA = 26) + βDAY × GA27 DAY × 1 (GA = 27). Table 2 shows, based on testing the GA indicators, whether the predicted concentration differs at birth (intercept), and whether the concentrations differ in their rate of change over time (slope) based on testing for group-by-time interactions. Similar reports and analyses are performed for urine biomarker/Cr ratios. Figure 2 shows the urine biomarker concentration using a 7-day rolling mean (day X ± 3 days) on a log10 scale for each of the four GA groups.
Table 2 Predicted mean (SD) biomarker and biomarker/Cr at birth and slope for % change per week by GA. Fig. 2: Differences in urine biomarkers over chronological time by GA groups. 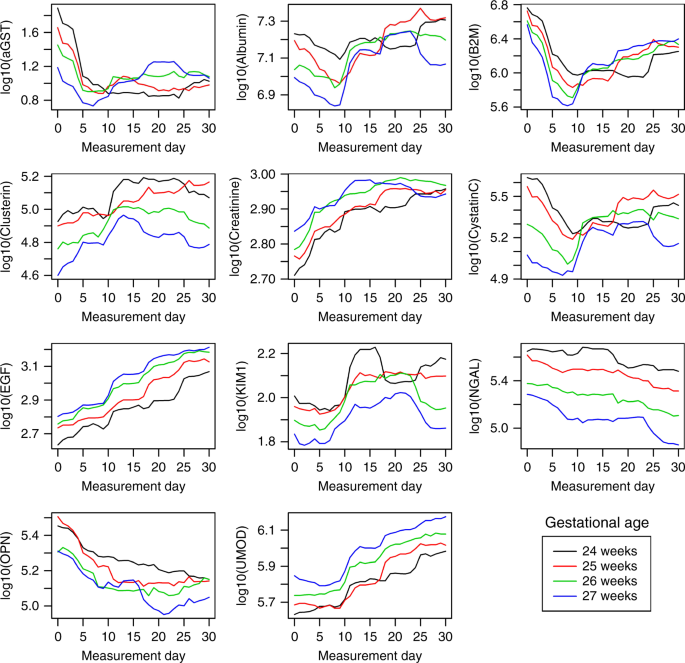
Mean log-10 urine biomarker concentrations over chronological time in the 4 gestational age groups (24, 25, 26 and 27 weeks). All biomarkers were different at birth by GA. The rate of change over time was different for aGST, albumin, B2m, cystatin c, and OPN.
-
(B)
Differences in biomarker concentrations and biomarker/Cr ratios by PMA: Table 3 shows the means (95% CI) for the ten biomarkers and creatinine at 27, 30, and 34 weeks PMA for the four groups, and the mean (95% CI) for the ten biomarkers/Cr ratios. To evaluate differences between biomarkers by GA groups, we again use linear regression models with GEE to account for within sibship correlation. The GEE models include GA at birth, time measured in PMA, and accounts for mother as a clustering variable. For each biomarker we used the following mean model: β0 + βPMA PMA + βGA25 1 (GA = 25) + βGA26 1 (GA = 26) + βGA27 1 (GA = 27) + βPMA × GA25 PMA × 1 (GA = 25) + βPMA × GA26 PMA × 1 (GA = 26) + βPMA × GA27 PMA × (GA = 27). We evaluated for significant differences in the following:
-
a.
Differences in biomarker concentration over time anchored to PMA for each of the four GA groups’ biomarker = β0 + βGA25 1 (GA = 25) + βGA26 1 (GA = 26) + βGA27 1 (GA = 27) (p values reported in rows in Table 3).
-
b.
Differences in the biomarkers by GA group (columns in Table 3) at each of the three timepoints (27, 30, and 34 weeks PMA) based on linear model β0 + βPMA PMA (p values reported in columns in Table 3).
-
a.

Similar analyses for urine biomarker/Cr ratio are presented in Table 3. Figure 3 shows the median (IQR) urine biomarkers on a log10 scale at 27, 30, and 34 weeks (±3 days) PMA, for each of the four groups (24, 25, 26, and 27 weeks GA).

Median (IQR) log 10 urine biomarker at 3 unique timepoints (27, 30 and 34 weeks post-menstrual age. At 27 weeks PMA, albumin, B2M, clusterin, creatinine, cystatin c, Kim-1, NGAL differed by GA group. At 30 weeks PMA, clusterin, EGF, KIM-1, NGAL, and OPN differed by GA group. At 34 weeks only OPN differed by GA groups.
-
(C)
Differences between biomarkers at birth and % changes per week by GA sex: To evaluate differences in biomarker concentrations over time by sex, we use linear regression models with GEE including sex, time, a sex × time interaction, and accounting for mother as a clustering variable. Predicted values for each biomarker were obtained for each GA at birth (time = 0). Table 4 shows the means and confidence interval (CI) for the urine biomarker concentrations at birth (intercept) and reports differences in the concentrations over time (slope) by sex testing the sex-by-time interaction. Similar analyses are shown in Table 4 for urine biomarker/Cr ratios. Figure 4 shows mean urine biomarkers concentrations using a 7-day rolling mean (day X ± 3 days) on a log10 scale by sex.
Table 4 Predicted mean (SD) biomarker and biomarker/Cr at birth and slope for % change per week by gender. Fig. 4: Differences in urine biomarkers over chronological time by sex. 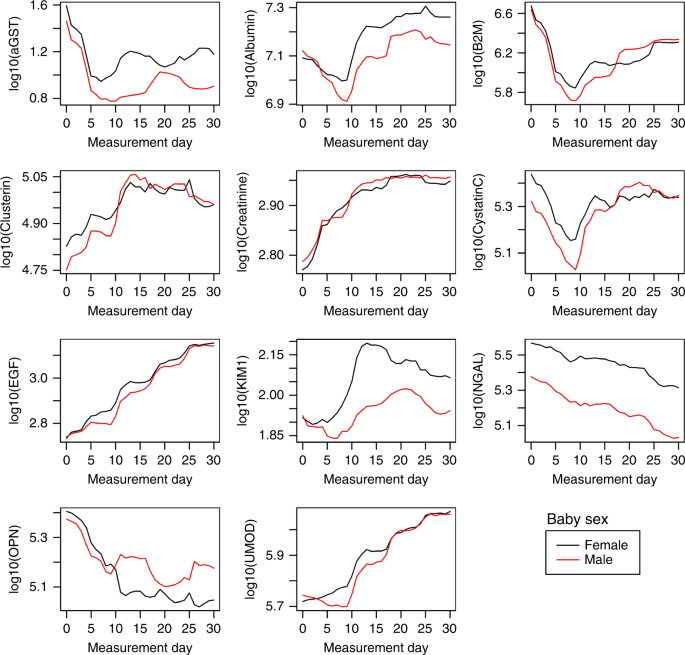
Mean log-10 urine biomarker concentrations over chronological time in the 4 gestational age groups (24, 25, 26 and 27 weeks). At birth, aGST, B2M, clusterin, cystatin c, Kim-1, NGAL differed by sex. The rate of change over time differed by sex for albumin, B2M, cystatin C, and OPN.
-
(D)
Differences between biomarkers at birth and % changes per week by randomized group (placebo vs. Epo): To evaluate differences in biomarker concentrations by treatment group, we use linear regression models with GEE including group, time, a group × time interaction and accounting for mother as a clustering variable. Predicted values for each biomarker were obtained for the Epo and placebo group at birth (time = 0). Table 6 shows the means and CI for the urine biomarker concentrations at birth (intercept) and reports differences in the concentrations over time (slope) by group testing the sex-by-time interaction.

Data management and analysis were conducted using R version 5.3.1 (R Foundation for Statistical Computing, Vienna, Austria). A p value < 0.05 was considered statistically significant. The University of Washington Institutional Review Board (IRB) approved this collaborative study, and each center received approval from its respective IRBs.
Results
Seven hundred and fifty neonates met the criteria for study inclusion; 163, 188, 187, and 212 were categorized in the 24-, 25-, 26-, and 27-week GA groups, respectively. Approximately half (N = 380) were male and a half (N = 370) were females. Demographic characteristics for the 750 subjects by GA groups are outlined in Table 1a. Demographic characteristics for the 750 subjects by sex are outlined in Table 1b.
Tables 2–5 and Figs. 2–4 provide information about each of the stated hypotheses for each biomarker and each biomarker/Cr ratio. We provide a summary of the analysis for each of the biomarkers in Table 6.
As no statistical differences in biomarker values were found between those randomized to Epo vs. placebo, we do not provide these in the summary paragraphs below and instead refer the reader to Table 5. The correlation between biomarker concentrations is shown in Fig. 5.

Correlation between the 10 biomarkers and one another.
We summarize the key findings for the hypotheses one biomarker and biomarker/Cr ratios at a time, presented in alphabetical order
αGST
Figure 2 shows the log10 mean urine αGST concentration over the first 30 postnatal days. Table 2 shows that at birth the mean αGST in those born at 24 weeks GA was equal to 25.9 (20.4, 33.0). The value at birth sequentially decreased to a mean of 8.64 (7.07, 10.6) among neonates born at 27 weeks GA. In addition, the % change over time decreased with increasing GA (rate of change for the 24-, 25-, and 26-week GA groups, respectively). The % change over time increased in those who were 27 weeks GA at birth (p < 0.001). Similar findings were seen for αGST/Cr ratios.
Next, a report of the urine αGST concentrations, αGST/Cr ratios, and an assessment of whether these values converged at the 27, 30, and 34 weeks PMA timepoints was performed. Table 3 and Fig. 3 show the αGST concentrations, and αGST/Cr ratios were not statistically significantly different at 27, 30, and 34 weeks timepoints.
Finally, Fig. 4 and Table 4 show that while mean (SD) of αGST at birth was lower in males than in females (13.5 (11.6, 15.8) vs. 19.8 (16.8, 23.3); p < 0.001), the rate of decline did not differ over the first 30 days between males and females. Similar findings were seen for the mean αGST/Cr ratio.
Albumin
Figure 2 shows the log10 mean urine albumin concentrations over the first 30 postnatal days by GA. At birth, the mean (SD) albumin concentrations were highest in the 24-week GA group, which decreased steadily with increasing GA (p < 0.001). In addition, the rate of change in albumin increased systematically across GA groups with a small and statistically significant increase by increasing GA (p < 0.001). Similar findings were seen for urine albumin/Cr ratio by GA at birth and over time.
Next, a report on whether the urine albumin and albumin/Cr concentrations converged at the 27-, 30-, and 34-week PMA timepoints. Figure 3 shows the log10 mean albumin concentration over time. Table 3 shows that the albumin (p < 0.001) and albumin/Cr differed at the 27-week PMA timepoint, but not at the 30- and 34-week timepoints.
Finally, Fig. 4 and Table 4 show that albumin and albumin/Cr ratios were similar at birth between males and females. However, although the rate of change increased for both males and females, the rate of change was higher for males (p < 0.05). Similar findings were seen for albumin/Cr by sex.
B2M
Figure 2 shows the log10 mean urine B2M concentration over the first 30 postnatal days. At birth, the mean B2M was highest in the 24-week GA group, which systematically decreased with increasing GA (p < 0.001). The rate differed by GA groups (p < 0.05). Similar findings were seen for B2M/Cr ratios.
Next, we report urine B2M concentrations, B2M/Cr ratios at different timepoints, and assess whether these values converged at the 27-, 30-, and 34-week PMA timepoints. Figure 3 and Table 3 show the mean B2M concentration and the B2M/Cr ratios differed by GA at the 27-week PMA timepoints (p < 0.05), but the levels converge at 30 and 34 weeks PMA.
Finally, Fig. 4 and Table 4 show that B2M was lower in males than in females (p < 0.05). Urine B2M concentration increased slightly over the first 30 days in males, while it decreased slightly per week in females (p < 0.05). Similar findings were seen for B2M/Cr ratio by sex.
Clusterin
Figure 2 shows the mean log10 urine clusterin concentrations over the first 30 postnatal days. Table 2 shows that at birth the mean clusterin values were highest in the 24-week GA group and decreased systematically with increasing GA (p < 0.001). The clusterin values were not statistically different over time. Similar findings were noted for clusterin/Cr ratios.
Next, we report urine clusterin, and clusterin/Cr ratios at the 27-, 30-, and 34-week PMA timepoints. Figure 3 and Table 3 show that the mean clusterin concentrations ratios differed at the 27- (p < 0.001) and 30-week PMA (p < 0.05) by the GA group, but the levels converge to similar concentrations at 34 weeks PMA. Similar findings were noted for clusterin/Cr ratios.
Finally, Fig. 4 and Table 4 show that at birth, clusterin was slightly lower in males than in females (p < 0.05). Urine clusterin increased slightly over the first 30 days in both males and females (not statistically different). Similar findings were seen for clusterin/Cr ratio by sex.
Cystatin C
Figure 2 shows the mean log10 urine cystatin C concentrations over the first 30 postnatal days. At birth, the mean cystatin values were highest in the 24-week GA group and were systematically lower with increasing GA (p < 0.001). The cystatin C percent change per week decreased slightly in the 24-week GA group, but increased systematically across the other GA groups (p < 0.001). Similar findings were seen for cystatin C/Cr ratio evaluations.
Next, we report urine cystatin C and cystatin C/Cr ratios at the 27-, 30-, and 34-week PMA timepoints. Figure 3 and Table 3 show the mean cystatin C concentrations at the 27-week PMA timepoint differed by GA group (p < 0.05), but the levels had achieved similar concentrations at 30 and 34 weeks PMA for each of the GA groups. When evaluating the cystatin C/Cr ratios, there were statistically significant differences at the 24- (p < 0.001) and 27-week (p < 0.05) PMA timepoints, but not at 30-week PMA.
Finally, Fig. 4 and Table 4 show that cystatin C was lower in males than in females (p < 0.001). Urine cystatin C increased in males with a rate of rise per week, while there was not a significant change in females (p < 0.05). Similar findings were seen for the cystatin/Cr ratio by sex.
EGF
Figure 2 shows the mean log10 urine EGF concentrations over the first 30 postnatal days. At birth, EGF was lowest for the 24-week GA and increased systematically by increasing GA (p < 0.001). The rate of change of urine EGF was not statistically different across GA groups. Similar findings were found for EGF/Cr ratio at birth; however, we found a statistically significant increase in EGF/Cr ratio by increasing the GA group over time.
Next, a report of the urine EGF concentrations, EGF/Cr ratios converged at the 27-, 30-, and 34-week PMA timepoints. Figure 3 and Table 3 show that the mean EGF concentrations and the EGF/Cr ratios did not differ significantly at the 27- or 34-week PMA timepoints, but differed at the 30-week timepoint (p < 0.05).
Finally, Fig. 4 and Table 4 show that EGF was similar in males and females at birth, and urine EGF increased over the first 30 days in both males and females. Alternatively, the EGF/Cr ratio differed by sex at birth, yet the rate of change was not statistically different by sex.
KIM-1
Figure 2 shows the mean log10 urine KIM-1 concentrations over the first 30 postnatal days. Table 2 shows that KIM-1 was highest at birth in the 24-week GA group, which steadily decreased by increasing the GA group (p < 0.001). The rate of change increased systematically across GA groups, although these changes were not statistically significant. Similar findings were seen for KIM-1/Cr values.
Next, a report of the urine KIM-1 concentrations, KIM-1/Cr ratios at the 27-, 30-, and 34-week PMA timepoints was performed. Figure 3 and Table 3 show that the average KIM-1 concentration at the 27- and 30-week PMA timepoints differed by the GA group (both p < 0.001), but the concentrations were no longer statistically different at the 34-week PMA. When evaluating urine KIM-1/Cr ratios, differences were seen at only the 27-week timepoint.
Finally, Fig. 4 and Table 4 show that KIM-1 was slightly lower in males vs. females (p < 0.05). Urine KIM-1 increased slightly over the first 30 days for both sexes to a similar degree. Similar findings were seen for the mean KIM-1/Cr ratio.
NGAL
Figure 2 shows the mean log10 NGAL concentrations over the first 30 postnatal days. Table 2 shows that at birth NGAL was highest in the 24-week GA group, which decreased steadily with increasing GA (p < 0.001). The rate of change decreased systematically across GA groups with very similar rates of decline by GA. Similar findings were found for urine NGAL/Cr values.
Next, a report of the urine NGAL concentrations, NGAL/Cr ratios, and an assessment of whether these values converged at the 27-, 30-, and 34-week PMA timepoints was performed. Figure 3 and Table 3 show that the mean NGAL concentrations and the NGAL/Cr ratios were statistically different at the 27- and 30-week PMA timepoints by GA group, but the levels were no longer statistically different at the 34-week PMA timepoint.
Finally, Fig. 4 and Table 4 show that NGAL concentration at birth was higher in females than in males (p < 0.001). The urine NGAL for both sexes decreased slightly over the first 30 days. Similar findings were seen for the mean NGAL/cr ratio by sex.
OPN
Figure 2 shows the mean log10 urine OPN concentrations over the first 30 postnatal days. Table 2 shows that at birth the mean OPN was highest in the 24-week GA and systematically decreased with increasing GA. In addition, the rate of change decreased across GA groups with a statistically significant difference by GA (p < 0.05). Similar findings were found for the OPN/Cr values at birth (p < 0.001), but no statistically significant differences over time were observed for OPN/Cr by GA.
Next, a report of the urine OPN and OPN/Cr ratios at the 27-, 30-, and 34-week PMA timepoints. Figure 3 and Table 3 that the mean OPN concentrations were significantly different at the 30 and 34-week timepoints (but not the 27-week PMA timepoint). The OPN/Cr ratios differed at the 27-, 30-, and 34-week PMA timepoints.
Finally, Fig. 4 and Table 4 show that urine OPN was similar in males and females. Urine OPN for both sexes decreased similarly over the first 30 days. Similar findings were seen for the mean OPN/Cr ratio by sex.
UMOD
Figure 2 shows the mean log10 urine UMOD concentrations over the first 30 postnatal days. Table 2 shows that at birth UMOD was lowest for the 24-week GA and systematically increased with higher GA (p < 0.001). The rate of change increased slightly over time by GA groups, although these changes were not statistically significant. Similar findings are observed for the UMOD/Cr ratios.
Next, a report of the UMOD and UMOD/Cr ratios at the 27-, 30-, and 34-week PMA timepoints. Figure 3 and Table 3 show that UMOD concentrations were not statistically different by GA at the 27-, 30-, and 34-week PMA timepoints. The mean UMOD/cr ratio was significantly different at the 27-week PMA timepoint, but did not differ at the 30- and 34-week timepoint.
Finally, Fig. 4 and Table 4 show that UMOD concentrations are similar in males vs. females. The mean log10 change over time increased slightly for males and females over the first 30 days. Similar findings were seen for the mean UMOD /cr ratio.
Creatinine
Figure 2 shows the mean log10 urine creatinine concentration over the first 30 postnatal days. Table 2 shows that the 24-week GA had the lowest urine creatinine that increased systematically with increasing GA group (p < 0.001). The rate of change steadily increased slightly across GA groups (differences not statistically different).
Next, a report of the urine creatinine concentrations at the 27-, 30-, and 34-week PMA timepoints was performed. Figure 3 and Table 3 show that the mean urine creatinine concentrations at the 27-week PMA timepoint differed slightly by GA group at the 27-week PMA timepoints, but were not statistically different at the 30- and 34-week PMA timepoints.
Finally, Fig. 4 and Table 4 show that creatinine at birth was similar in males and urine creatinine increased slightly for both sexes over the first 30 days without significant difference by sex.
Summary of results
Table 6 summarizes the findings in Tables 2, 3, 4, and 5. The mean biomarker concentrations at birth for all ten urine biomarkers differed by GA at birth. The biomarkers that showed an increase in the rate of change over the first 30 days were αGST, NGAL, and OPN. The biomarkers that showed a decrease in the rate of change over the first 30 days were albumin, clusterin, creatinine EGF, KIM-1, and UMOD. The biomarkers that showed different rates of change over time by the GA group were αGST, albumin, B2M, cystatin C, and OPN.
The biomarker concentrations that differ at 27 weeks PMA include albumin, B2M, clusterin, creatinine, cystatin C, KIM-1, and NGAL. The biomarker concentrations that differ at 30 weeks PMA include clusterin, EGF, KIM-1, NGAL, and OPN. Only OPN concentrations differ at 34 weeks PMA.
The biomarker concentrations that change over time for the 24-, 25-, 26-, and 27-week GA groups are summarized in Table 5. The biomarkers that differ by sex were αGST, B2M, clusterin, cystatin C, KIM-1, and NGAL, while the rate of change over time by sex differed in albumin, B2M, cystatin C, and OPN. No differences were seen by treatment for any biomarkers.
Correlation analysis between biomarkers
The biomarker concentration correlations with one another are shown in Fig. 5.
Discussion
This ancillary study reports on ten urine biomarkers and their respective biomarker/Cr ratios in 750 extremely low GA neonates without severe AKI. We report how these biomarkers differ at birth by GA, sex, and Epo status. We report the trends over both chronological times and PMA by GA, and sex. We found that some biomarker concentrations increase, while others decrease over the first 30 days. Although all ten biomarker concentrations differ at birth by the GA, 3/10 urine biomarkers were no longer different at 27 weeks PMA, 5/10 were no longer different by 30 weeks PMA, and only 1 (OPN) differed by GA at 34 weeks PMA. This suggests that that the developmental changes leading to differences in biomarkers at birth become similar by 34 weeks PMA irrespective of the degree of prematurity at birth. About half of the biomarker concentrations differed by sex, and 4/10 showed different rates of change over time between males vs. females. Finally, we did not see any changes in urine biomarkers by treatment arm (Epo vs. placebo). No major differences were seen in these patterns when we evaluate the biomarker/Cr ratios.
Nephrogenesis begins at the fifth week of gestation and continues until 34–36 weeks.36 Study of the urine proteome may lend insights into the developmental process that are occurring at an individual level. Some urine biomarkers (i.e., B2M, clusterin, KIM-1, NGAL) decrease over time, presumably due to the maturation of tubular reabsorption capacity of these proteins, which occur with tubular maturity. In contrast, we found that some urine biomarkers (i.e., EGF and UMOD) rise over time, presumably due to increased tubular mass. Further evaluation of these relationships and the mechanisms that underlie these changes are beyond the scope of this analysis. Further research is needed to provide important insights into how urine tubular/glomerular development can be tracked with the urine proteome.
In 2015, Saeidi et al. published data on many of the same biomarkers over the first 2 postnatal weeks in 81 premature neonates without AKI from a single-center cohort.21 They concluded that many of these urine biomarkers are affected by sex and change over time from birth. The current study corroborates these findings in a larger, multicenter cohort and shows differences by smaller GA intervals and provides insights on how these biomarker concentrations change over a longer period of time. In addition, because we have urine collection for many weeks after birth, this report provides insights about changes by maturation as we evaluate biomarkers at the 27-, 30-, and 34-week PMA timepoints. This study provides insights as it provides the ability to compare biomarker concentrations at 27 weeks PMA in urine from day 21 postnatal in a 24-week GA neonate vs. urine from day 7 postnatal in a 26-week GA neonate.
The strengths of this study include the collection of a large sample size from multiple centers and a large number of urine specimens collected at different timepoints over the first months of life. Despite these strengths, we acknowledge several important limitations. First, not all neonates had urine collected at the designated timepoints. Second, most of the urine measurements were collected using cotton balls, which could alter urine biomarker concentrations.37 Third, because not all neonates had SCr measured every day, we may have missed some neonates who had severe AKI and would have otherwise been excluded from this study. Fourth, we acknowledge that the CV% for B2M was poor; thus, making inferences about the B2M analysis questionable. For B2M primarily, but also for other biomarkers, values had to be imputed if they were above or below the level of detection. Finally, we recognize that other variables (e.g., comorbidities) can affect urine biomarker changes and that changes may be due to other factors besides GA and sex.
Overall, this study suggests that urine biomarkers differ to a varying degree by GA, postnatal age, and sex. These differences should be considered in planning, analyzing, and interpreting urine biomarker studies in premature neonates. Although this may not be an issue when evaluating extreme biomarker values (e.g., as one detects an episode of AKI with a biomarker that rises 5-fold when AKI occurs), it could create complexity for clinicians and researchers as they evaluate whether mild or modest biomarker values are “abnormal.” To address this issue, evaluation for changes from baseline and/or trends in biomarker concentrations over time (as opposed to evaluation of a single value) may better accomplish the clinical/research goals. Alternatively, an evaluation of how the biomarker differs from the expected normative values (for PMA) could be used. Furthermore, these data suggest that there is a “normalization” of the biomarker patterns by 34 weeks PMA, regardless of the degree of prematurity at birth. This suggests a maturation of tubular protein secretion/reabsorption normalization over time. How these important questions apply to premature neonates >28 weeks GA and term neonates need to be evaluated.
Change history
13 December 2021
A Correction to this paper has been published: https://doi.org/10.1038/s41390-021-01898-5
References
Jetton, J. G. et al. Incidence and outcomes of neonatal acute kidney injury (awaken): a multicentre, multinational, observational cohort study. Lancet Child Adolesc. Health 1, 184–194 (2017).
Koralkar, R. et al. Acute kidney injury reduces survival in very low birth weight infants. Pediatr. Res. 69, 354–358 (2011).
Askenazi, D. J., Griffin, R., McGwin, G., Carlo, W. & Ambalavanan, N. Acute kidney injury is independently associated with mortality in very low birthweight infants: a matched case-control analysis. Pediatr. Nephrol. 24, 991–997 (2009).
Askenazi, D. J. et al. Prevalence of acute kidney injury (Aki) in extremely low gestational age neonates (Elgan). Pediatr. Nephrol. 35, 1737–1748 (2020).
Goldstein, S. L. Acute kidney injury in children: prevention, treatment and rehabilitation. Contrib. Nephrol. 174, 163–172 (2011).
Soni, S. S., Ronco, C., Katz, N. & Cruz, D. N. Early diagnosis of acute kidney injury: the promise of novel biomarkers. Blood Purif. 28, 165–174 (2009).
Ostermann, M., Philips, B. J. & Forni, L. G. Clinical review: biomarkers of acute kidney injury: Where are we now? Crit. Care 16, 233 (2012).
Askenazi, D. J. et al. Baseline values of candidate urine acute kidney injury (Aki) biomarkers vary by gestational age in premature infants. Pediatr. Res. 70, 302–306 (2011).
Ahn, Y. H., Lee, J., Chun, J., Jun, Y. H. & Sung, T. J. Urine biomarkers for monitoring acute kidney injury in premature infants. Kidney Res. Clin. Pract. 39, 284–294 (2020).
Kamianowska, M., Szczepanski, M. & Wasilewska, A. Tubular and glomerular biomarkers of acute kidney injury in newborns. Curr. Drug Metab. 20, 332–349 (2019).
Sellmer, A. et al. Urinary neutrophil gelatinase-associated lipocalin in the evaluation of patent ductus arteriosus and aki in very preterm neonates: a cohort study. BMC Pediatr. 17, 7 (2017).
Tanigasalam, V., Bhat, B. V., Adhisivam, B., Sridhar, M. G. & Harichandrakumar, K. T. Predicting severity of acute kidney injury in term neonates with perinatal asphyxia using urinary neutrophil gelatinase associated lipocalin. Indian J. Pediatr. 83, 1374–1378 (2016).
Hanna, M. et al. Early urinary biomarkers of acute kidney injury in preterm infants. Pediatr. Res. 80, 218–223 (2016).
Chen, C. N. et al. Urinary neutrophil gelatinase-associated lipocalin levels in neonates. Pediatr. Neonatol. 57, 207–212 (2016).
Askenazi, D. J. et al. Acute kidney injury urine biomarkers in very low-birth-weight infants. Clin. J. Am. Soc. Nephrol. 11, 1527–1535 (2016).
Askenazi, D. J. et al. Urine biomarkers predict acute kidney injury in newborns. J. Pediatr. 161, 270–275 e271 (2012).
Askenazi, D. J. et al. Urine biomarkers predict acute kidney injury and mortality in very low birth weight infants. J. Pediatr. 159, 907–912.e901 (2011).
Balena-Borneman, J. et al. Biomarkers associated with bronchopulmonary dysplasia/mortality in premature infants. Pediatr. Res. 81, 519–525 (2017).
Shima, Y., Kumasaka, S. & Nishimaki, S. Urinary beta2-microglobulin and bronchopulmonary dysplasia: trends in preterm infants. Pediatr. Int. 59, 1169–1173 (2017).
Askenazi, D. J. et al. Baseline values of candidate urine acute kidney injury biomarkers vary by gestational age in premature infants. Pediatr. Res. 70, 302–306 (2011).
Saeidi, B. et al. Impact of gestational age, sex, and postnatal age on urine biomarkers in premature neonates. Pediatr. Nephrol. 30, 2037–2044 (2015).
Lavery, A. P. et al. Urinary Ngal in premature infants. Pediatr. Res. 64, 423–428 (2008).
Huynh, T. K. et al. Reference values of urinary neutrophil gelatinase-associated lipocalin in very low birth weight infants. Pediatr. Res. 66, 528–532 (2009).
Bennett, M. R., Nehus, E., Haffner, C., Ma, Q. & Devarajan, P. Pediatric reference ranges for acute kidney injury biomarkers. Pediatr. Nephrol. 30, 677–685 (2015).
Weber, A., Harrison, T. M., Sinnott, L., Shoben, A. & Steward, D. Plasma and urinary oxytocin trajectories in extremely premature infants during NICU hospitalization. Biol. Res. Nurs. 19, 549–558 (2017).
Nakata, Y., Okada, H., Itoh, S. & Kusaka, T. Developmental changes in urinary coproporphyrin ratio in premature infants. Pediatr. Int. 62, 65–69 (2020).
Juul, S. E., Mayock, D. E., Comstock, B. A. & Heagerty, P. J. Neuroprotective potential of erythropoietin in neonates; design of a randomized trial. Matern. Health Neonatol. Perinatol. 1, 27 (2015).
Juul, S. E. et al. A randomized trial of erythropoietin for neuroprotection in preterm infants. N. Engl. J. Med. 382, 233–243 (2020).
Kellum, J. A., Lameire, N. & Group, K. A. G. W. Diagnosis, evaluation, and management of acute kidney injury: a Kdigo summary (Part 1). Crit. Care 17, 204 (2013).
Thayyil, S., Sheik, S., Kempley, S. T. & Sinha, A. A gestation- and postnatal age-based reference chart for assessing renal function in extremely premature infants. J. Perinatol. 28, 226–229 (2008).
Bateman, D. A. et al. Serum creatinine concentration in very-low-birth-weight infants from birth to 34-36 wk postmenstrual age. Pediatr. Res. 77, 696–702 (2015).
Engle, W. A. American Academy of Pediatrics Committee on, F. & Newborn. Age terminology during the perinatal period. Pediatrics 114, 1362–1364 (2004).
Amaral Pedroso, L. et al. Acute kidney injury biomarkers in the critically ill. Clin. Chim. Acta 508, 170–178 (2020).
Devarajan, P. The current state of the art in acute kidney injury. Front. Pediatr. 8, 70 (2020).
Zeger, S. L. & Liang, K. Y. Longitudinal data analysis for discrete and continuous outcomes. Biometrics 42, 121–130 (1986).
Hinchliffe, S. A., Sargent, P. H., Howard, C. V., Chan, Y. F. & van Velzen, D. Human intrauterine renal growth expressed in absolute number of glomeruli assessed by the disector method and cavalieri principle. Lab. Invest. 64, 777–784 (1991).
Boohaker, L. et al. Absorbent materials to collect urine can affect proteomics and metabolomic biomarker concentrations. Clin. Chem. Lab. Med. 57, e134–e137 (2019).
Acknowledgements
We would like to thank Lynn Dill, RN and Emily Pao for their assistance in coordinating the REPaIReD study, and to Dana Pass for the preparation of the manuscript. We would like to thank the additional primary investigators, co-investigators, clinicians, research personnel, study team, and families who participated in the PENUT study. Some data presented in this study were previously presented as an e-poster abstract presentation at the 2020 American Society of Nephrology meeting.
Funding
Recombinant Erythropoietin for Protection of Infant Renal Disease (REPaIReD) Study is a NIHNIDDK-funded (R01 DK103608) ancillary study designed to look at kidney outcome in patients enrolled in the Preterm Erythropoietin Neuroprotection Trial (PENUT trial), which is a NIHNINDS-funded (U01 NS077953, U01 NS077955) trial. Urine creatinine was run at the UAB AKIO’Brien Center core (NIH P30-DK079337). The clinicaltrials.gov identifier is NCT01378273. Funding sources for this study had no role in study design, data collection, data analysis, data interpretation, or writing of the report.
Author information
Authors and Affiliations
Consortia
Contributions
D.J.A. contributed to the conceptualization and design of the study, data analysis, and drafted the initial manuscript. B.A.H., R.H.S., P.J.H., P.B., S.E.J., S.L.G., and S.H. contributed to the conceptualization and design of the study, data analysis, and assisted in the manuscript preparation. All authors approved the final manuscript as submitted and agree to be accountable for all aspects of the work.
Corresponding author
Ethics declarations
Competing interests
All authors declare no real or perceived conflicts of interest that could affect the study design, collection, analyses, and interpretation of data, writing of the report, or the decision to submit for publication. For full disclosure, we provide here an additional list of other authors’ commitments and funding sources that are not directly related to this study: D.J.A. is a consultant for Baxter, Nuwellis, Medtronic, Bioporto, AKI foundation, and SeaStar. He also receives external education and research funding not related to this project from Baxter, Nuwelis, and Medtronic. S.L.G. reports personal fees from and a position as a consultant to Nuwellis, Renibus, ExThera, Reata, and Medtronic Inc. S.L.G. receives grant funding from and serves as a consultant and on a Speaker’s Bureau for Baxter Healthcare, Inc. S.L.G. receives grant funding and serves as a consultant for BioPorto, Inc. S.L.G. serves on a Speaker’s Bureau for Fresenius Medical Corporation. S.E.J. receives grant funding from NINDS and NICHD for studies not related to this project. P.J.H. and R.H.S. receive grant funding from NHLBI and PCORI for studies not related to this project.
Ethics committee approval
The University of Washington Institutional Review Board (IRB) approved this collaborative study, and each center received approval from its respective IRBs.
Consent statement
Parental/guardian consent was required for participation.
Additional information
Publisher’s note Springer Nature remains neutral with regard to jurisdictional claims in published maps and institutional affiliations.
The original online version of this article was revised: The list of authors has been corrected and Brian Halloran has been added to the PDF.
Rights and permissions
About this article

Cite this article
Askenazi, D.J., Halloran, B.A., Heagerty, P.J. et al. Gestational age, sex, and time affect urine biomarker concentrations in extremely low gestational age neonates. Pediatr Res 92, 151–167 (2022). https://doi.org/10.1038/s41390-021-01814-x
Received:
Revised:
Accepted:
Published:
Issue Date:
DOI: https://doi.org/10.1038/s41390-021-01814-x
