
Abstract
Background
Use frequency and times are critical parameters for estimating realistic chemical exposures associated with the use of consumer products. Very limited information is available in the published literature for children’s use patterns of art and craft materials at home and school.
Objective
Conduct a year-long survey of art materials use at home and school by pre-school and elementary school children, teachers, and parents which can be used to refine chemical exposure assessments for these consumer products.
Methods
Parent and teacher online surveys were conducted on the daily use of markers and monthly use of fifteen additional art and craft materials.
Results
Daily marker use by elementary children was widespread at home and school (65% and 80%, respectively). On average, pre-school and elementary students used markers for 27 min per day, more than double daily home use. Adults used markers for longer durations relative to their children/students with teachers reporting the highest average daily usage time. School use of general art materials exceeded home use for both age groups, with elementary children using art materials more frequently than their pre-school counterparts. Examples of how these data can be used to refine exposure estimates are provided.
Significance
Accurate art material usage data contributes to refined estimates of chemical exposure for these consumer products.
Impact Statement
-
A year-long online survey was conducted which measured daily frequency and duration use for markers and comparable monthly use of other art materials for pre-school and elementary school children, their parents and teachers. Such use information is critical for estimating chemical exposures associated with this class of consumer products.
Introduction
Art materials such as markers are used universally by adults, children, artists and the general public. Consumers using such materials may be exposed to solvents, pigments, heavy metals and other toxins with the potential to cause acute or chronic health effects [1,2,3]. Children may be more susceptible to the acute or chronic effects of such toxicants [4]. However, minimal data exists describing the frequency and duration of use of art materials by young school-aged children and none was found that compares such use in home and school environments. Such frequency of use information is critical for estimating realistic consumer exposures to potentially hazardous chemicals in such consumer products. Without specific information on use frequency (and duration), conservative (worst case) maximum exposure estimates must be used in human health chemical risk assessment, potentially leading to conservative risk estimates [5,6,7].
Globally, art materials must meet consumer product regulatory requirements. In the United States, general art materials are regulated by the Federal Hazardous Substances Act (FHSA) and the Labeling of Hazardous Art Materials Act (LHAMA), both of which are enforced by the Consumer Product Safety Commission. LHAMA incorporates the American Society of Testing and Materials (ASTM) standard D4236 which requires the evaluation of the product chemical formulation by a board-certified toxicologist to determine if the product conforms to the standard, and if cautionary labeling is warranted for chronic toxicity [8]. Children’s art materials sold in the U.S. must also adhere to the Consumer Product Safety Improvement Act (CPSIA) while art materials sold in the European Union may require compliance with the Toy Safety Directive (2009/48/EC) [9]. Canadian art materials must meet the requirements of the Canadian Consumer Product Safety Act (CCPSA) and the Toy Safety Directive (SOR 2011-17) [10].
Art material usage by children has been measured previously using consumer surveys [8, 11,12,13]. Previous survey results, however, provide only a snapshot in time of such usage and do not address potential variations in art material usage due to day of the week, time of year, location, or age of user. In addition, the recall timeframe for surveys can contribute to bias and non-representative data. Survey recall error is inversely correlated with the length of the recall period with accuracy decreasing the further the data collection is from the actual event [14, 15]. Therefore, a novel survey methodology was developed based on parallel surveys conducted daily (for parents) and during the school week (for teachers) utilizing short recall times (48–72 h).
The primary objective of the survey was to gather comprehensive data characterizing the duration and frequency of marker use by children (age 12 and younger) at home and at school. Secondary objectives were to gather information on parent and teacher marker usage and about general art material use patterns by children. Use frequency and times collected during a full calendar year will help inform refinements of human exposure estimates in the absence of direct personal monitoring studies. Such human exposure estimates may be used in development of inhalation and /or dermal exposure models for art and crafts materials.
Materials and methods
Study design/ sampling plan
Data for both the In-Home and In-School Surveys were gathered using an Internet panel of United States households. The Internet panel company selected was Dynata, formerly ResearchNow. Dynata is a leading supplier of on-line samples for surveys. It has large and diverse panels consisting of millions of Americans and is highly regarded as a reputable source of respondents for online surveys. Dynata utilizes appropriate industry procedures for ensuring the integrity and quality of its panels.
Surveys were designed to minimize cost, maximize data collection without the need for daily journals, rely on short-term (24–72 h) and moderate-term (30 days) recall, while maintaining an optimal survey length [16]. The surveys focused on recent recall of marker use (1–3 day recall) and monthly recall of general art material use which was included as a means to collect data in a cost-effective manner comparable to earlier survey efforts by others [13]. Art materials surveyed included acrylic paints, ceramics, chalk/pastels, craft materials, crayons, fabric paints, finger paints, glue, modeling materials, oil paints, paper mache, pencils, stamp pads, tempera paints, and watercolor paints.
Surveys were comprised of two parts: a screening survey and the main survey. Separate but similar surveys were conducted for parents and teachers. Screening surveys were completed by all persons receiving an invitation to participate. Screening survey respondents identified as parents of children under age 12, pre-school teachers, or elementary school teachers also completed the main surveys. Surveys focused on two age groups for data collection: (1) Pre-school children (also referred to as Pre-Kindergarten/ Pre-K; ages 1–4) and (2) Elementary school children (also referred to as K-6; ages 5–12).
The survey sampling plan was designed to ensure that individuals receiving invitations to participate in the study were representative of the United States population. Head of household quotas for the parent surveys were established using census information for three demographics: (1) region (Northeast, Midwest, South, and West), (2) gender (male, female) and (3) age (18 to 34, 35 to 49, 50 and older). Once a quota group (e.g., males, 18 to 34 years old, living in the Northeast) was filled, no other respondents from that group were accepted into the sample. Since no census data existed on the age, gender and regional distribution of elementary school teachers, it was assumed that teachers were geographically distributed in the same way the general population was distributed. Therefore, only regional quotas were established for teacher survey invitations. The year was divided into quarters and a nationally representative sample was drawn for each quarter shortly before it began. Samples were drawn quarterly since over longer time periods potential respondents drop out of the sample, die, cease to be qualified, etc.
Data collection
-
(I)
In-Home Parent Survey
Participation in the main survey was limited to parents with children 1–12 years of age. Parent surveys were collected every day (approx. 2 parents per day) for one calendar year to achieve the yearly target sample size of 746 participants (186 per quarter).
Survey questions pertained to parents’ personal marker usage and marker usage for each child in the household in the designated age range (for example: number of times used, total minutes used, how long in a room where markers were being used, whether used alone or with others and use of multiple markers). Participants were also surveyed about whether the child engaged in specific art-related activities during the past 30 days.
A novel approach was used to fulfil the target sample size. Approximately two parents from different households, who had not previously participated in the survey, completed a questionnaire each day for each child in the home in the designated age range. Each parent respondent was asked about the current and previous day’s markers usage of the child(ren) for whom they were responsible. Data collected for the current day and the previous day produced a minimum of four completed surveys per day (two parents responding for a single child as today and two responding for the day as yesterday). In this way, both 24-h recall data and 48-h recall data were combined in the data collected for a single day.
-
(II)
In-School Teacher Survey
Participation in the main survey was limited to teachers who taught Pre-K and grades K-6. Data were collected two days per week for a calendar year, excluding Federal holidays, to achieve the intended sample size of 624 teachers (156 per quarter). Survey questions paralleled the questions used in the In-Home Study, modified for a school environment.
Teachers received questionnaires on either Tuesday or Friday of each week. Tuesday teachers completed two surveys: one with questions pertaining to the current days’ marker usage (Tuesday) and one for recall of yesterday’s marker usage (Monday). Friday teachers completed three surveys: one for the current day’s marker usage (Friday), one for yesterday’s marker usage (Thursday) and one for marker usage two days ago (Wednesday). In this way, 24, 48 and 72-h recall data were combined in the data collected for a single day.
Teacher survey participants were asked about class size, number of students who used markers, total minutes of marker usage that day and whether used alone or with others. Respondents were also asked about the use of multiple markers and whether the class engaged in other art-related activities during the previous 30 days. Due to variability in scheduled/unscheduled days off between school districts, each teacher interviewed was asked if school was in session on the days of interest.
Data analysis
Data collection, compilation, and tabulation were provided by Dynata. Tabulated and statistical values (sigma, mean, median, standard deviation, standard error, maximum value, minimum value) were computed and reported quarterly by survey question for the In-Home Parent and In-School Teacher screening and main surveys. Quarterly reports were provided in EXCEL format. Tabulated parent surveys reported results for children age 1–4, age 5–12 and parents; teacher surveys reported results for Pre-K classes, K-6 classes and teachers. All data were included in the calculations (including null data) with the exception of daily student marker use data for teachers not actively teaching.
Two-sided t tests were used to discern potential statistical differences between daily minutes of marker use data collected during the last quarter of the study (referred to as pre-pandemic and pandemic data). They were also used to determine statitistical significance between data collected for child and adult groups within each quarter (p < 0.05).
Results
-
(I)
In-Home Parent Survey
A total of 760 parents completed 3008 surveys for 1504 children. Parents completing surveys were regionally representative of the United States population based on comparisons with census data (Table 1) [17].
Table 1 Main survey respondent summary. Sixty percent of the parents (457) had one or more children between one and four years of age and 73% (554) had one or more children between five and 12 years of age. Thirty-three percent of parents (251) had children in both age categories. The age distribution for children for whom surveys were completed was roughly equal: 46% were age 1–4 and 54% were age 5–12.
Each household surveyed had approximately two children. More than half of the younger children (53.1%) attended daycare/pre-school. The majority of older children (85.4%) attended public/private school with the remainder (14.6%) being homeschooled. A summary of parent participant survey totals is reported in Table 1.
Results showed consistent daily use of markers with approximately 65% of children and 80% of parents using markers each day, on average, throughout the year (Table 2). Younger children (age 1–4) were more likely than older children (age 5–12) to use markers each day (70% vs. 62%, p < .05). The highest daily marker use by children was measured during the first quarter of the study (May 1-July 31, 2019) which corresponds roughly with the end of the traditional school year and first half of summer vacation. Daily use dropped off during the beginning of the school year and rose thereafter throughout the remainder of the year.
Table 2 Home and school marker use summary. On average, older children (age 5–12) used markers for more minutes/day relative to younger children (11.9 min per day vs. 9.8 min per day). Children age 1–4 consistently used markers for the least number of minutes/day.
The overall yearly average for daily marker use time for children at home was 10.9 min/day (equivalent to 5.5 h per month) (Table 2). Children use markers at home nearly three times a day averaging approximately 4 min/session each time a marker is used (data not shown).
Overall, parents reported both higher daily use (69.9% vs. 65.4%) and daily minutes of use (13.8 min per day vs. 10.9 min per day) compared with their children for both age groups. Daily marker use by parents of children age 5–12 was less than that reported by parents of younger children for the entire year (p < 0.05). Parents of children age 1–4 reported the highest daily mean minutes of marker use until the last quarter of the study.
The daily amount of time a child was in a room where markers were being used (regardless of whether or not the child was actively using markers) was also surveyed. The results (separate from individual usage time, data not shown) show that, on average, children at home are in such a room for 19.5 min per day (equivalent to 9.8 h per month). Although this is nearly double the actual personal usage time of 10.9 min per day, the number of instances a child was in a room where markers were being used is not known. Hence, a direct comparison of exposure time per session is not possible.
The data reflect that both parents and children contribute to the time that children are in a room where markers are being used. During the first quarter, the sum of mean minutes of daily marker usage by children and their parents is roughly equivalent to the total time a child is in a room where markers are being used. For the remainder of the year, the time a child is in a room where markers are used trends with the total sum of child plus parent daily usage but is consistently less than it.
Parents also reported monthly use of several art material types by their children. Comparison of mean art material monthly use times for children age 1–4 and 5–12 is illustrated in Fig. 1. Crayons and pencils were the art materials used for the longest aggregate times by children at home with mean times of 3.6 and 3.5 h per month, respectively. With the exception of finger paints, older children consistently used art materials more hours per month compared with younger children.
Fig. 1: Home and school art activity. 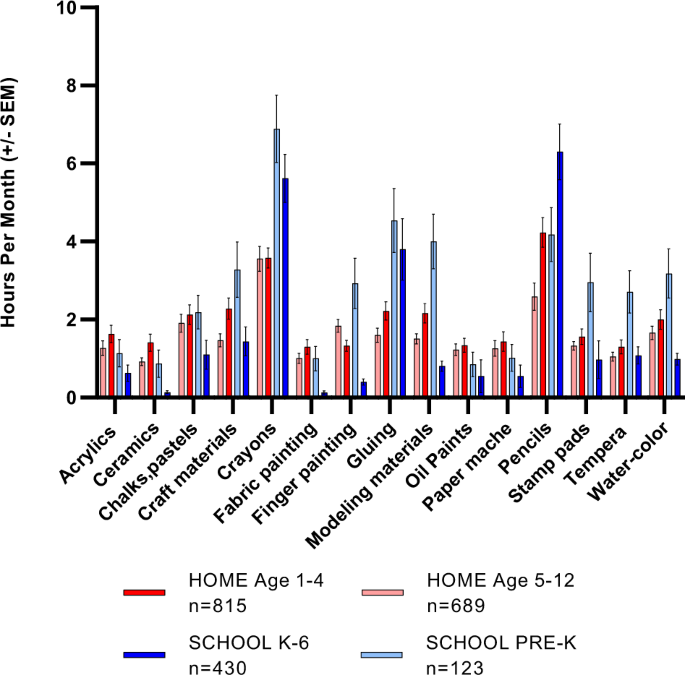
Average monthly use of art materials for Pre-K and K-6 children at home and school.
-
(II)
COVID-19 Impact on In–Home Parent Survey data
Prior to the start of the study, there was no thought about the impact a pandemic might have on the study. However, due to country-wide school and business closures during the last six weeks of the study, in-home pre-pandemic data for daily minutes of marker use for children and parents (collected from February 1- March 15, 2020) and similar pandemic data (collected from March 16-April 30, 2020) were evaluated separately to determine if there were statistical differences between the data sets that would preclude them from being combined. T tests were run on the data sets (95% confidence level). No statistically significant differences for mean daily home marker use times (in minutes) were noted between the pre-pandemic and pandemic time intervals. Given that the mean in-home daily marker use data were not statistically different, the datasets were combined and reported for the entire year (Table 3).
Table 3 Pre-pandemic versus pandemic daily home marker use (mean minutes ± standard error). -
(III)
In-School Teacher Survey
A total of 553 teachers completed 1387 surveys for an estimated 18,112 children (approximately 22% Pre-K teachers and 78% K-6 teachers) (Table 1). The ratio of Pre-K and K-6 teachers responding to the survey are consistent with the US Bureau of Labor Statistics [18] which cites a 1:4 ratio for Pre-K teachers to K-6 teachers employment. Although Pre-K teacher participation per quarter was small (21–39) relative to K-6 teacher participation and not sufficiently large for statistical analysis, the total yearly Pre-K teacher response was sufficiently large for such an analysis.
Teacher surveys included a question asking if they were actively teaching for the days for which they were providing data. Of the teacher surveys completed, approximately 69% of teachers were actively teaching (Table 1). Null student data (no marker use by class) reported for teachers actively teaching were included in calculations. Null student data for teachers who were not actively teaching were not included in the tabulated data. This distinction was made to ensure calculated means for daily student marker use were not diluted by teachers reporting no marker use for classes that did not meet that day. All self-reported daily marker use for teachers were included in the calculations (actively teaching and not actively teaching).
Similar to the home findings, there is widespread and consistent marker use by children at school. Approximately 80% of children use markers on a daily basis at school (Table 2) with almost equal daily percent use by Pre-K and K-6 children. On average, children at school use markers for 26.8 min/day (equivalent to 6.7 h per month) with older children generally using them for more minutes per day. The data show that there is more variation in marker daily use frequency and minutes per day in Pre-K classrooms compared with K-6 classrooms (Table 2). On average, children use markers for 11 min/session each time a marker is used at school.
An increase in daily mean minutes of marker use during the third quarter of the study (November–January) for both Pre-K children and their teachers supports the influence of seasonality on marker/art material use (data not shown). Mean daily minutes of marker use was > 30 min/ per day for Pre-K students and >40 min/per day for their teachers which exceeded all other student and teacher means for the year. This seasonality effect appears to be limited to Pre-K classrooms since daily marker use by older students remained fairly constant throughout the year. Mean daily student marker use time trended with marker use time by their teachers, with K-6 teachers actually using markers for longer periods relative to their students.
Like parents, teachers reported both higher daily marker use (83.5% vs. 79.8%) and minutes of use per day (31.2 vs. 26.8 min per day) compared with their students. Generally, K-6 teachers had higher usage percent and daily use times relative to Pre-K teachers.
There was no obvious correlation between percent daily use of markers for students and teachers and the mean daily minutes of use for either group (Fig. 2). Although the percent daily use by each group remained fairly constant through the year (bar graphs), the corresponding mean daily minutes varied through the year reaching a maximum difference during the fourth quarter (see line graphs in Fig. 2). Teachers’ mean daily marker use times rose steadily through the study while students’ use rose only during the third quarter.
Fig. 2: Comparison of daily marker use and daily minutes of marker use. 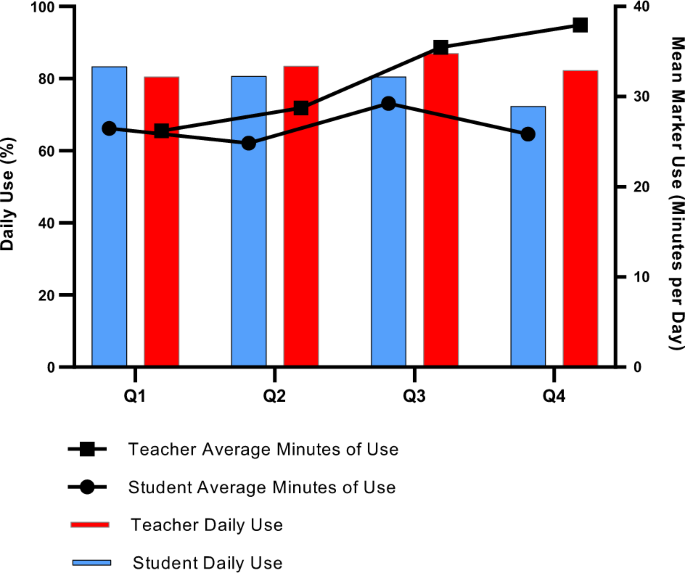
Percent of students and teachers using markers and daily minutes of marker use.
Comparison of average monthly use times of art materials for Pre-K and K-6 students is illustrated in Fig. 1. Crayons, glue and pencils were the most used art materials by school children with mean use times of 5.9, 3.97, 5.83 h per month, respectively. Pre-K teachers reported more variation in art material usage for their students compared with older students. Ceramics, craft materials, fabric painting, finger painting, modeling materials, stamp pads, tempera paints, and watercolors were used more by younger students than older students (p < 0.05). With the exception of pencils, younger students used all art materials surveyed for more hours per month compared with older students while at school.
-
(IV)
COVID-19 Impact on In-School Teacher Survey data
Beginning the week of March 16, 2020, numerous school districts throughout the country closed in response to the COVID-19 pandemic. Teacher surveys sent out post-shutdown yielded no usable data. Therefore, the teacher survey component of the study was truncated effective March 27. Given that the study was based on a calendar year timeframe, collecting data for the missing six weeks was not possible during 2020.
-
(V)
Examples of refined chemical exposure assessments
By definition, exposure assessment is the process of estimating/measuring the magnitude, frequency, and duration of exposure to an agent along with the characteristics of the population exposed [19]. Exposure can occur via ingestion, skin (dermal) or inhalation, and the output of exposure assessment is an estimation of the exposure levels which can be refined with information on use frequency. While the focus of this paper is not on risk assessment per se, Tables 4, 5 describe examples of the refinement of exposure estimations associated with the use of art materials based on the use frequency and duration information obtained from this study.
Table 4 Estimated levels of volatile organic compounds emitted from a marker used in a typical Pre-K classroom. Table 5 Potential average daily dose estimates of lead associated with the use of crayons by Pre-K students.


Marker use times from this study can be used in combination with published volatile organic compound (VOC) emission rates associated with marker usage in the estimation of VOC exposure estimates for a classroom. Emitted levels of VOCs for a classroom can be estimated by multiplying the daily use time per student (as reported in this study) by a chemical-specific VOC emission rate. As shown by Eq. (1), when this product is multiplied by the total number of students and divided by a respective classroom volume size, the result is an estimate of the daily chemical-specific VOC emitted in a classroom.
Emission rates for several VOCs from different marker types including permanent and dry erase have been reported based on experimental chamber models [8]. Table 4 shows the estimated emitted levels of three VOCs (acetone, ethanol, and 2-butanone) commonly found as marker ink components. If such emitted levels are assumed to represent one user, when multiplied by 20 as a conservative number of students in a typical classroom, the results are an estimate of emitted marker VOC levels for an entire classroom. When the calculated emitted VOCs for a typical classroom [20] of 20 students (assuming homogenous, instantaneous distribution in the classroom) are compared to published reference concentration values [21,22,23,24] for these selected VOCs (Table 4), the margin of exposure (MOE) estimates are quite large for both acute and chronic exposures (even when air exchange is not accounted for). These preliminary risk assessment calculations can be refined further with a physiologically-based pharmacokinetic model that takes into account age-specific inhalation rates for more refined MOE estimates based on predicted internal dose metrics such as blood levels of VOCs.
In another example a lead risk assessment associated with the use of crayons by children was reported [5]. Given the absence of use frequency and other more specific data, overly conservative assumptions were used including the ingestion of 14 grams of crayon material per month, constant daily ingestion for three years, and hypothetical lead levels of 99 ppm to indicate that lead levels cannot exceed the CPSIA regulatory limit of 100 ppm [25]. Given more specific information on the weight of a single crayon (children typically use one crayon at a time) and the Pre-K crayon use duration from Fig. 1, the average daily contact (CR) can be estimated by dividing the weight of a single crayon by the crayon use of Fig. 1 in this study [19]. Given that Pre-K students use crayons on average for 6.8 h/month and there are 20 school days per month, CR for crayons can be estimated as described by Eq. (2):
As indicated by Eq. (3) below, the potential average daily dose (pADD) of a contaminant can be estimated with an estimate of CR and more specific information on school days during the Pre-K years
Where C is the concentration of the contaminant in the media of interest (in ppm or µg/g); EF is the exposure frequency (for school use, EF equals 185 days/year based on a typical school calendar year); ED is the exposure duration (in this example, crayon use is in years); and AT is the averaging time in days (estimated as 925 days of Pre-K school years).
Ahmad et al. [5] reported a lead exposure estimate of approximately 1.95 µg/day based on hypothetical lead levels of 99 ppm in crayons [19]. Based on the crayon use information from this study, 185 Pre-K school days/year, and a total of 925 Pre-K school days, Table 5 shows that the potential average daily dose (pADD) as defined by EPA child-specific exposure scenarios example is 0.017 µg/day assuming the same hypothetical lead levels of 99 ppm in a crayon. When more typical lead levels of 10 and 1 ppm as a trace contaminant in art material are assumed, the pADD decreases exponentially to 0.002 and 0.0002, respectively (Table 5).
Discussion
Distinct use patterns were measured for children using art and craft materials at home and school. Mean use patterns, averaged over a calendar year, minimize daily and seasonal influences. Data collected utilized short term recall and combined different recall periods for the same day. Although the teacher component of the study was prematurely truncated due to Covid-19, the data set as a whole is considered to be robust and reflective of typical pre-school and elementary student usage in the United States.
Markers
Findings indicated that at home, younger children (age 1–4) use markers more often but for shorter intervals on a daily basis while older children (age 5–12) use markers, on average, 21% more minutes per day. At school, both age groups use markers with approximately similar daily frequency but K-6 students use markers, on average, 24% more minutes compared with Pre-K students. These data are consistent with and confirm generally accepted knowledge regarding the attention spans of younger versus older children. It would be expected that older children would have the ability to focus and engage in activities for longer periods of time relative to younger children.
At home, parents’ daily use of markers mirrored that of their children with parents of children age 1–4 using markers more frequently on a daily basis relative to parents of older children. On average, parents of younger children used markers for 7% more minutes per day than parents of older children. Interestingly, parents’ use of markers (both daily frequency and minutes per day) exceeded that of their children, regardless of the age of their children (mean = 13.78 min, median = 5 min, range = 0–300 min) with a small percentage of parents (1.9%) reporting > 61 min marker use per day. Overall, these data suggest that parents engage with their children when using markers and also use them independently of shared activities (possibly in a professional capacity, for hobbies, or volunteer activities).
At school, K-6 teachers, on average, used markers 5% more frequently on a daily basis and for 60% more minutes per day compared to Pre-K teachers. This was true for all quarters except the third quarter of the study, which included traditional autumn/winter holidays. It would be expected that during this time of year, Pre-K and elementary students would engage in more arts/craft focused activities. However, marked increase in marker use was observed only for younger students and their teachers during this timeframe. This finding suggests that K-6 students do not engage in as many seasonal art-related activities compared with Pre-K students. Like parents, teacher’s marker use patterns generally mirrored that of their students.
Greater daily marker use by children at home and at school (65% vs. 15%) and (80% vs. 37%), respectively, and shorter daily use times were reported in the current study compared with those previously reported [8]. The year long study reported average marker usage time per session as approximately 4 min at home and 11 min at school. Such disparities can be attributable to year-long data collection versus snapshot data collection and national surveys versus localized surveys and underscores the daily and seasonal influence on children’s marker usage.
Comparison of pre-Covid-19 and post-Covid-19 marker use at home did not reflect statistical differences. Since the end of the study overlapped with the early part of the pandemic, it is likely that changes in art material use were not widespread at this time as families adjusted to lockdown conditions and school closings.
Other art materials
Art material use at home and school spanned a wide range. Crayons, glue and pencils were identified as the art materials used most by children at both locations. On a monthly basis, schoolchildren used these three art materials 65–105% more hours at school relative to children at home. Art materials, such as ceramics, fabric paint, oil paint, paper mache, and tempera paint were the least used art materials both at home and at school with average use reported as 0.3–1.4 h per month.
With the exception of finger paints, older children used art materials for more hours per month at home compared with younger children. At school, the inverse was seen: younger children use individual art materials for more hours per month relative to older students for all art materials surveyed except for pencils. Seasonally and with few exceptions, overall art material use was highest at home and school during the first quarter of the survey (May 2019-July 2019; corresponding to the end of the traditional school year and the beginning of summer vacation). A spike in crayon use for children age 1–4 (4.1 h per month) and pencil use for children age 5–12 at home (5.6 h per month) was noted during the third quarter of the study (November 2019-January 2020). Most art materials used by Pre-K students at school were also increased during this quarter although use by K-6 students was among the lowest reported for the year.
Comparison with a recent pilot survey of pre-school art activities by Lithuanian children reflects similarities in the hierarchy/ranking of most frequently often art materials by young students when correlated with monthly hours of use. Coloring pencils/crayons, watercolors, chalk, pencils, markers and modeling materials were ranked in the order of most frequently often used art materials [12]. The current study reported a similar hierarchical sequence for hours per month use (crayons, pencils, chalks, finger paint, water colors, glue and modeling materials). Differences could be attributable to cultural preferences or consumer availability of such materials.
An illustrative example of marker VOC concentrations in a standard classroom with 20 children using markers showed very large MOEs as compared to published reference inhalation concentration levels. Calculated lead exposures from crayons used by Pre-K students showed lower daily exposure estimates than those previously reported [5]. Both examples demonstrate the importance of accurate frequency and time duration of use data for consumer products, such as art materials. Dated or poor quality exposure data may adversely influence risk assessment evaluations.
Conclusions
Children age 1–12 have distinct use patterns of art materials at home and school. Markers, crayons, pencils and glue are the art materials used for the longest durations by school age children in both environments. At home, older children use markers and most art materials for more hours per month compared with younger children. At school, K-6 students maintain higher usage of markers; however, Pre-K students consistently use general art materials more hours per month. Seasonal influences on art material usage was more pronounced for all children during the end of the traditional school year and early summer months at home but limited to younger children in school. At both home and school, marker use by parents and teachers exceeded use by their respective children/students. Art and craft material usage times reported in this survey can be used to refine risk assessments for chemical components of art materials
Data availability
Additional data can be made available from the corresponding author upon reasonable request.
References
Zuskin E, Schacter EN, Mustajbegovic J, Pucarin-Cvetkovic, Lipozencic J. Occupational health hazards of artists. Acta Dermatovenerol Croat. 2007;15:166–77.
Grabo TN. Unknown toxic exposures: arts and crafts materials. J Am Assoc Occ Health Nurses. 1997;45:124–30.
Lu PC. A health hazard assessment in school arts and crafts. J Environ Pathol Toxicol Oncol. 1992;11:12–7.
Summary of principles for evaluating health risks in children associated with exposure to chemicals.: World Health Organization; 2011 [updated December 7, 2011. 1-50]. Available from: https://www.who.int/publications/i/item/summary-of-principles-for-evaluating-health-risks-in-children-associated-with-exposure-to-chemicals.
Ahmad GR, Kumar S, Ahmad D, Shammas MA. Risk assessment to evaluate if crayons complying with the Consumer Product Safety Improvement Act of 2008 for Lead, also comply with California Proposition 65. Front Public Health. 2017;5:130.
Biesterbos JW, Dudzina T, Delmaar CJ, Bakker MI, Russel FG, von Goetz N, et al. Usage patterns of personal care products: important factors for exposure assessment. Food Chem Toxicol. 2013;55:8–17.
Steiling W, Bascompta M, Carthew P, Catalano G, Corea N, D’Haese A, et al. Principle considerations for the risk assessment of sprayed consumer products. Toxicol Lett. 2014;227:41–9.
Castorina R, Tysman M, Bradman A, Hoover S, Iyer S, Russell M, et al. Volatile organic compound emissions from markers used in preschools, schools, and homes. Int J Environ Anal Chem. 2016;96:1247–63.
Mak SL, Lau HK, editors. A study on the toy safety assessment model. 2013 6th International Conference on Information Management, Innovation Management and Industrial Engineering; 23-24. 2013.
Health Canada, Industry guide to Health Canada’s safety requirements for children’s toys and related products, HealthCanada, Ottawa, ON, 2012 [Available from: https://www.canada.ca/en/health-canada/services/consumer-product-safety/reports-publications/industry-professionals/industry-guide-safety-requirements-children-toys-related-products-summary.html.
United States Environmental Protection Agency (EPA), 2011. Exposure Factors Handbook; National Center for Environmental Assessment. EPA/600/R-09/052f; Chapter 17.
Lesinskiene S, Lesinskaite A, Sambaras R, Karaliene V. Survey of drawing and art activities of preschoolers: Attitudes and experiences of parents. Health Educ Care. 2018;3:1–4.
Stopford W National Family Opinion (NFO) Survey- email to Arts and Creative Materials Institute, unpublished. 1996.
Clarke PM, Fiebig DG, Gerdtham UG. Optimal recall length in survey design. J Health Econ. 2008;27:1275–84.
Kjellsson G, Clarke P, Gerdtham UG. Forgetting to remember or remembering to forget: a study of the recall period length in health care survey questions. J Health Econ. 2014;35:34–46.
Revilla M, Ochoa C. Ideal and maximum length for a web survey. Int J Mark Res. 2017;59:557–65.
United States Census Bureau. National Population Totals and Components of Change: 2020-2021. Annual estimates of the residents population of the United States, regions, District of Columbia and Puerto Rico. [Available from: https://www.census.gov/data/datasets/time-series/demo/popest/2020s-national-total.html#par-textimage-1810472256].
United States Bureau of Labor Statistics, Occupational employment and wages, May 2020 (Elementary school teachers, except special education) 2020 [Available from: bls.gov/oes/current/oes252021.htm].
United States Environmental Protection Agency (EPA). Child-specific exposure scenarios examples (final report). U.S. Environmental Protection Agency, Washington, DC, EPA/600/R-14-217F,2014.
Salonen H, Salthammer T, Morawska L. Human exposure to ozone in school and office indoor environments. Environ Int. 2018;119:503–14.
European Chemicals Agency (ECHA). Dossier for ethanol. General population DNEL (Systemic-inhalation); General population DNEL (Acute-inhalation) [Available from: https://echa.europa.eu/brief-profile/-/briefprofile/100.000.526].
Agency for Toxic Substances and Disease Registry (ATSDR). 2022. Toxicological profile for acetone. Atlanta, GA: U.S. Department of Health and Human Services, Public Health Service. (Appendix A, p A-3) [Available from: https://www.atsdr.cdc.gov/ToxProfiles/tp21.pdf].
Agency for Toxic Substances and Disease Registry (ATSDR). 2020. Toxicological profile for 2-Butanone. Atlanta, GA: U.S. Department of Health and Human Services, Public Health Service. (Appendix A, p A-3) [Available from: https://www.atsdr.cdc.gov/ToxProfiles/tp29.pdf].
United States Environmental Protection Agency (EPA) 2003. Toxicological review of methyl ethyl ketone in support of summary information on the Integrated Risk Information System (IRIS). US EPA, Washington DC. September. p 83. [Available from: https://cfpub.epa.gov/ncea/iris/iris_documents/documents/toxreviews/0071tr.pdf].
Consumer Product Safety Improvement Act of 2008, Pub. L. No. 110–314 Stat. 122 Stat. 3016, U.S. (August 14, 2008).
Acknowledgements
This research paper is dedicated to the memory of Dr. Woodhall Stopford. His commitment to the multidisciplinary study of art materials and their safe use has led to far reaching health and safety benefits for consumers.
Funding
This survey was funded by The Art and Creative Materials Institute.
Author information
Authors and Affiliations
Contributions
All authors contributed equally to the preparation of this manuscript.
Corresponding author
Ethics declarations
Competing interests
The authors declare no competing interests.
Additional information
Publisher’s note Springer Nature remains neutral with regard to jurisdictional claims in published maps and institutional affiliations.
Supplementary information
Rights and permissions
Springer Nature or its licensor (e.g. a society or other partner) holds exclusive rights to this article under a publishing agreement with the author(s) or other rightsholder(s); author self-archiving of the accepted manuscript version of this article is solely governed by the terms of such publishing agreement and applicable law.
About this article

Cite this article
Prusiewicz, C., James, P.G., Kaplan, L. et al. Art and craft material use patterns by pre-school and elementary school children at home and school: a year long survey for refining exposure assessments. J Expo Sci Environ Epidemiol 33, 994–1003 (2023). https://doi.org/10.1038/s41370-023-00523-3
Received:
Revised:
Accepted:
Published:
Issue Date:
DOI: https://doi.org/10.1038/s41370-023-00523-3
Keywords
This article is cited by
-
Development of nationally representative exposure factor database for children’s products in Korea
Journal of Exposure Science & Environmental Epidemiology (2024)
