
Abstract
Rapid progress in the development of next-generation sequencing (NGS) technologies in recent years has provided many valuable insights into complex biological systems, ranging from cancer genomics to diverse microbial communities. NGS-based technologies for genomics, transcriptomics, and epigenomics are now increasingly focused on the characterization of individual cells. These single-cell analyses will allow researchers to uncover new and potentially unexpected biological discoveries relative to traditional profiling methods that assess bulk populations. Single-cell RNA sequencing (scRNA-seq), for example, can reveal complex and rare cell populations, uncover regulatory relationships between genes, and track the trajectories of distinct cell lineages in development. In this review, we will focus on technical challenges in single-cell isolation and library preparation and on computational analysis pipelines available for analyzing scRNA-seq data. Further technical improvements at the level of molecular and cell biology and in available bioinformatics tools will greatly facilitate both the basic science and medical applications of these sequencing technologies.
Introduction
Mapping genotypes to phenotypes is one of the long-standing challenges in biology and medicine, and a powerful strategy for tackling this problem is performing transcriptome analysis. However, even though all cells in our body share nearly identical genotypes, transcriptome information in any one cell reflects the activity of only a subset of genes. Furthermore, because the many diverse cell types in our body each express a unique transcriptome, conventional bulk population sequencing can provide only the average expression signal for an ensemble of cells. Increasing evidence further suggests that gene expression is heterogeneous, even in similar cell types1,2,3; and this stochastic expression reflects cell type composition and can also trigger cell fate decisions4,5. Currently, however, the majority of transcriptome analysis experiments continue to be based on the assumption that cells from a given tissue are homogeneous, and thus, these studies are likely to miss important cell-to-cell variability. To better understand stochastic biological processes, a more precise understanding of the transcriptome in individual cells will be essential for elucidating their role in cellular functions and understanding how gene expression can promote beneficial or harmful states.
The sequencing an entire transcriptome at the level of a single-cell was pioneered by James Eberwine et al.6 and Iscove and colleagues7, who expanded the complementary DNAs (cDNAs) of an individual cell using linear amplification by in vitro transcription and exponential amplification by PCR, respectively. These technologies were initially applied to commercially available, high-density DNA microarray chips8,9,10,11 and were subsequently adapted for single-cell RNA sequencing (scRNA-seq). The first description of single-cell transcriptome analysis based on a next-generation sequencing platform was published in 2009, and it described the characterization of cells from early developmental stages12. Since this study, there has been an explosion of interest in obtaining high-resolution views of single-cell heterogeneity on a global scale. Critically, assessing the differences in gene expression between individual cells has the potential to identify rare populations that cannot be detected from an analysis of pooled cells. For example, the ability to find and characterize outlier cells within a population has potential implications for furthering our understanding of drug resistance and relapse in cancer treatment13. Recently, substantial advances in available experimental techniques and bioinformatics pipelines have also enabled researchers to deconvolute highly diverse immune cell populations in healthy and diseased states14. In addition, scRNA-seq is increasingly being utilized to delineate cell lineage relationships in early development15, myoblast differentiation16, and lymphocyte fate determination17. In this review, we will discuss the relative strengths and weaknesses of various scRNA-seq technologies and computational tools and highlight potential applications for scRNA-seq methods.
Single-cell isolation techniques
Single-cell isolation is the first step for obtaining transcriptome information from an individual cell. Limiting dilution (Fig. 1a) is a commonly used technique in which pipettes are used to isolate individual cells by dilution. Typically, one can achieve only about one-third of the prepared wells in a well plate when diluting to a concentration of 0.5 cells per aliquot. Due to this statistical distribution of cells, this method is not very efficient. Micromanipulation (Fig. 1b) is the classical method used to retrieve cells from early embryos or uncultivated microorganisms18,19, and microscope-guided capillary pipettes have been utilized to extract single cells from a suspension. However, these methods are time-consuming and low throughput. More recently, flow-activated cell sorting (FACS, Fig. 1c) has become the most commonly used strategy20 for isolating highly purified single cells. FACS is also the preferred method when the target cell expresses a very low level of the marker. In this method, cells are first tagged with a fluorescent monoclonal antibody, which recognizes specific surface markers and enables sorting of distinct populations. Alternatively, negative selection is possible for unstained populations. In this case, based on predetermined fluorescent parameters, a charge is applied to a cell of interest using an electrostatic deflection system, and cells are isolated magnetically. The potential limitations of these techniques include the requirement for large starting volumes (difficulty in isolating cells from low-input numbers <10,000) and the need for monoclonal antibodies to target proteins of interest. Laser capture microdissection (Fig. 1d) utilizes a laser system aided by a computer system to isolate cells21 from solid samples.
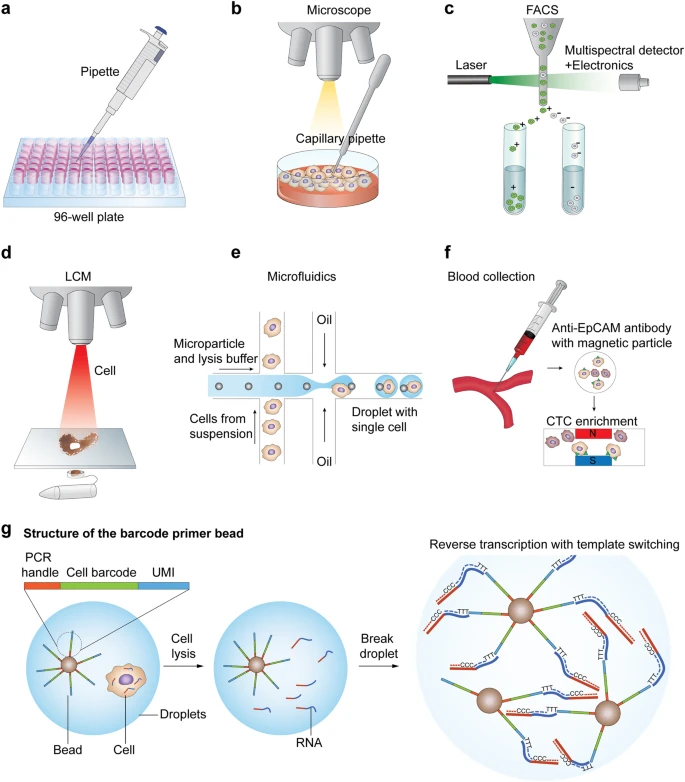
a The limiting dilution method isolates individual cells, leveraging the statistical distribution of diluted cells. b Micromanipulation involves collecting single cells using microscope-guided capillary pipettes. c FACS isolates highly purified single cells by tagging cells with fluorescent marker proteins. d Laser capture microdissection (LCM) utilizes a laser system aided by a computer system to isolate cells from solid samples. e Microfluidic technology for single-cell isolation requires nanoliter-sized volumes. An example of in-house microdroplet-based microfluidics (e.g., Drop-Seq). f The CellSearch system enumerates CTCs from patient blood samples by using a magnet conjugated with CTC binding antibodies. g A schematic example of droplet-based library generation. Libraries for scRNA-seq are typically generated via cell lysis, reverse transcription into first-strand cDNA using uniquely barcoded beads, second-strand synthesis, and cDNA amplification
Microfluidic technology (Fig. 1e) for single-cell isolation has gained popularity due to its low sample consumption and low analysis cost together with the fact that it enables precise fluid control22. Importantly, the nanoliter-sized volumes required for this technique substantially reduce the risk of external contamination. Microfluidics was initially utilized in a small number of biochemical assays for the analysis of DNA and proteins23,24,25. However, complex arrays have now been developed that permit individual control of valves and switches26,27, thus increasing their scalability. Notably, the rapid expansion of microfluidic technology in recent years has transformed the research capabilities of both basic scientists and clinicians. Applications of this technology include long-term analysis of single bacterial cells in a microfluidic bioreactor28 and the quantification of single-cell gene expression profiles in a highly parallel manner29. A widely used commercial platform, Fluidigm C1, provides automated single-cell lysis, RNA extraction, and cDNA synthesis for up to 800 cells in parallel on a single chip. This platform offers lower false positives and less bias than tube-based technologies. However, its major drawbacks include the number of cells (>1000) required for capture and the homogeneous size limit of the cells being analyzed. Another promising technique for single-cell isolation is microdroplet-based microfluidics30,31, which allows the monodispersion of aqueous droplets in a continuous oil phase. The lower volume required by this system compared to standard microfluidic chambers enables the manipulation and screening of thousands to millions of cells at a reduced cost. The commercial Chromium system from 10× Genomics offers high-throughput profiling of 3′ ends of RNAs of single cells with high capture efficiency. Consequently, this high-throughput processing method enables analysis of rare cell types in a sufficiently heterogeneous biological space. However, clinical samples must be handled with caution in order to establish an appropriate milieu that does not disturb existing cellular characteristics.
To isolate rare circulating tumor cells (CTCs), for example, CellSearch (the first clinically validated, Food and Drug Administration-cleared test) developed a system to enumerate CTCs in patient blood samples (Fig. 1f). This system uses a magnet conjugated with antibodies to detect CTCs of epithelial origin (CD45− and EpCAM+).
Comparative analysis for scRNA-seq library preparation
Common steps required for the generation of scRNA-seq libraries include cell lysis, reverse transcription into first-strand cDNA, second-strand synthesis, and cDNA amplification. In general, cells are lysed in a hypotonic buffer, and poly(A)+ selection is performed using poly(dT) primers to capture messenger RNAs (mRNAs) (Fig. 1g). It has been well established that due to Poisson sampling, only 10–20% of transcripts will be reverse transcribed at this stage32. This low mRNA capture efficiency is an important challenge that remains in existing scRNA-seq protocols and necessitates a highly efficient cell lysing strategy.
For cDNA preparation, an engineered version of the Moloney murine leukemia virus reverse transcriptase with low RNase H activity and increased thermostability is typically used in first-strand synthesis33,34. Second strands can be generated using either poly(A) tailing12,35 or by a template-switching mechanism36,37. This latter approach ensures uniform coverage without loss of strand-specificity compared to the former. The small amount of synthesized cDNAs is then further amplified using conventional PCR or in vitro transcription. The in vitro transcription method38,39 can amplify templates linearly but is time consuming, as it requires an additional reverse transcription, which may lead to 3′ coverage biases40. Smart-seq2 (improved version of Smart-seq)41 generates full-length transcripts and is thus suitable for the discovery of alternative-splicing events and allele-specific expression using single-nucleotide polymorphisms42. Currently, the Illumina platform is widely used (e.g., HiSeq4000 and NextSeq500) for the sequencing step. Particularly, the benchtop MiSeq sequencer provides rapid turnaround times, yielding ~30 million paired-end reads in a one day.
In-depth transcriptome analysis requires the profiling of a large number of cells. To cope with the associated sequencing costs, previous methods have focused on just the 5′ or 3′ ends of transcripts36,38. Recently, researchers have incorporated unique molecular identifiers (UMIs) or barcodes (random 4–8 bp sequences) in the reverse transcription step36,38,43. Considering that there are 105–106 mRNA molecules present in a single cell and >10,000 expressed genes, at least 4-bp UMIs (distinguishing 44 = 256 molecules) are required. Using this strategy, each read can be assigned to its original cell by effectively removing PCR bias and thus improving accuracy. These barcoding approaches leverage molecular counting and demonstrate better reproducibility than indirect quantification of molecules using sequencing read-based terminologies, such as RPKM/FPKM (read/fragment per kilobase per million mapped reads)32,44. However, current UMI tag-based approaches sequence either the 5′ or 3′ end of the transcript and are thus not suited for allele-specific expression or isoform usage. A comparison of representative scRNA-seq library generation methods is presented in Table 1.
Computational challenges in scRNA-seq
Although experimental methods for scRNA-seq are increasingly accessible to many laboratories, computational pipelines for handling raw data files remain limited. Some commercial companies provide software tools, such as 10× Genomics and Fluidigm, but this area remains in its infancy, and gold-standard tools have yet to be developed. In the sections below, we will discuss current bioinformatics tools available for the analysis of scRNA-seq data.
Pre-processing the data
Once reads are obtained from well-designed scRNA-seq experiments, quality control (QC) is performed. Of the existing QC tools available, FastQC (Babraham Institute, http://www.bioinformatics.babraham.ac.uk/projects/fastqc/) is a popular tool for inspecting quality distributions across entire reads. Low-quality bases (usually at the 3′ end) and adapter sequences can be removed at this pre-processing step. Read alignment is the next step of scRNA-seq analysis, and the tools available for this procedure, including the Burrows-Wheeler Aligner (BWA)45 and STAR46 are the same as those used in the bulk RNA-seq analysis pipeline. When UMIs are implemented, these sequences should be trimmed prior to alignment. The RNA-seQC47 program provides post-alignment summary stats, such as uniquely mapped reads, reads mapped to annotated exonic regions, and coverage patterns associated with specific library preparation protocols. When adding transcripts of known quantity and sequence (external spike-ins) for calibration and QC, a low-mapping ratio of endogenous RNA to spike-ins would be an indication of a low-quality library caused by RNA degradation or inefficiently lysed cells. A schematic overview of the single-cell analysis pipeline is described in Fig. 2.

scRNA-seq data are inherently noisy with confounding factors, such as technical and biological variables. After sequencing, alignment and de-duplication are performed to quantify an initial gene expression profile matrix. Next, normalization is performed with raw expression data using various statistical methods. Additional QC can be performed when using spike-ins by inspecting the mapping ratio to discard low-quality cells. Finally, the normalized matrix is then subjected to main analysis through clustering of cells to identify subtypes. Cell trajectories can be inferred based on these data and by detecting differentially expressed genes between clusters
After alignment, reads are allocated to exonic, intronic, or intergenic features using transcript annotation in General Transcript Format. Only reads that map to exonic loci with high mapping quality are considered for generation of the gene expression matrix (N (cells)×m (genes)). A distinctive feature of scRNA-seq data is the presence of zero-inflated counts due to reasons such as dropout or transient gene expression. To account for this feature, normalization must be performed; normalization is necessary to remove cell-specific bias, which can affect downstream applications (e.g., determination of differential gene expression).
The read count for a gene in each cell is expected to be proportional to the gene-specific expression level and cell-specific scaling factors (random). These nuisance variables, including capture and reverse transcription efficiency and cell-intrinsic factors, are usually difficult to estimate and are thus typically modeled as fixed factors. Although nuisance variables can be jointly estimated with expression counts for normalization48,49, fits are made to only a particular statistical model, and the procedure is computationally demanding. In practice, raw expression counts are normalized using scaling factor estimates by standardizing across cells, assuming that most genes are not differentially expressed. The most commonly used approaches include RPKM50, FPKM, and transcripts per kilobase million (TPM) (Fig. 3a, b)51. RPKM, for example, is calculated as (exonic read×109)/(exon length×total mapped read). The only difference between RPKM and FPKM is that FPKM considers the read count in one of the aligned mates if paired-end sequencing is performed. TPM is a modification of RPKM in which the sum of all TPMs in each sample is consistent across samples (exonic read×mean read length×106/exon length×total transcript). This approach makes comparisons of mapped reads for each gene easier than PKM/FPKM-based estimates because the sum of normalized reads in each sample is the same in TPM (Fig. 3c). These library-size-based normalization methods may be insufficient, however, when detecting differentially expressed genes. Consider the case when two genes are being expressed in two conditions (A and B). In condition A, the two genes are equally expressed, whereas in condition B, gene B has two-fold higher expression than gene A. If we convert this absolute expression into relative expression, one might conclude that gene A is differentially expressed, although this effect is only a consequence of its comparison with gene B (Fig. 3d). As observed previously52, if a particular set of mRNAs is highly expressed in one condition and not in the other, non-differentially genes may be falsely identified as consistently down-regulated.

a Reads per kilobase (RPK) is defined by multiplying the read counts of an isoform (i) by 1000 and dividing by isoform length. Reads per kilobase per million (RPKM) is defined to compare experiments or different samples (cells) so that additional normalization by the total fragment count is integrated in the denominator term, which is expressed in millions. b The metric TPM takes other isoforms into account, which contrasts with the RPKM metric. This metric quantifies the abundance of isoforms (i) using the RPK fraction across isoforms. c A schematic example illustrates the difference between the RPKM and TPM measures53. TPM is efficient for measuring relative abundance because total normalized reads are constant across different cells. d However, we should be careful to interpret the fact that differentially expressed genes can be falsely annotated as a result of overexpression of the other isoforms
To overcome the inherent problems in within-sample normalization methods, alternative approaches have been developed52,53,54,55. The trimmed mean of M-values (TMM) method and DESeq are the two most popular choices for between-sample normalization. The basic idea behind these frameworks is that highly variable genes dominate the counts, thus skewing the relative abundance in expression profiles. First, TMM picks reference samples, and the other samples are considered test samples. M-values for each gene are calculated as the genes’ log expression ratios between tests to the reference sample. Then, after excluding the genes with extreme M-values, the weighted average of these M-values is set for each test sample. Similar to TMM, DESeq calculates the scaling factor as the median of the ratios of each gene’s read count in the particular sample over its geometric mean across all samples. However, both approaches (TMM, DESeq) will perform poorly when a large number of zero counts are present. A normalization method based on pooling expression values56 were developed to avoid stochastic zero counts which is robust to differentially expressed genes in the data. The selection of highly variable genes is sensitive to normalization methods and therefore affects the analysis of data heterogeneity because most studies use highly variable genes to reduce dimensionality before clustering analysis. The potential for combining within-sample and between-sample normalization methods is largely unexplored and still an active area of research that will require rigorous testing.
After normalization, the next step is to estimate confounding factors. We know that observed read counts are affected by a combination of different factors, including biological variables and technical noise (Fig. 4). Critically, the small amount of starting material used in scRNA-seq may amplify the effects of technical noise. This amplification can be effectively countered using spike-ins, such as the ERCC Spike-In Mix from Ambion57, but some droplet-based applications43,58 cannot easily incorporate this system. Unlike conventional bulk RNA-seq, which compares differentially expressed genes under multiple conditions, in scRNA-seq experiments, cells from one condition are generally captured and sequenced (Fig. 4a). Therefore, batch effects, systematic differences that are unrelated to any biological variation and result from sample preparation conditions, are often prominent. Repeat analysis of multiple cells from a condition would aid in evaluating technical variability due to batch effects; however, this approach requires additional costs and labor. Furthermore, in addition to technical noise, biological variables (e.g., state, cycle, size, and apoptosis) may affect gene expression profiles. Recently, to address this issue, the scLVM59 method was developed and has been shown to be useful for removing the variation explained by latent variables. This method was applied to T cell differentiation to uncover unknown subpopulations and enabled the identification of correlated genes crucial for TH2 cell differentiation, which would have otherwise not been possible when cell cycle covariates are present (Fig. 4b). The management of known and unknown variables can also be addressed with complex statistical models (Fig. 4c) using linear combinations that incorporate random noise.

a Technical batch effects are a well-known problem in scRNA-seq when the experiment (condition) is conducted in different plates (environment). Cell-specific scaling factors, such as capture and RT efficiency, dropout/amplification bias, dilution factor, and sequencing amount, must be considered in the normalization step. b Single-cell latent variable model (scLVM) can effectively remove the variation explained by the cell-cycle effect. The clear separation is lost in scLVM-corrected expression data using PCA (visualization adapted from ref. 59). c The expression value y can be modeled as a linear combination of r technical and biological factors and k latent factors with a noise matrix
Cell type identification
Characterization of the numerous cells in the human body is a daunting task. As Kacser and Waddington60 noted in his metaphor for cellular plasticity, cells possess an enormous “landscape” of potential states that they can adopt over the course of development and in disease progression. However, few reliable markers exist for any given cell type, and hidden diversity remains even with well-established markers (e.g., cluster of differentiation (CD) markers in immune cells). To avoid the “the curse of dimensionality,” dimension reduction is typically performed after read count normalization in scRNA-seq experiments. Principal component analysis (PCA) is a widely used unsupervised linear dimensionality reduction method. By projecting cells into 2D space, we can easily visualize samples with increased interpretability (Fig. 5). Additional non-linear dimensionality reduction methods, such as t-distributed stochastic neighbor embedding (t-SNE)61, multidimensional scaling, locally linear embedding (LLE), and Isomap62,63,64, can also be utilized. t-SNE is implemented in the popular Cell Ranger pipeline (10× Genomics) and in Seurat (http://satijalab.org/seurat/) in the R package. Although LLE and Isomap demonstrate superior performance for microarray data65, these methods should be further evaluated in the context of scRNA-seq datasets. We further caution that dimension reduction may result in the loss important biological information.

Cells are living in a dynamic context interacting with their surrounding environment. PCA can be used to identify known and unknown cell clusters. Cell hierarchy reconstruction can be performed after 2D projection of normalized gene expression profiles. Decoding the regulatory network integrates pseudotime-inferred trajectories and clustering gene expression information in 2D space
Clustering is another useful method to detect low-quality cells by specifically identifying clusters that are enriched in mitochondrial (mt) genes. This approach is based on a study suggesting that mtDNA genes are upregulated66 and cytoplasmic RNA is lost when the cell membrane is ruptured. Once partitioning has been completed, the next step is to identify marker genes that are differentially expressed between different clusters. The simplest statistical model for count data would be Poisson, which uses only one parameter (variance = mean). To account for various sources of noise in single-cell data, however, a better fit can be obtained by using a Negative Binomial model (variance = mean + overdispersion×mean2; for most genes, overdispersion is >0). Alternatively, error models can be fitted to account for technical noise (e.g., dropout). The single-cell differential expression analysis platform67 uses a mixture of two probabilistic processes: one for transcripts that are properly amplified and correlated with their abundance and another for transcripts that are not amplified or detected. Notably, although mixture models provide advantages over unimodal models, heterogeneous cell distribution often produces bimodal distributions3.
Inferring regulatory networks
The elucidation of gene regulatory networks (GRNs) can enhance our understanding of complex cellular process in living cells, and these networks generally reveal regulatory interactions between genes and proteins (Fig. 5)68,69. It should be noted that GRN determination is not the final outcome of a biological study, but rather an intermediate bridge connecting genotypes and phenotypes. Previously, microarray-based bulk RNA-seq was utilized to uncover these networks70,71, although scRNA-seq has been more recently applied for this purpose72. Single-cell genomics have made it easier to infer GRNs, as typical experiments allow the capture of thousands of cells in one condition, which increases statistical power. However, GRN determination remains challenging due to intracellular heterogeneity and the vast number of gene–gene interactions.
Numerous computational algorithms have been developed to address the massive amount of gene expression data generated from bulk population analysis and uncover GRNs73. These methods can be categorized into machine learning-based74,75,76, co-expression-based77, model-based78,79, and information theory-based approaches. Co-expression-based approaches are perhaps the simplest method for identifying putative relationships, but these approaches are unable to model the precise dynamics of cellular systems. Model-based inference, such as Bayesian networks, uses many parameters and is time consuming. Additionally, probabilistic graphical models require searching for all possible paths for many genes, which is an NP-hard problem80. More recently, information theory-based methods utilizing mutual information and conditional mutual information have gained popularity because they are assumption-free and can measure non-linear associations between genes81.
From a single-cell view, the stochastic features of a single cell must be properly integrated into GRN models. As noted above, technical noise is difficult to distinguish from true biological variability, and the remaining variability is still poorly understood. However, the asynchronous nature of single-cell data, as well as the presence of multiple cell subtypes, may provide the inherent statistical variability required to detect putative regulatory relationships. Several notable methods have been developed to identify GRNs from single-cell data82,83,84, and these have been successfully applied to T cell biology, providing novel insights from co-expression analysis data85.
It is worth emphasizing that the detection of regulatory relationships should be possible in a reasonable timescale, as transcriptional changes do not persist forever. Further, the directionality between genes in identified networks must be validated and refined with perturbation studies or temporal data in order to infer causality.
Cell hierarchy reconstruction
Individual cells are continually undergoing dynamic processes and responding to various environmental stimuli. Some of these responses are fast, whereas others can be much slower and can occur over the course of many years (e.g., pathogenesis). This dynamic process is particularly reflected in a cell’s molecular profile, including RNA and protein content. To study genome-scale dynamic processes in bulk cells, the cells must be synchronized using sophisticated techniques86. In single-cell systems, however, cells are unsynchronized, which enables the capture of different instantaneous time points along an entire trajectory. We can then apply algorithms to reconstruct dynamic cellular trajectories with respect to differentiation or cell cycle progression (Table 2).
The concept of “pseudotime” was introduced in the Monocle16 algorithm, which measures a cell’s biological progression (Fig. 5). Here, the notion of “pseudotime” is different from “real time” because cells are sampled all at once. Maximum parsimony is the basic principle that infers cellular dynamics and has been widely used in phylogenetic tree reconstruction in evolutionary biology87,88. Monocle initially builds graphs in which the nodes represent cells and the edges correspond to each pair of cells. The edge weights are calculated based on the distance between cells in the matrix obtained from dimensionality reduction using independent component analysis (ICA). The minimum spanning tree (MST) algorithm is then applied to search for the longest backbone. The main limitation of these methods is that the constructed tree is highly complex, and therefore, the user must specify k branches to search. A more advanced version, Monocle289, has been recently proposed; this version is much faster and more robust than Monocle and incorporates unsupervised data-driven approaches utilizing reversed graph embedding techniques. For cases in which temporal information is available, supervised learning-based approaches can be more accurate. Single-cell clustering using bifurcation analysis (SCUBA)90, for example, implements bifurcation analysis and has been used to recover lineages during early development in mouse embryos from gene expression profiles at multiple time-point measurements.
scRNA-seq has also been successfully applied to reconstruct lineages during in vivo neurogenesis91,92. One adaptation of this technique, Div-Seq, bypasses the need for tissue dissociation by directly sequencing isolated nuclei. As enzymatic dissociation is known to disrupt RNA composition and compromise integrity, studying cells from complex tissues (e.g., brain) would have been impossible without this modification. Initial approaches for trajectory inference were based on linear paths; however, recent work has integrated the concept of branching93, which may be crucial for understanding dynamic cell systems. Lander and colleagues94 have recently proposed a more flexible probabilistic framework and utilized this approach to reconstruct known and unknown cell fate maps during the reprogramming of fibroblasts to induced pluripotent stem cells. We expect that additional biological insights gleaned from cell lineage determination or from experiments involving the perturbation of regulators at branching points will be valuable for enhancing our understanding of complex cellular systems. Even though the primary focus of this article is RNA-seq-based methods, we also note that cellular hierarchy can also be reconstructed from proteomic95,96 or epigenomic measures97.
Potential applications and future prospects
scRNA-seq is revolutionizing our fundamental understanding of biology, and this technique has opened up new frontiers of research that go beyond descriptive studies of cell states. One can imagine numerous exciting medical applications that can utilize this technology. Tumor heterogeneity is a common phenomenon that can occur both within and between tumors, and we expect that scRNA-seq can be applied to illuminate unknown tumor features that cannot be discerned from conventional bulk transcriptomic studies. For example, this technique could be used to assess transcriptional heterogeneity during the development of drug tolerance in cancer cells98 and to analyze the expression profiles of specific pathways (Fig. 6a). In this way, scRNA-seq may help generate models of cancer evolution. Additionally, this technique could also be applied to reconstruct clonal and phylogenetic relationships between cells by modeling transcriptional kinetics99.

a Intratumor heterogeneity poses challenges in cancer genomics. scRNA-seq can tackle this problem by effectively identifying subgroups based on responsiveness in various contexts. b Liquid biopsy provides exciting opportunities, and scRNA-seq of CTCs could provide novel insights into biomarker characterization. c scRNA-seq can infer lineage information from the early developmental stage and can identify novel differential markers
Recently, the analysis of CTCs in blood has heralded a golden age of the “liquid biopsy,” highlighting the potential to utilize this DNA as a clinical diagnostic marker (Fig. 6b). It is likely that scRNA-seq can be used to discover coding mutations and fusion genes from CTCs. We further anticipate that RNA can be assessed as a part of routine clinical evaluation, and parallel measurements of both genomic and transcriptomic information in the same cell could elucidate the phenotypic consequences of DNA and RNA variants.
Lineage tracing is a long-standing fundamental question in biology aimed at understanding how a single-celled embryo gives rise to various cells types that are organized into complex tissue and organs (Fig. 6c). As a proof-of-concept, researchers at Caltech have recently developed a method using the sequential readout of mRNA levels in a single cell to reconstruct lineage phylogeny over many generations100. Another interesting potential application of scRNA-seq includes identifying genes involved in stem cell regulatory networks. We are just now starting to understand how stem cells are triggered to become functional cells, which is information that is essential for understanding the basic biological processes underlying human health and diseases.
As sequencing costs decrease, it will be possible to routinely analyze more than a million cells within the next 5 years101. The Human Cell Atlas102, which aims to map 35 trillion cells from the human body, has already started a few pilot studies. The initial plan is to sequence all RNA transcripts in 30 million to 100 million cells and then use gene expression profiles to classify and identify new cell types. It is anticipated, for example, that scRNA-seq of highly diverse immune system cells will deepen our understanding of their inherent heterogeneity, particularly regarding lymphocyte behavior. A study from the Broad Institute has further highlighted the utility of scRNA-seq by uncovering a subset of 18 seemingly identical immune cells that show stark differences in gene expression patterns from cell to cell14. Several emerging scRNA-seq studies have focused on deepening our understanding of cells in the brain103,104. It is likely that the information gleaned from these analyses can be utilized to identify novel pathways involved in neuro-related diseases, providing new therapeutic targets for biomarker discovery. We envision that future applications of scRNA-seq in biology and biomedical research will also provide novel insights into physiological structure–function relationships in various tissue and organs. Ultimately, with improvements in the availability of standardized bioinformatics pipelines, this work will reveal novel insights into biological systems and create new opportunities for therapeutic development.
Change history
27 May 2021
A Correction to this paper has been published: https://doi.org/10.1038/s12276-021-00615-w
References
Li, L. & Clevers, H. Coexistence of quiescent and active adult stem cells in mammals. Science 327, 542–545 (2010).
Huang, S. Non-genetic heterogeneity of cells in development: more than just noise. Development 136, 3853–3862 (2009).
Shalek, A. K. et al. Single cell RNA Seq reveals dynamic paracrine control of cellular variation. Nature 510, 363–369 (2014).
Eldar, A. & Elowitz, M. B. Functional roles for noise in genetic circuits. Nature 467, 167–173 (2010).
Maamar, H., Raj, A. & Dubnau, D. Noise in gene expression determines cell fate in Bacillus subtilis. Science 317, 526–529 (2007).
Eberwine, J. et al. Analysis of gene expression in single live neurons. Proc. Natl. Acad. Sci. USA 89, 3010–3014 (1992).
Brady, G., Barbara, M. & Iscove, N. N. Representative in vitro cDNA amplification from individual hemopoietic cells and colonies. Methods Mol. Cell Biol. 2, 17–25 (1990).
Klein, C. A. et al. Combined transcriptome and genome analysis of single micrometastatic cells. Nat. Biotechnol. 20, 387–392 (2002).
Kurimoto, K. et al. An improved single-cell cDNA amplification method for efficient high-density oligonucleotide microarray analysis. Nucleic Acids Res. 34, e42–e42 (2006).
Xie, D. et al. Rewirable gene regulatory networks in the preimplantation embryonic development of three mammalian species. Genome Res. 20, 804–815 (2010).
Tietjen, I. et al. Single-cell transcriptional analysis of neuronal progenitors. Neuron 38, 161–175 (2003).
Tang, F. et al. mRNA-Seq whole-transcriptome analysis of a single cell. Nat. Methods 6, 377–382 (2009).
Shaffer, S. M. et al. Rare cell variability and drug-induced reprogramming as a mode of cancer drug resistance. Nature 546, 431–435 (2017).
Shalek, A. K. et al. Single-cell transcriptomics reveals bimodality in expression and splicing in immune cells. Nature 498, 236–240 (2013).
Petropoulos, S. et al. Single-cell RNA-Seq reveals lineage and X chromosome dynamics in human preimplantation embryos. Cell 167, 285 (2016).
Trapnell, C. et al. Pseudo-temporal ordering of individual cells reveals dynamics and regulators of cell fate decisions. Nat. Biotechnol. 32, 381–386 (2014).
Stubbington, M. J. T. et al. T cell fate and clonality inference from single cell transcriptomes. Nat. Methods 13, 329–332 (2016).
Brehm-Stecher, B. F. & Johnson, E. A. Single-cell microbiology: tools, technologies, and applications. Microbiol. Mol. Biol. Rev. 68, 538–559 (2004).
Guo, F. et al. Single-cell multi-omics sequencing of mouse early embryos and embryonic stem cells. Cell Res. 27, 967–988 (2017).
Julius, M. H., Masuda, T. & Herzenberg, L. A. Demonstration that antigen-binding cells are precursors of antibody-producing cells after purification with a fluorescence-activated cell sorter. Proc. Natl. Acad. Sci. USA 69, 1934–1938 (1972).
Nichterwitz, S. et al. Laser capture microscopy coupled with Smart-seq2 for precise spatial transcriptomic profiling. Nat. Commun. 7, 12139 (2016).
Whitesides, G. M. The origins and the future of microfluidics. Nature 442, 368–373 (2006).
Jacobson, S. C., Culbertson, C. T. & Ramsey, J. M. High-efficiency, two-dimensional separations of protein digests on microfluidic devices. Anal. Chem. 75, 3758–3764 (2003).
Khandurina, J. et al. Integrated system for rapid PCR-based DNA analysis in microfluidic devices. Anal. Chem. 72, 2995–3000 (2000).
Lagally, E. T., Medintz, I. & Mathies, R. A. Single-molecule DNA amplification and analysis in an integrated microfluidic device. Anal. Chem. 73, 565–570 (2001).
Thorsen, T., Maerkl, S. J. & Quake, S. R. Microfluidic large-scale integration. Science 298, 580–584 (2002).
Chiu, D. T., Pezzoli, E., Wu, H., Stroock, A. D. & Whitesides, G. M. Using three-dimensional microfluidic networks for solving computationally hard problems. Proc. Natl. Acad. Sci. USA 98, 2961–2966 (2001).
Balagaddé, F. K., You, L., Hansen, C. L., Arnold, F. H. & Quake, S. R. Long-term monitoring of bacteria undergoing programmed population control in a microchemostat. Science 309, 137–140 (2005).
Marcus, J. S., Anderson, W. F. & Quake, S. R. Microfluidic single-cell mRNA isolation and analysis. Anal. Chem. 78, 3084–3089 (2006).
Thorsen, T., Roberts, R. W., Arnold, F. H. & Quake, S. R. Dynamic pattern formation in a vesicle-generating microfluidic device. Phys. Rev. Lett. 86, 4163–4166 (2001).
Utada, A. S. et al. Monodisperse double emulsions generated from a microcapillary device. Science 308, 537–541 (2005).
Islam, S. et al. Quantitative single-cell RNA-seq with unique molecular identifiers. Nat. Methods 11, 163–166 (2014).
Arezi, B. & Hogrefe, H. Novel mutations in Moloney murine leukemia virus reverse transcriptase increase thermostability through tighter binding to template-primer. Nucleic Acids Res. 37, 473–481 (2009).
Gerard, G. F. et al. The role of template-primer in protection of reverse transcriptase from thermal inactivation. Nucleic Acids Res. 30, 3118–3129 (2002).
Sasagawa, Y. et al. Quartz-Seq: a highly reproducible and sensitive single-cell RNA sequencing method, reveals non-genetic gene-expression heterogeneity. Genome Biol. 14, R31–R31 (2013).
Islam, S. et al. Characterization of the single-cell transcriptional landscape by highly multiplex RNA-seq. Genome Biol. 21, 1160–1167 (2011).
Ramsköld, D. et al. Full-Length mRNA-Seq from single cell levels of RNA and individual circulating tumor cells. Nat. Biotechnol. 30, 777–782 (2012).
Hashimshony, T., Wagner, F., Sher, N. & Yanai, I. CEL-Seq: single-cell RNA-Seq by multiplexed linear amplification. Cell Rep. 2, 666–673 (2012).
Jaitin, D. A. et al. Massively parallel single cell RNA-Seq for marker-free decomposition of tissues into cell types. Science 343, 776–779 (2014).
Morris, J., Singh, J. M. & Eberwine, J. H. Transcriptome analysis of single cells. J. Vis. Exp. 50, 2634 (2011).
Picelli, S. et al. Smart-seq2 for sensitive full-length transcriptome profiling in single cells. Nat. Methods 10, 1096–1098 (2013).
Deng, Q., Ramsköld, D., Reinius, B. & Sandberg, R. Single-cell RNA-seq reveals dynamic, random monoallelic gene expression in mammalian cells. Science 343, 193–196 (2014).
Macosko, E. Z. et al. Highly parallel genome-wide expression profiling of individual cells using nanoliter droplets. Cell 161, 1202–1214 (2015).
Grün, D., Kester, L. & van Oudenaarden, A. Validation of noise models for single-cell transcriptomics. Nat. Methods 11, 637–640 (2014).
Li, H. & Durbin, R. Fast and accurate long-read alignment with Burrows–Wheeler transform. Bioinformatics 26, 589–595 (2010).
Dobin, A. et al. STAR: ultrafast universal RNA-seq aligner. Bioinformatics 29, 15–21 (2013).
DeLuca, D. S. et al. RNA-SeQC: RNA-seq metrics for quality control and process optimization. Bioinformatics 28, 1530–1532 (2012).
Vallejos, C. A., Marioni, J. C. & Richardson, S. BASiCS: Bayesian Analysis of Single-Cell Sequencing Data. PLoS Comput. Biol. 11, e1004333 (2015).
Risso, D., Ngai, J., Speed, T. P. & Dudoit, S. Normalization of RNA-seq data using factor analysis of control genes or samples. Nat. Biotechnol. 32, 896–902 (2014).
Mortazavi, A., Williams, B. A., McCue, K., Schaeffer, L. & Wold, B. Mapping and quantifying mammalian transcriptomes by RNA-seq. Nat. Methods 5, 621–628 (2008).
Li, B., Ruotti, V., Stewart, R. M., Thomson, J. A. & Dewey, C. N. RNA-seq gene expression estimation with read mapping uncertainty. Bioinformatics 26, 493–500 (2010).
Robinson, M. D. & Oshlack, A. A scaling normalization method for differential expression analysis of RNA-seq data. Genome Biol. 11, R25–R25 (2010).
StatQuest.“RPKM, FPKM and TPM, Clearly Explained!!!” YouTube, Joshua Starmer, 9 Jul. 2015, https://youtu.be/TTUrtCY2k-w (2015).
Anders, S. & Huber, W. Differential expression analysis for sequence count data. Genome Biol. 11, R106–R106 (2010).
Li, J., Witten, D. M., Johnstone, I. M. & Tibshirani, R. Normalization, testing, and false discovery rate estimation for RNA-sequencing data. Biostatistics 13, 523–538 (2012).
Lun, A. T., Bach, K. & Marioni, J. C. Pooling across cells to normalize single-cell RNA sequencing data with many zero counts. Genome Biol. 17, 75 (2016).
Brennecke, P. et al. Accounting for technical noise in single-cell RNA-seq experiments. Nat. Methods 10, 1093–1095 (2013).
Klein, A. M. et al. Droplet barcoding for single cell transcriptomics applied to embryonic stem cells. Cell 161, 1187–1201 (2015).
Buettner, F. et al. Computational analysis of cell-to-cell heterogeneity in single-cell RNA-sequencing data reveals hidden subpopulations of cells. Nat. Biotechnol. 33, 155–160 (2015).
Kacser, H. & Waddington, C. H. The Strategy of the Genes: A Discussion of Some Aspects of Theoretical Biology (Routledge, London, UK, 1957).
van der Maaten, L. J. P. & Hinton, G. E. Visualizing high-dimensional data using t-SNE. J. Mach. Learn. Res. 9, 2579–2605 (2008).
Attneave, F. Dimensions of similarity. Am. J. Psychol. 63, 516–556 (1950).
Tenenbaum, J. B., Silva, V. D. & Langford, J. C. A global geometric framework for nonlinear dimensionality reduction. Science 290, 2319 (2000).
Roweis, S. T. & Saul, L. K. Nonlinear dimensionality reduction by locally linear embedding. Science 290, 2323–2326 (2000).
Bartenhagen, C., Klein, H.-U., Ruckert, C., Jiang, X. & Dugas, M. Comparative study of unsupervised dimension reduction techniques for the visualization of microarray gene expression data. BMC Bioinforma. 11, 567–567 (2010).
Ilicic, T. et al. Classification of low quality cells from single-cell RNA-seq data. Genome Biol. 17, 29 (2016).
Kharchenko, P. V., Silberstein, L. & Scadden, D. T. Bayesian approach to single-cell differential expression analysis. Nat. Methods 11, 740–742 (2014).
Nachman, I., Regev, A. & Friedman, N. Inferring quantitative models of regulatory networks from expression data. Bioinformatics 20 (Suppl. 1), i248–i256 (2004).
Liang S., Fuhrman S., Somogyi R. Reveal, a general reverse engineering algorithm for inference of genetic network architectures. Pac. Symp. Biocomput. 3, 18–29 (1998).
Basso, K. et al. Reverse engineering of regulatory networks in human B cells. Nat. Genet. 37, 382–390 (2005).
Wille, A. et al. Sparse graphical Gaussian modeling of the isoprenoid gene network in Arabidopsis thaliana. Genome Biol. 5, R92–R92 (2004).
Matsumoto, H. et al. SCODE: an efficient regulatory network inference algorithm from single-cell RNA-Seq during differentiation. Bioinformatics 33, 2314–2321 (2017).
Hughes, T. R. et al. Functional discovery via a compendium of expression profiles. Cell 102, 109–126 (2000).
Kotera, M., Yamanishi, Y., Moriya, Y., Kanehisa, M. & Goto, S. GENIES: gene network inference engine based on supervised analysis. Nucleic Acids Res. 40, W162–W167 (2012).
Ernst, J. et al. A semi-supervised method for predicting transcription factor–gene interactions in Escherichia coli. PLoS Comput. Biol. 4, e1000044 (2008).
Mordelet, F. & Vert, J.-P. SIRENE: supervised inference of regulatory networks. Bioinformatics 24, i76–i82 (2008).
Eisen, M. B., Spellman, P. T., Brown, P. O. & Botstein, D. Cluster analysis and display of genome-wide expression patterns. Proc. Natl. Acad. Sci. USA 95, 14863–14868 (1998).
Shmulevich, I., Dougherty, E. R., Kim, S. & Zhang, W. Probabilistic Boolean Networks: a rule-based uncertainty model for gene regulatory networks. Bioinformatics 18, 261–274 (2002).
Friedman, N., Linial, M., Nachman, I. & Pe’er, D. Using Bayesian networks to analyze expression data. J. Comput. Biol. 7, 601–620 (2000).
Chickering, D. M., Heckerman, D. & Meek, C. Large-sample learning of Bayesian networks is NP-Hard. J. Mach. Learn. Res. 5, 1287–1330 (2005).
Zhang, X. et al. Inferring gene regulatory networks from gene expression data by path consistency algorithm based on conditional mutual information. Bioinformatics 28, 98–104 (2012).
Moignard, V. et al. Decoding the regulatory network for blood development from single-cell gene expression measurements. Nat. Biotechnol. 33, 269–276 (2015).
Ocone, A., Haghverdi, L., Mueller, N. S. & Theis, F. J. Reconstructing gene regulatory dynamics from high-dimensional single-cell snapshot data. Bioinformatics 31, i89–i96 (2015).
Buganim, Y. et al. Single-cell gene expression analyses of cellular reprogramming reveal a stochastic early and hierarchic late phase. Cell 150, 1209–1222 (2012).
Mahata, B. et al. Single-Cell RNA sequencing reveals T helper cells synthesizing steroids de novo to contribute to immune homeostasis. Cell Rep. 7, 1130–1142 (2014).
Bar-Joseph, Z., Gitter, A. & Simon, I. Studying and modelling dynamic biological processes using time-series gene expression data. Nat. Rev. Genet. 13, 552–564 (2012).
Martens, M. et al. Advantages of multilocus sequence analysis for taxonomic studies: a case study using 10 housekeeping genes in the genus Ensifer (including former Sinorhizobium). Int. J. Syst. Evol. Microbiol. 58, 200–214 (2008).
Wapinski, I., Pfeffer, A., Friedman, N. & Regev, A. Natural history and evolutionary principles of gene duplication in fungi. Nature 449, 54–61 (2007).
Qiu, X. et al. Reversed graph embedding resolves complex single-cell trajectories. Nat. Methods 14, 979–982 (2017).
Marco, E. et al. Bifurcation analysis of single-cell gene expression data reveals epigenetic landscape. Proc. Natl. Acad. Sci. USA 111, E5643–E5650 (2014).
Habib, N. et al. Div-Seq: single nucleus RNA-Seq reveals dynamics of rare adult newborn neurons. Science 353, 925–928 (2016).
Berg, D. A. et al. Single-cell RNA-Seq with waterfall reveals molecular cascades underlying adult neurogenesis. Cell Stem Cell 17, 360–372 (2015).
Haghverdi, L., Büttner, M., Wolf, F. A., Buettner, F. & Theis, F. J. Diffusion pseudotime robustly reconstructs lineage branching. Nat. Methods 13, 845–848 (2016).
Schiebinger, G. et al. Reconstruction of developmental landscapes by optimal-transport analysis of single-cell gene expression sheds light on cellular reprogramming. bioRxiv https://doi.org/10.1101/191056, (2017).
Bendall, S. C. et al. Single-cell trajectory detection uncovers progression and regulatory coordination in human B cell development. Cell 157, 714–725 (2014).
Setty, M. et al. Wishbone identifies bifurcating developmental trajectories from single-cell data. Nat. Biotechnol. 34, 637–645 (2016).
Welch, J. D., Hartemink, A. J. & Prins, J. F. MATCHER: manifold alignment reveals correspondence between single cell transcriptome and epigenome dynamics. Genome Biol. 18, 138 (2017).
Kim, K.-T. et al. Single-cell mRNA sequencing identifies subclonal heterogeneity in anti-cancer drug responses of lung adenocarcinoma cells. Genome Biol. 16, 127 (2015).
Müller, S. et al. Single‐cell sequencing maps gene expression to mutational phylogenies in PDGF‐ and EGF‐driven gliomas. Mol. Syst. Biol. 12, 889 (2016).
Frieda, K. L. et al. Synthetic recording and in situ readout of lineage information in single cells. Nature 541, 107–111 (2017).
Svensson, V., Vento-Tormo, R. & Teichmann, S. A. Exponential scaling of single-cell RNA-seq in the past decade. Nat. Protoc. 13, 599–604 (2018).
Regev, A. et al. The Human Cell Atlas. eLife 6, e27041 (2017).
La Manno, G. et al. Molecular diversity of midbrain development in mouse, human, and stem cells. Cell 167, 566–580, e19 (2016).
Lake, B. B. et al. Neuronal subtypes and diversity revealed by single-nucleus RNA sequencing of the human brain. Science 352, 1586–1590 (2016).
Acknowledgements
This work was supported by a National Research Foundation of Korea (NRF) Grant funded by the Korean Government (MSIP) (NRF-2016R1A5A2008630); Mid-career Researcher Program (2015R1A2A1A10055972); and Bio & Medical Technology Development Program (NRF-2016M3A9B6948494) through the National Research Foundation of Korea funded by the Ministry of Science, ICT, and Future Planning. We also thank Tae Won Yun for assistance with figure illustrations.
Author information
Authors and Affiliations
Corresponding authors
Ethics declarations
Conflict of interest
The authors declare that they have no conflict of interest.
Additional information
Publisher's note: Springer Nature remains neutral with regard to jurisdictional claims in published maps and institutional affiliations.
The original online version of this article was revised: After online publication of this article, the authors noticed an error in the missing reference section for the Figure 3c.
Rights and permissions
Open Access This article is licensed under a Creative Commons Attribution-NonCommercial-NoDerivatives 4.0 International License, which permits any non-commercial use, sharing, distribution and reproduction in any medium or format, as long as you give appropriate credit to the original author(s) and the source, and provide a link to the Creative Commons license. You do not have permission under this license to share adapted material derived from this article or parts of it. The images or other third party material in this article are included in the article’s Creative Commons license, unless indicated otherwise in a credit line to the material. If material is not included in the article’s Creative Commons license and your intended use is not permitted by statutory regulation or exceeds the permitted use, you will need to obtain permission directly from the copyright holder. To view a copy of this license, http://creativecommons.org/licenses/by-nc-nd/4.0/.
About this article

Cite this article
Hwang, B., Lee, J.H. & Bang, D. Single-cell RNA sequencing technologies and bioinformatics pipelines. Exp Mol Med 50, 1–14 (2018). https://doi.org/10.1038/s12276-018-0071-8
Received:
Accepted:
Published:
Issue Date:
DOI: https://doi.org/10.1038/s12276-018-0071-8
This article is cited by
-
The implications of single-cell RNA-seq analysis in prostate cancer: unraveling tumor heterogeneity, therapeutic implications and pathways towards personalized therapy
Military Medical Research (2024)
-
Recent advances in endothelial colony-forming cells: from the transcriptomic perspective
Journal of Translational Medicine (2024)
-
Split Pool Ligation-based Single-cell Transcriptome sequencing (SPLiT-seq) data processing pipeline comparison
BMC Genomics (2024)
-
Genome assembly of Melilotus officinalis provides a new reference genome for functional genomics
BMC Genomic Data (2024)
-
Identification of a new gene signature for prognostic evaluation in cervical cancer: based on cuproptosis-associated angiogenesis and multi-omics analysis
Cancer Cell International (2024)
