
Abstract
Recombinant human erythropoietin (rEpo) is neuroprotective in neonatal models of brain injury. Proposed mechanisms of neuroprotection include activation of gene pathways that decrease oxidative injury, inflammation, and apoptosis, while increasing vasculogenesis and neurogenesis. To determine the effects of rEpo on gene expression in 10-d-old BALB-c mice with unilateral brain injury, we compared microarrays from the hippocampi of brain-injured pups treated with saline or rEpo to similarly treated sham animals. Total RNA was extracted 24 h after brain injury and analyzed using Affymetrix GeneChip Mouse Exon 1.0 ST Arrays. We identified sex-specific differences in hippocampal gene expression after brain injury and after high-dose rEpo treatment using single-gene and gene set analysis. Although high-dose rEpo had minimal effects on hippocampal gene expression in shams, at 24-h post brain injury, high-dose rEpo treatment significantly decreased the proinflammatory and antiapoptotic response noted in saline-treated brain-injured comparison animals.
Main
Hypoxia-ischemia (HI) is the most common cause of brain injury in the neonate. HI results in a complex cascade of events that includes energy failure, ionic disruption, inflammation, free radical generation, and subsequent cell death. The response to HI-induced brain injury is region-specific and developmentally determined (1). Treatment options are currently limited. Understanding the specific changes in gene expression associated with HI may allow for the formulation of new treatment strategies.
High-dose recombinant erythropoietin (rEpo) has neuroprotective effects in neonatal models of brain injury (2–4). The mechanism of rEpo neuroprotection is complex and not fully understood. There is evidence that both neuronal (direct) and nonneuronal (indirect) factors are involved. Direct effects include Epo receptor-mediated increases in antiapoptotic gene expression (5) and promotion of neurogenesis (6–8). Indirect effects include an increase in antioxidant activity in astrocytes (9,10) and a decrease in the inflammatory response to injury (11,12). Epo also increases the utilization of iron for erythropoiesis, which may decrease the oxidative consequences of HI injury. The vasculogenic effects of rEpo may also improve long-term healing from such an injury (8,13).
Microarray technology is a powerful tool suitable for the elucidation of mechanisms underlying complex biologic processes such as rEpo neuroprotection. Recognizing that gene expression-based microarray technologies have rapidly advanced and that new bioinformatics software provides improved normalization, transformation, visualization, cluster analysis, and annotation, we now extend our examination of rEpo-induced changes in hippocampal gene expression in the context of brain injury. In our previous study, we examined pooled triplicate samples from three brain regions, at three time points, with male and female samples combined (14). We now focus on hippocampal gene expression 24 h after HI-induced injury using individual RNA samples from six replicates. This allows for assessment of interanimal variability as well as gender differences in response to injury and treatment. The goals for this study were first to define the pattern of hippocampal gene expression evident 24 h after HI, then to determine specific changes in expression associated with rEpo treatment, and finally, to compare the responses between males and females. These experiments were necessary to generate a more precise understanding of the neuroprotective mechanisms underlying neonatal rEpo therapy.
METHODS
Animal methods.
All experimental protocols were approved by the Animal Care and Use Committees at the University of Washington in accordance with U.S. National Institutes of Health guidelines. Animals were housed with a 12-h light/dark cycle and fed ad libitum. All pups were weighed and distributed to create weight-matched litters (n = 5–7/dam).
Treatment groups.
Four groups of BALB-c mice (Harlan, Kent, WA) were studied: sham-vehicle (S) n = 6, sham-rEpo (E), n = 6, brain-injury-vehicle (I), n = 28, and brain-injury-rEpo (EI), n = 24. For the microarray portion of the study, six animals were studied per group.
Brain injury.
Using 2.5% isoflurane anesthesia, the right carotid artery of 10-d-old mice were cauterized. Animals were recovered for 30 min and then returned to their dam for 1 h. They were next exposed to 8% oxygen × 15 min alternating with 100% oxygen × 10 min for a total of 45 min of hypoxia and 20 min of hyperoxia at 35°C. Animals received either vehicle or rEpo 5000 U/kg (Procrit, Amgen, Thousand Oaks, CA). The first injection was given 30 min after the completion of hypoxia and the second was given 18 h later. Pups were euthanized 24 h after injury by an overdose (75 mg/kg) of Euthasol i.p. (Delmarva Labs, Midlothian, VA).
Assessment of brain injury.
Gross brain injury in the hemisphere ipsilateral to ligation was assessed on a five point ordinal scale (0–4) as follows: 0 = no injury, 1 = mild injury with < 25% lesion of ipsilateral hemisphere, 2 = 25–50% lesion, 3 = 51–75%, and 4 = ≥75% injury. Groups were compared using a two-tailed t test.
In a subset of animals, 2,3,5-triphenyltetrazolium chloride (TTC) staining was used to document subcortical brain injury on 2-mm coronal brain sections cut using a mouse brain grid. Sections were incubated in 2% TTC in 0.9% PBS for 30 min at 37°C, fixed with 10% formalin, rinsed in PBS, and photographed.
RNA methods.
RNA from the right hippocampus was isolated following manufactures' directions (Cartagen Molecular Systems, San Carlos, CA). The quality of RNA was evaluated using an Agilent 2100 Bioanalyzer (Agilent Technologies, Palo Alto, CA). Only RNA samples with appropriate size distribution, quantity, and an A260:A280 ratio of 1.8–2.1 were used for analysis.
Microarray processing.
The manufacturer's protocols for the GeneChip platform by Affymetrix (Santa Clara, CA) were used. Methods included synthesis of first- and second-strand cDNAs, the purification of double-stranded cDNA, synthesis of cRNA by in vitro transcription, recovery and quantitation of biotin-labeled cRNA, fragmentation of this cRNA and subsequent hybridization to the microarray slide, posthybridization washings, and detection of the hybridized cRNAs using a streptavidin-coupled fluorescent dye. Hybridized Affymetrix arrays were scanned with an Affymetrix GeneChip 3000 scanner. Image generation and feature extraction were performed using Affymetrix GCOS Software.
Statistical analysis and data normalization for Affymetrix Mouse Exon 1.0 ST Arrays.
Raw microarray data were processed with Bioconductor (15), and exonic probe sets (16) were analyzed. Probes were normalized with Robust Multi-Array (RMA) (17,18). From the normalized data, genes with significant evidence for differential expression were identified using the Bioconductor limma package (19). The p values were calculated with a modified t test in conjunction with an empirical Bayes method to moderate the standard errors of the estimated log-fold changes. The p values were adjusted for multiplicity with the Bioconductor package q-value (20), which allows for selecting statistically significant genes while controlling the estimated false discovery rate.
Single gene analysis.
We defined groups of genes which were most protected by rEpo treatment and those which were least protected. Conceptually, the most protected genes are genes whose expression is highly changed by brain injury, but whose expression in the presence of rEpo plus conditions, which stimulate brain injury, revert to baseline (sham) expression levels. Least protected genes are genes whose expression changes with brain injury and for which rEpo has little or no effect. These concepts are defined mathematically by comparing our four treatment groups as shown in Table 1. Baseline gene expression in the sham vehicle-treated group (S) is denoted as μ. The addition of rEpo to sham is denoted as μ + α, where α is the additional effect of rEpo. The addition of injury (I) to baseline gene expression is denoted as μ + β, where β is the additional effect of injury. Finally, in the rEpo-treated brain-injured group (EI), which has effects of both rEpo and injury, we denote the expression level as μ + α + β + γ, where γ is the interaction effect of rEpo and injury, which is the additional effect of rEpo and injury beyond what we would expect from rEpo or injury alone.
-
1
To calculate the effect of injury, β, we look at the difference between the two groups sham and injury, S and I. The differential gene expression given by the contrast I vs. S (|I–S| > log2(fold) and p < 0.05, or β > log2(fold)) tells us which genes are most changed by injury alone (Fig. 1, top left circle).
Figure 1 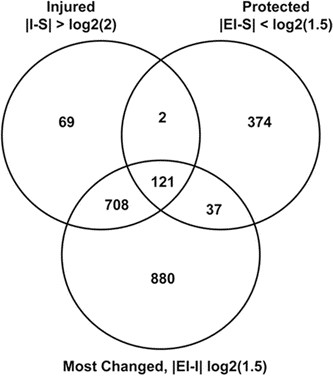
Venn Diagram. Venn diagram showing most protected genes by comparing the three contrasts and genes they have in common (p values <0.05).
-
2
For rEpo-treated injury, there are genes that are unchanged compared with the sham-vehicle-treated group. For this group of genes the sum α + β + γ is nearly zero. The differential gene expression for this group is given by the contrast EI vs. S (|EI–S| < log2(fold) and p < 0.05) and tells use which genes did not change much between the sham group and the rEpo-treated injury group (Fig. 1, top right circle).
-
3
For rEpo-treated injury, there are the injured genes that showed large differential gene expression changes. These genes may have been protected by the rEpo treatment to a large degree, but not enough so that the rEpo treatment made the genes look as if they were not injured. The differential gene expression given by the contrast EI vs. I (|EI–I| > log2(fold) and p < 0.05) tells us which genes changed the most between the injury group and rEpo-treated injury group (Fig. 1, bottom circle).

Gene set analysis.
To investigate categories of genes where the constituent genes show coordinated changes in expression over the experimental conditions, we used gene set analysis (GSA), a type of biologic category analysis (21,22). GSA software is available as R code (21,23) (http://www-stat.stanford.edu/~tibs/GSA/) to calculate separate gene set analyses. GSA considers all the genes in the experiment and allows for the identification of gene sets with strong cross-correlation by boosting the signal-to-noise ratio, making it possible to detect modest changes in gene expression. We used four gene sets for the GSA: Biologic process, molecular function, and cellular component from gene ontology (24), and the C2 gene set from the Molecular Signature Database (23) (http://www.broad.mit.edu/gsea/msigdb/msigdb_index.html).
RESULTS
rEpo treatment with 5000 U/kg i.p. improved the gross brain injury scores 24 h after brain injury. The mean ± SD injury scores for rEpo-treated brain-injured animals (n = 24) were 1.7 ± 1.8 with a median of 1, compared with vehicle-treated brain-injured (n = 28), 2.7 ± 1.9, median of 3.8 (p < 0.01). There were no differences between males and females. In the vehicle-treated animals, injury scores for males and females were 2.6 ± 2.1 and 2.8 ± 1.7, respectively. The rEpo-treated males and females had scores of 1.7 ± 1.9 and 1.6 ± 1.8, respectively. Gross brain injury scores tended to underestimate brain injury, because some animals demonstrated subcortical brain injury visualized with TTC that was not apparent grossly. In brains that were sequentially sliced and stained from anterior to posterior, it was noted that brain injury occurred most commonly in the posterior cortex of the ipsilateral hemisphere. Weight loss correlated with brain injury score, p < 0.001.
Single gene analysis.
Neonatal HI exposure altered hippocampal gene expression. Mean gross brain injury scores of animals used for microarray analysis were 3.9 for vehicle-treated brain injury, 0.4 for rEpo-treated brain injury, and 0 for all sham groups. Nine hundred genes in the hippocampus changed expression after brain injury by at least 2-fold, with p < 0.05 (I vs. S). Functional annotation is available for 800: 159 were down-regulated and 641 were up-regulated relative to shams. Examples of genes down-regulated by HI included serotonin receptors, neurogenic differentiation 6, G-coupled receptors, GABA receptors, gastrin, glutamate receptors AMPA1, kainite 4, NMDA2A, and solute carrier family genes such as solute carrier family 6 (neurotransmitter transporter). Genes up-regulated by HI included hypoxia-inducible factor 2, annexins 2, 4, and 5, angiopoietin related protein 4, caspases 4, 7, 8, 12, cathepsins B, C, D, L, S, and Z, multiple chemokines, death-associated protein, bag 3, BAX, colony stimulating factors, heat shock proteins 8 and B6, interferons, interleukins, toll-like receptors 1, 2, 4, 7, 13, tumor necrosis factor receptors, heme oxygenase, c-fos, and prostaglandin D2 synthase. The magnitude of change in the HI-exposed subset ranged from 5.6-fold for down-regulated genes to 276-fold for up-regulated genes.
We next identified genes which, in the context of brain injury, are most influenced (most protected) by rEpo. Figure 1 is a Venn diagram that shows the number of differentially expressed genes in three comparison groups, and how these groups overlap. The upper left circle (I vs. S) contains the 900 genes that responded to injury alone by changing their transcript levels >2-fold, p < 0.05 when compared with shams. The upper right circle (EI vs. S) illustrates the 534 genes whose expression was not different when rEpo-treated brain-injured animals were compared with sham animals (criterion <1.5-fold, p < 0.05). The bottom circle (EI vs. I) represents the 1746 genes whose expression changed significantly when rEpo-treated and vehicle-treated brain-injured animals were compared (criterion >1.5-fold, p < 0.05). The overlapping regions show the 92%, or 831 genes, which can be considered most protected by rEpo treatment in the context of brain injury. A subset of these genes are shown in Table 2, and the entire set is available in supplementary material, Table S1.
The magnitude of changes in gene expression in each of our conditions is visually represented in the composite ratio intensity plot, Fig. 2. Panel A shows the difference in gene expression when brain-injured vehicle-treated animals are compared with sham-operated vehicle-treated animals. The red dots represent the genes that are changed by more than 2-fold (p < 0.05). Panel B shows the treatment effects of rEpo in the brain-injured animals. In this comparison, rEpo-treated brain-injured animals are compared with brain-injured vehicle-treated animals. The genes that were >2-fold changed by injury (Fig. 2, Panel A) are still shown in red; however, most of them now fall within the expression range of the uninjured animals. Thus, treatment of brain injury with rEpo caused the gene expression to look more like the shams. Panel C shows the effects of rEpo on hippocampal gene expression in the absence of brain injury. As in Panels A and B, the red colored data points track the genes that were changed >2-fold by injury (p < 0.05). There are relatively few changes in gene expression caused by rEpo alone; 62 genes were changed >1.5-fold (p < 0.05) and functional annotations are available for 39 of these. These rEpo-responsive genes include the following: Annexin A1 (Anxa1), Bone morphogenetic protein 4 precursor (Bmp4), C3a anaphylatoxin chemotactic receptor (C3AR), NFKB activating protein-like (Nkapl), Protein kinase C delta type (Prkcd), and Glycophorin (Gypa).

Ratio intensity plots. The horizontal axes show the average log2 signal as a measure of transcript signal intensity, and the vertical axis represents fold changes of transcript signals between the two comparison groups.
GSA analysis.
Using GSA, we next identified gene sets/pathways with concordant changes in expression in a given experimental condition. We defined most protected gene sets as those whose expression was altered dramatically by brain injury and rEpo prevented or attenuated this change to a large degree making it look like sham.
Table 3 shows selected gene sets enriched in HI hippocampus when compared with shams, whereas Table 4 shows gene sets enriched in sham hippocampus relative to brain-injured animals. Gene sets are ranked based on differences identified in the brain injury to sham comparison (I vs. S); all are p < 0.05. The rank scores for the I vs. S comparison are shown in the first column, followed by the p value. For comparison, the ranking of these gene sets in the EI vs. S analyses are also shown, as are their p values. Note that the p values were not significant in the EI vs. S comparison, demonstrating that expression of these gene sets was modified by rEpo treatment. A full listing of gene sets that met our filtering criteria is provided in supplementary material Table S2.
Many of the gene sets enriched after brain injury were related to inflammatory response, and they included neutrophil, monocyte, lymphocyte and T cell lines, cytokine, and chemokine-mediated signaling pathways, and genes important for phagocytosis. Gene sets having to do with growth factor binding; proteoglycan binding, cell-matrix interactions, and cell movement were also over-represented. As expected, gene sets involved with response to hypoxia were also enriched in brain-injured hippocampus. For example, in Figure 3, a heat map of the C2 gene set Hypoxia_Review is shown for our four treatment groups. Each column represents the gene expression for an individual animal, with animals grouped by treatment. Each row represents one gene within the gene set. Relative gene expression is denoted by color, with red illustrating gene expression that is higher than the mean in the control reference group, blue indicating the opposite and white indicating no change in expression. Expression levels for each gene are shown relative to the average expression of that gene in sham-vehicle animals. Sham-vehicle-treated animals are shown in the left grouping, followed sequentially by brain-injured-vehicle-treated animals, brain-injured-rEpo-treated animals, and finally, sham-rEpo-treated animals. This heat map shows the variability in gene expression between animals within each treatment group and the differences in gene expression between treatment groups in the context of the gene set. As expected, vehicle-treated animals exposed to HI show robust changes in gene expression within this gene set. Treatment of brain injury with rEpo restores gene expression to a pattern closer to shams. Sham-rEpo-treated animals are most similar to sham-vehicle-treated animals. In this particular gene set, hypoxic-ischemic brain injury is associated with increased gene expression of members including HIF-1α, HMOX1, IGFBP2, IGFBP3, TGFB1, IL-6, Fos, Jun, angiopoietin 2, and NFkB1.

Expression of C2 Hypoxia Review gene set. A composite heat map with rows representing specific genes contained in the C2 Hypoxia Review gene set and each column representing a distinct sample that are arranged by treatment group labeled across the bottom.
A similar pattern is identified in the gene set named Regulation of Inflammatory Response, with brain-injured animals showing marked up-regulation of transcription for a majority of genes in this family (Fig. 4). Hippocampus from rEpo-treated brain-injured animals shows a pattern of gene expression more similar to the shams, and rEpo treatment of shams does not significantly affect the overall transcription of these particular genes.

Expression of BP Regulation of Inflammatory Response gene set. A composite heat map comprised of rows representing genes contained in the BP Regulation of Inflammatory Response gene set and columns representing individual samples that are organized by treatment group, labeled along the bottom.
Gene sets in which expression was significantly decreased in brain-injured hippocampus relative to uninjured brain had largely to do with cell maintenance and growth. Pathways associated with lipid, phospholipid, and glycoprotein metabolism, amino acid and ion transport, and synaptic transmission were in this category. Expression of these gene sets in rEpo-treated brain-injured animals was more like the shams.
Male/female comparison.
To determine whether males respond differently to brain injury or to rEpo treatment than females, we carried out a limited subgroup analysis, comparing three males and three females in each group. In the brain injury versus sham (I vs. S) comparison using a 2-fold cutoff with p < 0.05, 955 genes were differentially expressed by males, compared with only 820 in females. Males also appeared to respond more to rEpo treatment than did females (EI vs. I contrast) with 2351 genes differentially expressed, compared with 1063 in females (1.5-fold change, p < 0.05). Females appeared more resistant to injury, and less affected by rEpo than males (EI vs. S contrast): males 148 genes, females 374.
DISCUSSION
The developing brain exhibits unique vulnerabilities that are age-dependent. In neonatal brain, excitatory synapses are denser, the vascular system is incomplete, the blood-brain barrier is more permeable, neurons are more predisposed to apoptosis, and oligodendrocytes are also more vulnerable to oxidative injury and death than in mature brain. Similarly, the immune response of preterm and term infants is immature, with an exaggerated TLR4-mediated IL-6 increase and decreased TNF-α when compared with older children or adults (25,26). The time course of the neonatal response to HI-induced brain injury also differs from the adult response. For this reason, we focused on the time point 24-h after injury to identify immediate consequences of HI-induced injury on gene expression and to identify whether repeated high-dose rEpo treatment (two daily doses) altered these early response mechanisms.
We found remarkably few effects of high-dose rEpo on gene expression in mouse hippocampus in the absence of brain injury. This may reflect the small proportion of circulating rEpo that crosses the blood-brain barrier in the absence of brain injury (27). This result corroborates our previous finding that Epo concentrations in homogenized injured brain were double that of the uninjured contralateral hemisphere (28). In contrast to the minor changes in gene expression caused by high-dose rEpo in sham controls, the effects of rEpo in the context of brain injury were large. Figure 2 shows that most genes up- or down-regulated by brain injury were largely normalized by rEpo treatment (92%). Although individual variations between animals in each group, and by sex were identified, the overall effects of rEpo were robust. These effects are expected because we intentionally compared the visibly brain-injured vehicle-treated mice to the visibly protected rEpo-treated mice in an effort to focus precisely on the genes underlying rEpo-mediated neuroprotection. This study was not designed to demonstrate the neuroprotective effectiveness of rEpo but, rather, to profile the patterns of gene expression associated with a neuroprotection phenotype.
Our most striking result was how profound the inflammatory response was to brain injury at 24 h. Gene sets related to all inflammatory cell lineages (monocytes, T cells, neutrophils, lymphocytes) were up-regulated by HI, as were mediators of inflammation; cytokines, chemokines, and complement. The frequency of changes in transporter gene expression was unexpected. Also surprising was the lack of angiopoietic gene expression in the rEpo-treated animals. This may indicate that the angiopoietic effects of rEpo after brain injury are delayed beyond 24 h and are thus less important for mitigating early injury than previously suspected.
Of interest, male animals showed more changes in gene expression because of injury than did females. Males also showed a more robust response to rEpo treatment. Clinically, we have not observed a difference in severity of brain injury in either treated or untreated animals short term, but we have not yet examined possible differences in long-term outcomes. Interpretation of the current dataset is limited by the small sample size.
Brain-injured animals treated with saline showed a 2-fold increase in HIF-2α. These data are consistent with previous reports showing that endogenous brain Epo production by astrocytes is up-regulated by hypoxia (29). Interestingly, rEpo treatment decreased this up-regulation, suggesting a possible feedback mechanism. We identified an up-regulation of HIF-1α, IL-1β, IL-6, and c-fos in the HI animals compared with the sham animals. This finding is consistent with other reports of HI-induced effects (11,14,30,31). In addition, the observed up-regulation of iNOS (NOS2) and an iNOS transcription-activating element, NF-κB, in the HI animals compared with the shams confirms prior immunohistological data (32).
In contrast, we did not confirm an up-regulation of neuronal pentraxin 1 (NP1) in the HI hippocampus, as has been reported by Hossain (33). This brain-specific protein is homologous to C-reactive and acute-phase proteins in the immune system and is thought to be important in excitatory synaptic remodeling. Our data showed an increase of NP1 gene expression in sham animals compared with HI animals. This discrepancy is likely due to differences in the details of the models used: age of the animals, timing of harvesting of RNA, and mechanism of injury.
In summary, we now confirm that repeated high-dose rEpo significantly alters gene expression to counter the effects of brain injury. It is important to continue investigation of rEpo as a neuroprotective agent and thereby provide additional insight into mechanisms of hypoxic-ischemic brain injury in neonatal mice.
Abbreviations
- EI:
-
brain injured, rEpo-treated
- GSA:
-
gene set analysis
- HI:
-
hypoxia-ischemia
- I:
-
brain injured, vehicle-treated
- rEpo:
-
recombinant human erythropoietin
- S:
-
sham, vehicle-treated
References
Zhu C, Wang X, Xu F, Bahr BA, Shibata M, Uchiyama Y, Hagberg H, Blomgren K 2005 The influence of age on apoptotic and other mechanisms of cell death after cerebral hypoxia-ischemia. Cell Death Differ 12: 162–176
Demers EJ, McPherson RJ, Juul SE 2005 Erythropoietin protects dopaminergic neurons and improves neurobehavioral outcomes in juvenile rats after neonatal hypoxia-ischemia. Pediatr Res 58: 297–301
Dzietko M, Felderhoff-Mueser U, Sifringer M, Krutz B, Bittigau P, Thor F, Heumann R, Buhrer C, Ikonomidou C, Hansen HH 2004 Erythropoietin protects the developing brain against N-methyl-d-aspartate receptor antagonist neurotoxicity. Neurobiol Dis 15: 177–187
Kellert BA, McPherson RJ, Juul SE 2007 A comparison of high-dose recombinant erythropoietin treatment regimens in brain-injured neonatal rats. Pediatr Res 61: 451–455
Digicaylioglu M, Lipton SA 2001 Erythropoietin-mediated neuroprotection involves cross-talk between Jak2 and NF-kappaB signalling cascades. Nature 412: 641–647
Wang L, Zhang Z, Wang Y, Zhang R, Chopp M 2004 Treatment of stroke with erythropoietin enhances neurogenesis and angiogenesis and improves neurological function in rats. Stroke 35: 1732–1737
Viviani B, Bartesaghi S, Corsini E, Villa P, Ghezzi P, Garau A, Galli CL, Marinovich M 2005 Erythropoietin protects primary hippocampal neurons increasing the expression of brain-derived neurotrophic factor. J Neurochem 93: 412–421
Iwai M, Cao G, Yin W, Stetler RA, Liu J, Chen J 2007 Erythropoietin promotes neuronal replacement through revascularization and neurogenesis after neonatal hypoxia/ischemia in rats. Stroke 38: 2795–2803
Kumral A, Gonenc S, Acikgoz O, Sonmez A, Genc K, Yilmaz O, Gokmen N, Duman N, Ozkan H 2005 Erythropoietin increases glutathione peroxidase enzyme activity and decreases lipid peroxidation levels in hypoxic-ischemic brain injury in neonatal rats. Biol Neonate 87: 15–18
Genc S, Akhisaroglu M, Kuralay F, Genc K 2002 Erythropoietin restores glutathione peroxidase activity in 1-methyl-4-phenyl-1,2,5,6-tetrahydropyridine-induced neurotoxicity in C57BL mice and stimulates murine astroglial glutathione peroxidase production in vitro. Neurosci Lett 321: 73–76
Sun Y, Calvert JW, Zhang JH 2005 Neonatal hypoxia/ischemia is associated with decreased inflammatory mediators after erythropoietin administration. Stroke 36: 1672–1678
Kumral A, Baskin H, Yesilirmak DC, Ergur BU, Aykan S, Genc S, Genc K, Yilmaz O, Tugyan K, Giray O, Duman N, Ozkan H 2007 Erythropoietin attenuates lipopolysaccharide-induced white matter injury in the neonatal rat brain. Neonatology 92: 269–278
Ribatti D, Vacca A, Roccaro AM, Crivellato E, Presta M 2003 Erythropoietin as an angiogenic factor. Eur J Clin Invest 33: 891–896
Juul SE, McPherson RJ, Bammler TK, Wilkerson J, Beyer RP, Farin FM 2008 Recombinant erythropoietin is neuroprotective in a novel mouse oxidative injury model. Dev Neurosci 30: 231–242
Gentleman RC, Carey VJ, Bates DM, Bolstad B, Dettling M, Dudoit S, Ellis B, Gautier L, Ge Y, Gentry J, Hornik K, Hothorn T, Huber W, Iacus S, Irizarry R, Leisch F, Li C, Maechler M, Rossini AJ, Sawitzki G, Smith C, Smyth G, Tierney L, Yang JY, Zhang J 2004 Bioconductor: open software development for computational biology and bioinformatics. Genome Biol 5: R80
Okoniewski MJ, Yates T, Dibben S, Miller CJ 2007 An annotation infrastructure for the analysis and interpretation of Affymetrix exon array data. Genome Biol 8: R79
Irizarry RA, Hobbs B, Collin F, Beazer-Barclay YD, Antonellis KJ, Scherf U, Speed TP 2003 Exploration, normalization, and summaries of high density oligonucleotide array probe level data. Biostatistics 4: 249–264
Irizarry RA, Gautier L, Cope L (eds) 2003 An R Package for Analyses of Affymetrix Oligonucleotide Arrays. Springer, London, pp 102–119
Smyth GK 2004 Linear models and empirical bayes methods for assessing differential expression in microarray experiments. Stat Appl Genet Mol Biol 3: 3
Tusher VG, Tibshirani R, Chu G 2001 Significance analysis of microarrays applied to transcriptional responses to ionizing radiation. Proc Natl Acad Sci USA 98: 5116–5121
Efron B, Tibshirani R 2006 On testing the significance of sets of genes. Ann Appl Stat 1: 107–129
Gentleman R, Carey VJ, Huber W, Irizarry RA, Dudoit S 2005 Bioinformatics and Computational Biology Solutions Using R and Bioconductor. Springer Science-Business Media, Inc., New York, pp 397–420
Subramanian A, Tamayo P, Mootha VK, Mukherjee S, Ebert BL, Gillette MA, Paulovich A, Pomeroy SL, Golub TR, Lander ES, Mesirov JP 2005 Gene set enrichment analysis: a knowledge-based approach for interpreting genome-wide expression profiles. Proc Natl Acad Sci USA 102: 15545–15550
Camon E, Magrane D, Barrell V, Lee V, Dimmer E, Maslen J, Binns D, Harte N, Lopez R, Apweiler R 2004 The Gene Ontology annotation (GOA) database: sharing knowledge in Uniprot with Gene Ontology. Nucleic Acids Res 32: D262–D266
Angelone DF, Wessels MR, Coughlin M, Suter EE, Valentini P, Kalish LA, Levy O 2006 Innate immunity of the human newborn is polarized toward a high ratio of IL-6/TNF-alpha production in vitro and in vivo. Pediatr Res 60: 205–209
Levy O 2005 Innate immunity of the human newborn: distinct cytokine responses to LPS and other Toll-like receptor agonists. J Endotoxin Res 11: 113–116
Juul SE, McPherson RJ, Farrell FX, Jolliffe L, Ness DJ, Gleason CA 2004 Erytropoietin concentrations in cerebrospinal fluid of nonhuman primates and fetal sheep following high-dose recombinant erythropoietin. Biol Neonate 85: 138–144
Statler PA, McPherson RJ, Bauer LA, Kellert BA, Juul SE 2007 Pharmacokinetics of high-dose recombinant erythropoietin in plasma and brain of neonatal rats. Pediatr Res 61: 671–675
Yeo EJ, Cho YS, Kim MS, Park JW 2008 Contribution of HIF-1alpha or HIF-2alpha to erythropoietin expression: in vivo evidence based on chromatin immunoprecipitation. Ann Hematol 87: 11–17
Li L, Qu Y, Li J, Xiong Y, Mao M, Mu D 2007 Relationship between HIF-1alpha expression and neuronal apoptosis in neonatal rats with hypoxia-ischemia brain injury. Brain Res 1180: 133–139
Baranova O, Miranda LF, Pichiule P, Dragatsis I, Johnson RS, Chavez JC 2007 Neuron-specific inactivation of the hypoxia inducible factor 1 alpha increases brain injury in a mouse model of transient focal cerebral ischemia. J Neurosci 27: 6320–6332
Hu X, Nesic-Taylor O, Qiu J, Rea HC, Fabian R, Rassin DK, Perez-Polo JR 2005 Activation of nuclear factor-kappaB signaling pathway by interleukin-1 after hypoxia/ischemia in neonatal rat hippocampus and cortex. J Neurochem 93: 26–37
Hossain MA 2008 Hypoxic-ischemic injury in neonatal brain: involvement of a novel neuronal molecule in neuronal cell death and potential target for neuroprotection. Int J Dev Neurosci 26: 93–101
Author information
Authors and Affiliations
Corresponding author
Additional information
Supported by March of Dimes 12-FY06-236.This article contains supplemental material available online at www.pedreserarch.org.
Rights and permissions
About this article
Cite this article
Juul, S., Beyer, R., Bammler, T. et al. Microarray Analysis of High-Dose Recombinant Erythropoietin Treatment of Unilateral Brain Injury in Neonatal Mouse Hippocampus. Pediatr Res 65, 485–492 (2009). https://doi.org/10.1203/PDR.0b013e31819d90c8
Received:
Accepted:
Issue Date:
DOI: https://doi.org/10.1203/PDR.0b013e31819d90c8
This article is cited by
-
Tackling Neuroinflammation After Traumatic Brain Injury: Complement Inhibition as a Therapy for Secondary Injury
Neurotherapeutics (2023)
-
Neuroprotective therapies in the NICU in preterm infants: present and future (Neonatal Neurocritical Care Series)
Pediatric Research (2023)
-
Temporal brain microRNA expression changes in a mouse model of neonatal hypoxic–ischemic injury
Pediatric Research (2022)
-
New possibilities for neuroprotection in neonatal hypoxic-ischemic encephalopathy
European Journal of Pediatrics (2022)
-
Tet Enzymes-Mediated DNA 5hmC Modification in Cerebral Ischemic and Hemorrhagic Injury
Neurotoxicity Research (2022)
