
Abstract
The preparation of protein single crystals represents one of the major obstacles in obtaining the detailed 3D structure of a biological macromolecule. The complete automation of the crystallization procedures requires large investments in terms of money and labor, which are available only to large dedicated infrastructures and is mostly suited for genomic-scale projects. On the other hand, many research projects from departmental laboratories are devoted to the study of few specific proteins. Here, we try to provide a series of protocols for the crystallization of soluble proteins, especially the difficult ones, tailored for small-scale research groups. An estimate of the time needed to complete each of the steps described can be found at the end of each section.
Introduction
The awareness that extensive structural knowledge is an indispensable tool in understanding, on a chemical basis, the molecular mechanism of protein function, has led to an enormous expansion of the field of protein crystallography over the past three decades, as indicated by the exponential growth of protein structures from x-ray diffraction data deposited in the Protein Data Bank (PDB) (http://www.wwpdb.org/stats.html)1. The successful determination of the crystal structure of a biological macromolecule requires the preparation of crystals suitable for x-ray analysis, usually single crystals—and to a lesser extent and with bigger difficulty twinned crystals—which are characterized by a high degree of homogeneity, long-range order2 and suitable size3, larger than 10 μm3, with the optimum being somewhere between 10−4 and 10−3 mm3.
The process of obtaining crystals suitable for diffraction experiments from a protein or other biological material is cumbersome and not trivial. Despite the considerable effort devoted to advancing the theory and practice of macromolecular crystallization, our understanding of the phenomenon is still limited and different approaches can be used to reach the goal. Our aim is neither to repeat what has been already very well done in dedicated series of monographs4 and books5,6,7, nor to review the enormous amount of literature available on the subject. Here, we outline our approach to the crystallization of the particular protein of interest which might be called 'target oriented crystallization' and to summarize our experience as a small-scale crystallography laboratory dedicated to structure–function studies of specific proteins, in a series of procedures to be followed in order to maximize the chance of crystallizing a soluble protein, especially the 'difficult' ones. Please note that the crystallization of membrane proteins is outside the scope of this protocol, and the reader should refer to specialized literature8,9,10,11,12,13 (and references therein).
Despite substantial progress over the years, crystallization still represents the major rate-limiting step in structure determination, due to the large number of variables that must be systematically altered for optimal crystal formation (these variables are collectively known as 'crystallization space'). Typical variables that influence crystal formation include the concentration and nature of the protein (e.g., full-length protein versus truncations, chemical modifications and mutations), the methods for setting up crystallization trials (e.g., vapor diffusion, dialysis, free interface diffusion, batch under oil), and physical and chemical parameters (e.g., temperature, electric/magnetic field, pH, type of buffer, additives and precipitants). Due to the many parameters capable of influencing the appearance and growth of a protein crystal, the process of protein crystallization is not linear, but requires constant re-evaluation of the feedback one gets from many of the steps involved in the procedure in an iterative manner. Careful observation of the outcome of the different experiments is therefore key to the successful implementation of the protocol.
A generalized experimental protocol to obtain diffracting crystals for every well-folded protein cannot be devised, since every protein has its own distinctive chemical properties. What can be done is to detail a procedure that affords the highest probability of success and to consider each crystallization trial exactly for what it is: a scientific experiment. The careful observation of the outcome of each experiment will provide some information about the system of interest that can be used to improve conditions in successive rounds of trials that may ultimately lead to success. Given this specification, the term 'protocol' will be still used here, although in the meaning just illustrated.
The crystallization strategy described here relies heavily on the chemical knowledge of the protein, since we believe that learning as much as possible of the chemistry of our protein will maximize the chance of success. We have several positive cases, which will be addressed here. For this reason, we think that a successful crystallization laboratory should have at hand a bunch of different strategies, in terms of protein characterization, crystallization setup and chemical modification of the protein under study, which have been already described in several publications, review papers and book chapters3,4,5,6,7,14,15,16,17,18,19,20,21,22,23, but mostly should use 'experiment-driven thinking'.
The reader is directed in particular to consult four sources of alternative descriptions of the techniques reported in this protocol4,5,6,7. In the following method, we have tried to coordinate five individual and sequential protocols or 'blocks' for the crystallization of soluble proteins and to present a general timing for the procedure whenever possible. Successful soluble protein crystallizations could be obtained, if the information presented here is taken with open mind: the conditions that work with one protein are not necessarily optimal for a different protein. However, the ability to explore correlations among the five blocks in which this protocol is subdivided may help to overcome the bottleneck of protein crystallization.
The protocol detailed in the following section represents (or is close to) 'the optimum'. We are aware that whether or not a researcher will be able to go trough all the steps described herein depends on the amount of protein and on the equipment available. Our suggestion is to characterize the protein as much as possible beforehand. For example, in our experience, in the more difficult cases, it is extremely useful to perform nuclear magnetic resonance (NMR) measurements to ascertain the presence of mobile (or even unfolded) parts or domains of the protein in order to plan mutagenesis experiments24 (see ANTICIPATED RESULTS). Mutagenesis is a formidable tool to achieve protein crystallization25,26. However, even largely unstructured proteins can sometimes be crystallized, if the correct deductions are drawn from the observation and analysis of the protein behavior (see ANTICIPATED RESULTS).
As mentioned earlier, the present protocol can be subdivided into the series of sequential procedural 'blocks' described as follows:
Preliminary sample preparation and characterization
The most important substance that will be used in the crystallization trials is the protein, which has to be handled properly following rigorous general laboratory precautions and a few specific precepts and caveats:
-
i
It is essential to avoid combining different purification batches for crystallization trials. Purification conditions and procedures are never identical, and each protein batch should be screened individually.
-
ii
The foundation for a successful crystallization experiment is laid at the purification stage. The purity, homogeneity and monodispersity of the protein sample should be evaluated prior to crystallization. Proteins should be as pure, homogeneous and monodisperse as possible. It should be free from structural and charge heterogeneity. Heterogeneity of a protein solution can impair crystal growth, and the crystallization of an impure macromolecule is often a doomed undertaking. Specifically, not only do the molecules to be crystallized have to be pure in terms of contaminating agents, but also in terms of sequence integrity and conformation. Lack of 'total purity' in the protein sample may lead (a) to the complete failure to form crystals, (b) to the production of small crystals unsuitable for x-ray structural analysis or (c) to the formation of crystals which do not scatter x-rays well, because incorporation of impurities in the crystal causes lattice strain and reduces the crystalline order causing decreased quality of the diffraction pattern in terms of both resolution and intensity27,28,29,30,31.
-
iii
Lyophilization is a practice to be avoided as it has been shown to induce conformational changes and even denaturation of a protein32,33. Although some proteins crystallize after lyophilization in general, if possible, this practice should be altogether shunned.
-
iv
Proteins displaying a tendency to form aggregates in dilute solution do not usually crystallize.
-
v
For the initial crystallization screening, the protein sample should be at least 90–95% pure on a Coomassie stained SDS–polyacrylamide gel electrophoresis (SDS-PAGE). A 1 p.p.m. contaminant in a typical 10–20 mg ml−1 protein solution amounts to approximately 109–1010 molecules per milliliter. Such contaminations might either interfere with the nucleation process and with the growth of nuclei by poisoning the developing crystal. For the above reason, high purity (at least 95–99%) is required for optimization of crystallization conditions. Even highly purified macromolecules intended for crystal growth, may, for a great variety of reasons, be chronically heterogeneous due to modifications, denaturation or the binding of ligands. Even when the protein is only 90% pure, crystallization trials should still be conducted, as the crystallization process may be considered as a purification process in itself. Moreover, heterogeneous masses have frequently been known to act as nucleation centers, allowing crystals to grow around them34.
Protein solubility screens
Probing the solubility of the proteins at different concentrations, in different buffers conditions, with different additives/stabilizers, and with different precipitating agents (see PROCEDURE) affords the data necessary to draw the supersolubility curve of the protein. The supersolubility curve is a curve in the phase diagram of a protein solution (i.e., protein concentration versus precipitant concentration at constant temperature) which divides the conditions where phase separation (liquid, amorphous solid and crystal nuclei) occurs from those where the solution remains above the saturation point of the protein for an indefinite length of time without phase separation. In other words, the supersolubility curve identifies that region of the phase diagram above saturation, where kinetic phenomena dominate the process of phase separation7,35. Once the supersolubility curve has been determined, the experiment can be designed to reach the metastable zone, namely that part of the phase diagram contained between the solubility and the supersolubility curves, where thermodynamic parameters govern the growth of nuclei into crystals. The transition from the supersaturation zone to the metastable zone can be obtained by dilution experiments, by transferring the solution or by controlling evaporation14,35,36,37,38,39,40.
Fast screening of crystallization conditions
In crystallization trials, the researcher should alter the solubility of the protein in search for the favorable intermolecular interactions that lead to crystal formation. All the screens should carefully be reviewed, and one should try and rationalize the outcome of every condition tested keeping in mind that even negative results give precious information. Variables that alter the protein solubility should be actively sought after. The most important parameters that affect protein solubility are protein concentration, precipitant type and concentration, pH, and temperature, which is an often neglected variable despite its proven impact5,6,41. In any event, other variables should never be ignored either, and, most important of all, one should always try to learn as much as possible on the chemical behavior of the protein under investigation.
Optimization of crystallization conditions
Once the appearance microcrystals, polycrystalline aggregates, thin plates, etc., of protein has been observed in the screenings just described, the crystallization conditions should be optimized using the sitting drop approach detailed in refs. 5, 6, 7. Even in the unusual fortunate instance when crystals suitable for x-ray diffraction analysis are obtained from the initial screening, crystallization optimization should still be carried out. One should in fact pursue other conditions, which may offer crystals of different morphology that could in turn prove valuable during a crystallographic structure determination.
If the crystals obtained at the screening stage are not suitable for x-ray diffraction analysis or diffract only at low resolution, one should proceed with the optimization of the crystallization conditions. Although it is always preferable to pursue the largest, better-looking crystals, there are plenty of reports where small, 'ugly' crystals have eventually produced the best data. It is worth mentioning that in protein crystal growth, the formation of crystals is often hard to reproduce even following scrupulously the original conditions. Optimization experiments should therefore also be viewed and used as a way to improve reproducibility.
Optimization of crystallization conditions—crystal nuclei transfer techniques
One of the paradoxes in crystallization is that the optimal solution conditions for nucleation of the crystals are not the ideal ones to support their subsequent growth38 (and references therein). Nucleation only occurs in a supersaturated solution, while optimum growth occurs in the metastable region (between solubility and supersolubility curves—see the phase diagrams reported in ref. 7, chapter 9). The ideal experiment therefore must uncouple nucleation from growth to satisfy the different requirements of the two events. A method to transfer the crystal nuclei to metastable conditions involves diluting the drops42,43 after incubating them for some hours at spontaneous nucleation conditions or transferring nucleating drops over reservoirs at different concentrations for equilibration at metastable conditions36,37,38. Among the techniques for the separation of nucleation and growth, seeding is the most popular way of moving the system in 'phase space' avoiding the 'hazards' of the nucleation zone6,44,45,46,47. These so-called 'seeding' experiments fall in four general categories: (i) macroseeding (or seed transfer), (ii) microseeding, (iii) streak and (iv) cross-seeding and epitaxial.
The choice among the preceding four seeding techniques depends on the results of the crystallization screens. Microseeding techniques can always be used for crystal optimization. If only microcrystals (less than 5 μm in size), microcrystalline precipitate, dendritic crystals or spherulites have been obtained, then microseeding is the only possible technique. If crystals of appreciable size in one or two dimensions (rods or plates; 10–50 μm), but very thin in the other dimensions, have been obtained, then either macroseeding or streak seeding can be used to grow 3D crystals. When sizable crystals that present imperfections like multiple crystals, twinned crystals and the like have been obtained, then streak seeding can be used.
If all crystallization trials have been unsuccessful and failed to provide any crystal, the cross-seeding or epitaxial seeding can be attempted. It is possible that the discovery of new materials having nucleating properties will make epitaxial seeding the method of choice in the future48.
The strategy of macroseeding consists in slightly melting the surface of a very small crystal (very thin plates or rods) before transferring it to a new equilibrated drop in the metastable zone containing fresh protein, which will optimistically continue to crystallize on the washed surface of the small crystal. The success of the macroseeding experiment depends largely upon how well one determines the lowest precipitant concentration where the crystal will not melt completely.
Microseeding provides another way to control nucleation as it consists of introducing crystal nuclei in the equilibrated metastable protein solution, where the seeds might grow.
In streak seeding, an animal whisker (usually cat or rabbit) or another tool is utilized as a seeding wand. The wand is used to touch or stroke the surface of the parent crystal to dislodge and trap the crystallization nuclei. The whisker is then drawn through the new equilibrated drop, depositing the seed in a streak line.
Seeds can also consist of heterogeneous material that can be any solid substance having nucleating properties. When a molecule not only nucleates on another but also shares some of the structural features of the substrate, the growth is said to be epitaxial. Different mineral samples (i.e., mica and apophyllite) may be used as heteroepitaxial nucleant. Recent studies demonstrated that porous materials (i.e., porous silicon), containing pore sizes that are comparable with the size of the protein molecules, display nucleation-inducing properties48,49,50,51.
A further technique uses crystals of a similar protein (e.g., mutant protein, same protein from a different species) to promote nucleation. In this case, we speak of cross-seeding. Vice-versa, when working with mutants or variants of a protein already crystallized, cross-seeding, with crystals of the native protein into drops containing the mutant or variant can be attempted.
The seed(s) must be placed into a new experiment equilibrated at the metastable zone. In practice, since determining the phase diagram is expensive in terms of the researcher's time and protein consumption, most seeding experiments are done without knowing the protein phase diagram. To move to the metastable zone of supersaturation, the concentration of at least one of the components (precipitant or protein) must be lowered. Different results can be obtained depending on which of the concentrations is lowered: (i) protein and/or (ii) precipitant.
The relationship between protein solubility and precipitant concentration is a function of the type of precipitant (i.e., polymeric precipitant or salts), particularly, protein solubility decreases proportionally as the polymer concentration increases. The relationship between salt concentration and protein solubility is on the other hand more complex. The nature of the salt affects the solubility independently of the ionic strength45. Thus, lowering the salt concentration may have less predictable consequences than lowering the protein concentration.
Materials
Reagents
-
SDS gel preparation kit (Sigma-Aldrich, cat. no. 08091) or, as an alternative, see REAGENT SETUP
-
Isoelectric focusing (IEF) gel (see REAGENT SETUP)
-
Buffer solutions (see Table 1)
Table 1 Suitable buffers for protein solubility screenings. -
Sodium azide
Caution
Sodium azide is a poison. It is harmful by inhalation, ingestion or by skin contact. Ingestion or inhalation may be fatal, and the material is readily absorbed through skin. Sodium azide is also a mutagen.
-
Thymol (optional)
Caution
Thymol is harmful if swallowed, inhaled or absorbed through the skin. All mercury compounds are very toxic. Care should be taken not to come in contact with them by inhalation, swallowing or through the skin. There is danger of cumulative effects.
-
Thimerosal [ethyl (2-mercaptobenzoato-(2-)-O,S) sodium mercurate]
Caution
Thimerosal in particular is an experimental neoplastigen and teratogen. It is harmful by inhalation and ingestion and may cause reproductive damage.
-
Organomercuric compound: 4-(hydroxy-mercury) benzoic acid (Sigma Aldrich, cat. no. 25010)
-
Preformulated buffers, precipitants (salts, polymers, volatile and nonvolatile organic solvents), detergents, surfactants, additives, reductants and ligands are available at the retailer's web sites listed under the EQUIPMENT and as analytical grade and biochemical grade products from Sigma-Aldrich
-
PCT kit (Hampton Research)
-
EasyXtal pre-screen assay (Qiagen-Nextal Biotechnologies, Canada)
-
JBS solubility kit (Jena Biosciences, Germany)
-
ADA [N-(2-acetamido)iminodiacetic acid], MES [2-(N-morpholino)ethanesulfonic acid)] or cacodylate (optional)
Caution
Many of the reagents used in crystallization experiments are toxic. Please follow the safety sheets pertinent to each precipitant.
Critical
The quality and purity of all products are the most important requirements for successful crystal formation.
Equipment
-
Pharmacia Electrophoresis Power Supply – EPS3005 (Pharmacia)
-
Ampholine PAGplate (Amersham Pharmacia Biotech, Uppsala, Sweden)
-
Multiphor II apparatus (Pharmacia)
-
Electrospray mass spectrometer Finnigan LTQ equipped with an ion spray source (Thermo Electron Co. Schaumburg, IL)
Critical
Availability only required via dedicated facilities and not in the laboratory itself.
-
Static and dynamic light scattering (LS) (Scitech Instruments or Wyatt Technology Corporation)
Critical
Availability only required via dedicated facilities and not in the laboratory itself.
-
JASCO J-815 CD spectrometer (JASCO)
Critical
Availability only required via dedicated facilities and not in the laboratory itself.
-
Dialysis membrane
-
22 μm pore size membranes
-
NMR Bruker 400–800 MHz spectrometers (Bruker)
Critical
Availability only required via dedicated facilities and not in the laboratory itself.
-
X-ray diffractometer equipped with a sealed tube or rotating anode x-ray source, focusing optics and 2D detector (charge coupled device or image plate). Access to a synchrotron x-ray source is desirable
Critical
Availability only required via dedicated facilities and not in the laboratory itself.
-
Stereomicroscopes Nikon SMZ 800 (Nikon) and MOTIC SMZ 143 (Motic)
-
Bench top centrifuge
-
Centricon centrifugal filter (Centricon)
Reagent setup
-
IEF Analytical IEF of crude cell extracts is performed in precast 5% polyacrylamide gels (Amersham Biosciences) containing ampholytes (pH range, 3.5–9.5) with Multiphor II apparatus.
-
SDS-PAGE analysis The individual components needed are: acrylamide/bisacrylamide 30% solution 29:1 (Sigma-Aldrich, cat. no. A3574); SDS 10 and 20% solutions (Sigma-Aldrich, cat. nos. 71736 and 05030); Ammonium persulfate (Sigma-Aldrich, cat. no. A3678); N,N,N′,N′-Tetramethylethylenediamine (TEMED; Sigma-Aldrich, cat. no. T9281); Tris-HCl buffer (Sigma-Aldrich, cat. no. T3253); dithiothreitol (DTT) or 2-mercaptoethanol (BME) (Sigma-Aldrich, cat. nos. 43817 and M6250); Glycerol (Sigma-Aldrich, cat. no. G5516); Gly (Sigma-Aldrich, cat. no. 241261); and Coomassie brilliant blue R (Sigma-Aldrich, cat. no. B8647)
Equipment setup
-
Crystallization trials Full lists (including a wide choice) of all equipment needed for vapor diffusion experiments (sitting/hanging drop setup), batch/microbatch experiments, free interface diffusion and gel-based crystallization are available from Axygen Biosciences, Emerald Biostructure, Hampton Research, Jena Bioscience, Molecular Dimensions and Qiagen-Nextal Biotechnology.
Procedure
Preliminary sample preparation and characterization
Timing 30 h–5 d
-
1
Prepare approximately 1 ml solution of the protein with concentration approximately 10 mg ml−1 in the buffer used for protein preparation and purification.
-
2
Use approximately 1 μl solution prepared in Step 1 to carry out an overloaded SDS-PAGE according to the Laemmli's method52 in order to check the protein purity (the protocol described in ref. 7, p. 26 can be followed). In case of proteins obtained from natural sources, also a N-terminal sequence or even an overall protein sequence analysis is recommended.
Critical Step
Avoid combining different purification batches for crystallization trials. Purification conditions and procedures are never identical: each batch should be screened individually.
-
3
Prepare a sample of the protein that is free of nonvolatile salts by buffer exchange over a dialysis membrane with either no buffer at all or with volatile buffers like ammonium acetate (keep the buffer concentration below 10 mM) and determine the molecular weight of the protein by mass spectroscopy (MS). Please note that MS is the ideal analytical method as a routine check for sample impurities of all kinds.
-
4
Determine isoelectric homogeneity of the protein sample by performing an IEF gel53 (the protocol described in ref. 7, p. 28 can be followed).
-
5
In case of enzymes, check the activity, if you have an assay. An absent or too low specific activity might depend on several factors (lost enzyme, misfolding and inhibition by impurities). In this case, there is no point in pursuing crystallization. The enzyme preparation and purification steps should be reconsidered.
-
6
Detect aggregate formation in dilute solution by LS54,55,56,57,58,59,60 or by NMR/NMR dispersion61,62. In case of aggregate content of over 15–20% of the protein present in solution (monodispersity lower than 85–80%), reconsider protein purification and buffer composition63.
-
7
Check the circular dichroism (CD) spectrum of your protein to see if it has secondary structure. Use the stock protein solution and operate according to refs. 63 and 64.
-
8
Record 2D 15N/1H NMR protein spectra to ensure that the protein domains are folded at submillimolar concentrations64.
Buffer screening
Timing 24 h
-
9
Prepare concentrated buffer solutions (0.5 M) of all different buffers listed in Table 1. The buffer solutions should be sterilized by filtration through 0.22μm pore size membranes and the glassware should be autoclaved. Add 0.1–1.0 mM sodium azide to keep buffer solutions free from microbial presence.
-
10
Dispense your protein (at 1–2 mg ml−1) in sitting drops (1 μl) (for sitting drop setup see ref. 7, pp. 86–88) over 1 ml well solutions containing series of diluted buffers (100 mM) at various pH, with additives/stabilizers according the purification protocol65.
Critical Step
If you plan to use metal ions (besides group 1 metal ions) as additives, avoid using phosphate and carbonate buffers to prevent crystallization of insoluble inorganic salts.
-
11
Visually identify those drops that are clear.
-
12
Choose one set of conditions out of those identified as suitable (clear solutions) in Step 10, which guarantees that the protein is stable and soluble (i.e., useful to crystallization).
Samples storage
Timing 2 h
-
13
Centrifuge protein solutions in a bench top device (2,000g, 5 min, 4 °C) and decant the supernatant protein solution.
-
14
Filter the protein solution through 0.22μm pore size membranes into a sterile vessel. Use filters with the smallest possible dead volume to minimize protein sample loss.
Critical Step
The protein may adhere to the filter membrane. To avoid sample loss, test a small aliquot of the solution that remains on the filter for the presence of protein (SDS and/or activity).
-
15
Concentrate the protein solution to 10 mg ml−1 through a Centricon centrifugal filter of appropriate molecular weight cutoff (centrifuge 5,000–14,000g, 4 °C; the time and speed depend on the protein and on the filter used). Nonspecific aggregation of the protein may occur at this stage. In any case, it is advisable to repeat a LS measurement (if available) to evaluate the monodispersity of the protein in the concentrated solution. In any case, check the protein concentration by UV-visible spectroscopy and/or by activity test (if available).
-
16
Use 0.1–1.0 mM sodium azide to keep protein solutions free from microbial presence. Please note that sodium azide is a strong Lewis base and an inhibitor for metallo-proteins and enzymes as it may act as a ligand for the metal center. Similarly, azide can also interfere with heavy atom derivatization. As an alternative to azide, one may use thymol, Thimerosal to a comparable concentration of 50–100 μM or implement rigorously sterile laboratory procedures and materials. In any event, it is worthwhile mentioning that also organomercury compounds are able to form covalent bonds with protein, especially if free Cys are available for binding. On the other hand, we find organomercury compounds very helpful in preventing protein precipitation by inhibiting the formation of intermolecular disulfide bonds. A classical example of the usefulness of mercury compounds for obtaining high-quality crystals is given by the crystallization of human carbonic anhydrase66. A more recent example of the use of organomercury compounds is provided by the successful crystallization of both bacterial and mammalian CutA proteins67 (see the ANTICIPATED RESULTS for the discussion).
-
17
Aliquot the protein sample into multiple small Eppendorf tubes: transfer 100 μl aliquots of protein solution for the initial screenings (Steps 25–52) and 20 μl aliquots of protein solution for optimization (Steps 53–98).
-
18
Label protein samples clearly with the sample identification, batch identification and date of storage. Labels should include (i) name of protein; (ii) sample identification: batch, storage temperature and date; (iii) sample buffer composition, additives, ligands, etc.; and (iv) sample concentration.
-
19
Freeze the protein samples aliquots in the freezer and store them at −20 °C.
Critical Step
Repeated freezing and thawing of the protein sample should be avoided, because it may alter the protein. Make aliquots small enough so that the entire aliquot can be consumed in the experiment after thawing.
Pause point
Frozen samples of most protein solutions can be safely stored at −20 °C for at least 3 months. In special cases, storage at −80 °C is required. A convenient way of storing proteins at very low temperatures is to use the same vessels where frozen crystals are stored under liquid nitrogen (−196 °C). Check with the molecular biologist(s) who prepared the protein or compare the protein to a similar protein in the literature for the best storage temperature.
Protein sample handling
-
20
Unfreeze the protein sample and allow the sample to equilibrate to the temperature at which the crystallization experiments will be set up.
Critical Step
When thawing a sample, do not shake or vortex the protein in order to avoid foaming.
-
21
Once the protein aliquot is unfrozen, protect the sample from microbes by storing the thawed protein solution at 4 °C, but use it within 1 d.
-
22
Set up the trials as soon as possible not leaving the protein sample for extended time at room temperature (20–22 °C).
Critical Step
Over time, proteins may break down and the mixture may become heterogeneous.
-
23
The protein solution is better handled by using a gel-loading pipette tip (available at: http://catalog2.corning.com/Lifesciences/en-US/Shopping/ Product.aspx?categoryname=Pipet+Tips(Lifesciences)%7cPipet+Tips %2c+Gel+Loading(Lifesciences); http://www.biocompare.com/matrix/3943/Gel-Loading-Pipette-Tips.html; http://www.lightlabsusa.com/home.php?cat=263; http://www.vwrsp.com/catalog/product/index.cgi?object_id=0011814&class_id=5002473) to dispense small drops with better control and accuracy of drop placement in the subsequent steps of the procedure.
Protein solubility screens—selection of the appropriate protein concentration for crystallization
Timing 4 h (A) or 2–4 d (B)
-
24
Perform protein solubility tests using one of the approaches detailed in the following options A, B or C. The selection of appropriate protein concentration for crystallization can minimize or prevent situations where a screen results in an over abundance, either of precipitate or clear drops and can improve probability of crystallization and crystal size.
-
A
Use of commercially available kits
-
i
The PCT kit (Hampton Research)65, with only four unique, preformulated precipitant solutions, provides information on protein solubility by using a small quantity of sample (i.e., 5–10 μl of 10–20 mg ml−1 of protein solution).
-
ii
The EasyXtal pre-screen assay (Qiagen-Nextal Biotechnologies, Canada) is arranged in three mini-grids (six conditions each). The initial protein concentration should be at least 20 mg ml−1 and at least 24 μl of protein solution is required.
-
iii
The JBS solubility kit (Jena Biosciences, Germany) is based on the principle reported in option B65, and it comprises two individual kits for successive use: 'A—buffer kit' and 'B—additives kit'. A minimum of 38 μl of protein solution at the concentration of at least 3 mg ml−1 is required to perform the two screens.
-
iv
Perform the screenings using one of the commercially available kits above by following the procedure described in the respective user guides.
-
v
By analyzing the results of the assay, the concentration of protein to be used in initial crystallization screenings can be easily determined.
Note: Allows to save protein and/or to save time, while optimizing protein concentration.
-
i
-
B
Optimum solubility buffers and additive screens 65, 68
-
i
Prepare your own buffers solutions and evaluate the protein solubility using a procedure similar to that reported65,68. For this purpose, utilize protein sample concentrations in the range of 3–50 mg ml−1 (as high as possible, depending on solubility of the purified protein), and use buffers from Table 1 (modified from ref. 68).
-
ii
Use the hanging drop set up (see ref. 7, pp. 84–85) with a 24-well tissue culture plate and siliconized glass cover slips. In each well, pipette 1 ml of 100-mM buffer solution (reservoir buffer).
-
iii
Pipette 2 μl aliquots of protein solution in starting buffer onto the glass cover slips.
-
iv
To each drop of protein solution, add 2 μl of 100 mM reservoir buffer, and mix the solutions by gently drawing and expelling the solution in the pipette tip.
-
v
Invert the glass slips and seal them onto the wells using petroleum jelly.
-
vi
Allow the plate to rest undisturbed at room temperature so that vapor diffusion may take place.
-
vii
Measure the amount of precipitate in the drops by placing the tray against a black background, illuminating it from the side, and visually examining each drop under a microscope. Under these lighting conditions, precipitate appears as a white spot against the black background and is scored based on the fraction of the drop covered by precipitate (scale of 0–4, with 0 for no precipitate and 4 for precipitate completely covering the drop).
-
viii
Score the drops at 12–24 h intervals for several days till the drops reach their final equilibrium concentrations.
-
ix
Perform a stabilizer screen using the common stabilizers/additives from Table 2 and the buffer conditions in which the protein is most soluble in according to the buffer screen just carried out. The additives listed in Table 2 help to find the optimal solubility conditions for the protein68.Note: Option B is more time or sample consuming than option A. The protein concentration has to be as high as possible. Details on the procedure are reported in refs. 65 and 68. One might also consider repeating the screen at different temperatures (i.e., room temperature and 4 °C). Proteins crystallize at the temperature at which they are most soluble69. The ease of use of this screen and the capability of testing many conditions makes this a very efficient means of searching for the best solvent condition for a particular protein that initially shows high levels of aggregation. Very often, proteins do not crystallize, because the purified protein sample is not conformationally homogenous. This optimum solubility screen allows to obtain the most homogeneous and monodisperse proteins conditions for proteins that usually aggregate and cannot be concentrated prior to setting up crystallization screens. Recently, the efficiency of a similar optimum solubility screen on improving crystal growth, quality and size has been reported69,70.
Table 2 Suitable additives/stabilizers for protein solubility screenings and concentration ranges to be used.
-
i
-
C
Alternative techniques
-
A
Fast screening of crystallization conditions
Timing 2 h for manual preparation of 96 different conditions
-
25
Centrifuge the protein sample at 2,000g for 10–15 min at 4 °C immediately prior to setting up the crystallization screen and use the supernatant for the following steps of the protocol. This ensures the removal of aggregates and amorphous material.
-
26
(Optional) When free sulfidryl residues (Cys) are present in the protein, oxidation may occur. In this case, in order to avoid degradation of the protein, prepare solutions of mild reducing agents and add them to the protein solutions so that their final concentration in the crystallization drop is approximately 1–10 mM. Common reducing agents that can be used for this purpose are DL-DTT (greater than 99.0% purity; see MATERIALS) and BME (greater than 99.0%; see MATERIALS).
-
27
In a crystallization experiment, solutions of these reducing agents remain active for 2–3 d and 3–7 d, respectively5. Alternatively, organomercury compounds may be used (see Step 16). Organomercury compounds protect the free sulfidryl residues from reacting with them by establishing Hg–S covalent bonds.
-
28
Start fast screening of crystallization conditions by using sitting drop techniques (as described in ref. 7, pp. 82 and 88–89), 96-well plates and sealing film. Use commercially available sparse matrix or grid screen solution kits73,74,75 (plates and kits available at: Emerald Biostructures Inc.; Hampton Research; Molecular Dimensions; Qiagen-Nextal Biotechnology, Canada; Jena Bioscience, Germany; Axygen Biosciences) like the ones listed next, following the order: (i) sparse matrix, (ii) matrix screen PEG/ions, (iii) grid screen ammonium sulfate, (iv) grid screen PEGs, (v) grid screen PEG/LiCl, (vi) grid screen alcohols, (vii) grid screen salts. Shake crystallization solutions (i.e., sparse matrix or grid screen kit solutions) thoroughly before use. Stored solutions present heterogeneous concentration that may hamper the experiment reproducibility. Dispense 100 μl of crystallization solution in the reservoir and drops consisting of 1–2 μl of protein solution + 1–2 μl of reservoir solution (equal amounts). Pipette the crystallization solution into the protein solution and let the two diffuse together without mixing. Once taken from the refrigerator, the screening solutions should be kept approximately 30 min at room temperature to allow equilibration from the 4 °C storage temperature. Do not open the solution vials before equilibration to avoid moisture condensation. Start crystallization trials with kits (i–iv) and set them up according to each kit user guide. Use protein solution at the best concentration as determined from Step 24.
Critical Step
In crystallization trials, avoid vibrations because of their negative influence on this process.
-
29
Perform screens at two different temperatures: 4 and 20 °C (controlled room temperature).
-
30
(Optional) When the amount of available protein sample is not sufficient to perform duplicate screens, set up screens at room temperature first. After 2/4 weeks move the plates to 4 °C and monitor changes in solubility.
-
31
Observe the drops using a light microscope with magnification between × 20 and × 100.
Critical Step
Do not use polarized light because of interference from the plastic tray with the polarized beam. Check the entire drop by focusing; try dark field illumination to check for gelatinous precipitate. At this stage, the color of the precipitate is important.
-
32
If some or all drops are clear, do not examine or disturb them in any way. The observation of each trial should be performed according to the following schedule 3 d, 1 week, 10 d, 2 weeks, 18 d, 3 weeks, 4 weeks.
Pause point
Store the crystallization trials up to 1 year, observe the crystallization drops once a month.
-
33
To classify the appearance of the drops, record the results of the experiment using the numbering scheme75 detailed in Figure 1.
Figure 1: Classification scheme for the results of a crystallization screen taken from ref. 75. 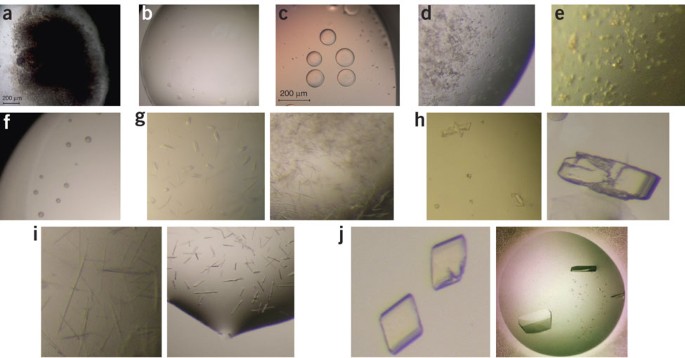
(a) Heavy brown or flocculent precipitate (score of 1), (b) clear drop (score of 2), (c) phase separation or light precipitate (score of 3), (d) granular precipitate (score of 4), (e) microcrystalline precipitate (score of 5), (f) spherulites (score of 6), (g) micro-crystals (score of 7), (h) multiple crystals (score of 8), (i) small crystals (needles, thin plates; score of 9), (j) well shaped single crystals (score of 10).
-
34
If kits (i–iv) do not provide any useful initial conditions promoting crystallization, use kits (v–vii).
-
35
After each observation, score the results of the screen being careful to assign an order of magnitude to the description of what is observed in the drop. Use the 1–10 scale75, ranging from precipitates to crystals, as described in Step 33. This will assist the optimization step and will help to distinguish subtle differences between precipitates, which can be helpful during optimization trials.
-
36
A reasonable precipitation is achieved when one-third to one-half of the drops contains some kind of precipitate. Once a precipitate is seen in a drop, pay attention to that drop and look for crystal appearing in the precipitate cloud. Be sure to scan the entire drop searching for crystals at the top, the bottom and in between. It is possible that crystals will grow from the precipitate after some time76,77 (see Step 53).
-
37
One of the most difficult aspects for beginners is to recognize promising precipitates and distinguish them from precipitates that are not worth pursuing. Except for drops where the protein is denatured (i.e., the precipitate does not redissolve upon dilution), regard precipitate as a positive drop result. This is because precipitate occurs in a state of supersaturation. Crystals can only grow from supersaturated solutions; hence they can grow from a solution that contains precipitates. Reversible precipitates might be microcrystalline or amorphous while irreversible precipitates are formed by denatured macromolecules. Amorphous precipitate does not show birefringence, while microcrystalline precipitate does. Please note that a useful guidance to evaluate the results of the crystallization screenings is provided by the Terese Bergfors website (http://xray.bmc.uu.se/~terese/crystallization/library.html) where the reader can find a pictorial representation of all possible outcome of a crystal screen and suggestions about the actions to be undertaken in each different case.
Critical Step
Although one may not obtain good-quality crystals from the initial screening, the presence of oils, gels, phase separation, spherulites, microcrystals, needles or plates in some of the crystallization experiments should be carefully noted as these are still good starting points for the subsequent optimization step.
-
38
Determine and classify which precipitants always cause the appearance of a precipitate, regardless of precipitant concentration and which only cause precipitation at higher precipitant concentrations but not at lower concentration (or vice versa). Initially one might select precipitants that fall in the latter category as precipitant candidates for secondary screens.
-
39
Determine the pH dependence of the solubility of your protein.
-
40
Determine how the presence of metal ions, cations and anions affects the protein solubility.
-
41
(Optional) Design a grid or a sparse matrix screen about precipitant variables from observations described in Steps 38–40. For example, one might note that all drops are clear in the presence of PEG 6000, below 10% wt/vol concentration, but that heavy precipitate is observed at 30% wt/vol PEG 6000 and above. One might design a screen to evaluate PEG 6000 concentrations between 10 and 30% (wt/vol) versus an appropriate pH range. If reviewing the effects of pH on solubility shows that drops are clear at pH values below 7, while a heavy precipitate is observed above pH 7, then it seems reasonable to evaluate a pH range between 3 and 7 (refs. 5,65) (see ANTICIPATED RESULTS for an example of a grid).
-
42
Always take into consideration the effect that salts, polymers, organic solvents and additives might have on the pH of the buffer selected for crystallization experiment. To be safe, check the pH of an experimental solution after all components have been added, mixed and the solution has been equilibrated at the temperature where the buffer was titrated and the experiment is to be performed.
-
43
(Optional) If the protein is known to bind small molecules or cofactors and inhibitors, then try screening crystallization conditions by including the known ligands. Cofactors, inhibitors and other compounds that bind or interact with the protein may alter the protein conformation and solubility. This may impose a greater degree of structural homogeneity and increase the likelihood of crystallization78.
Critical Step
When working with chemically unstable ligands (e.g., ADP, ATP, NAD and NADH), be sure to use freshly prepared working solutions or properly stored stocks (see the material property data sheet of each of these compounds about the storing instructions). These agents are sensitive to degradation over time and this can deeply influence the outcome of a crystallization experiment. Also, consider the acid–base properties of these ligands since the additive can influence the final pH of the drop and, vice versa, the binding properties of the ligand are influenced by its protonation state. It might be necessary to adjust the pH of the ligand solution before the addition to the drop. The binding of metal ion cofactors also depend on pH: at pH below 5, metal ions might be released from the protein and this might alter the protein conformation even before the denaturation point is reached. On the other hand, at pH above 8, the hydroxide anion might compete with the protein for binding the metal ion and insoluble metal hydroxides might form.
-
44
Detergents are often used as additives where hydrophobic interactions might lead to nonspecific aggregation and preclude crystallization. The presence of protein nonspecific aggregation can be detected by dynamic LS or simply deduced by observing amorphous precipitate formation, but not crystal growth. In this case, it is worth trying using detergents even though there are literature reports indicating the general usefulness of detergents in improving crystallization79. When screening detergents as additives, be sure to evaluate small amphiphiles such as benzamidine, ethanol, dioxane, 1,6-hexanediol, ethylene glycol and butyl ether for their ability to influence micelle stability80,81. When you increase the length of the detergent chain, you should decrease the amount of precipitant, because the chain length changes the micelle size.
-
45
Always take into consideration the amino acid sequence, protein isoelectric point (calculated from sequence) and overall charge of the protein at the working pH82. Use in millimolar concentrations charged, short chained, water soluble molecules, termed 'electrostatic agents' in the field of protein crystal growth, such as spermine, spermidine, hexadecanoic acid, 1,7-diaminoheptane and ions to neutralize free charges.
-
46
If all attempts to alter protein solubility and obtain crystals by manipulation of the environment fail, manipulate the protein according to the following optional Steps 47–51, and repeat all the crystallization experiments.
-
47
(Optional) If dealing with glycosylated proteins: remove all or part of the glycosylation by following reported procedures83,84,85,86.
-
48
(Optional) Utilize site directed mutagenesis to replace relevant amino acids and alter protein solubility87. This is one of the most powerful tools available25,26, and it might represent the key factor to achieve crystallization in the most difficult cases24. However, be aware that the mutated protein is by definition different from the 'wild-type' and the influence of the introduced mutation(s) on the protein chemical behavior should be evaluated thoroughly (see ANTICIPATED RESULTS for an example).
-
49
(Optional) Isolate, clone or purify the protein from an alternate source88,89.
-
50
(Optional) Generate a fusion protein to alter solubility89.
-
51
(Optional) Truncate N- or/and C-termini or entire domains if you have evidence of conformational disorder24. The same precautions described in Step 48 apply.
-
52
If all drops in the screen are either clear or contain denatured protein, go back to repurify the protein and repeat Steps 1–51.

Optimization of crystallization conditions—chemical and physical variables
Timing 24–48 h
-
53
When the appearance of protein microcrystals, polycrystalline aggregates, thin plates, etc., has been observed, i.e., for those conditions that have resulted in scores 7–10 (Step 33), carry out trials for optimization of crystallization conditions using sitting drop methodology. However, it is known that small crystals may form initially, but after some time, they slowly disappear and are replaced by few that grow larger at the expense of the small ones. The smaller crystals act as 'nutrients' for the bigger crystals. This is a spontaneous process, the so-called Ostwald ripening76,77, that occurs, because larger crystals are energetically favored with respect to the smaller ones. If the protein is available in sufficient quantity, we suggest to run the optimization described below in parallel with seeding experiments described in Steps 72–98. Use variable volume of precipitant and protein solutions as reported below in Steps 64–66.
Critical Step
Even if you are fortunate enough to obtain crystals suitable for x-ray diffraction analysis from an initial screen (Steps 25–46), do not stop your crystallization efforts. Pursue other conditions that may offer crystals of different morphology, which could be valuable during a crystallographic structure determination project. If the crystals are not suitable for x-ray diffraction analysis or diffract only at low resolution, proceed with the optimization of the crystallization condition. It is always preferable to optimize the largest, better-looking crystals. However, there are plenty of reports where small, ugly crystals have eventually produced the best data.
-
54
Explore as many optimization opportunities for crystallization as possible. Optimize every hit from a screen. When you reach an optimization dead end for a particular hit, review the screens again and optimize crystal leads from other hits. Optimize different hits simultaneously if protein availability permits. Please note that in protein crystal growth, crystals are often seen, but cannot be reproduced later under the same conditions. Use optimization experiments also to improve reproducibility.
-
55
Note the presence and relative concentration of every component in the solution that appears to affect positively protein crystallization. In particular, concentrate on the effect of the following: (i) polymer (PEGs, PEG monomethyl ethers, ethylene imine polymers, JEFFAMINES); (ii) salt; (iii) ions; (iv) organic solvents; (v) pH; (vi) protein concentration; (vii) temperature; (viii) buffer; (ix) crystallization method (setup) ((a) crystallization by vapor diffusion; (b) batch crystallization90; (c) crystallization under oil (microbatch)16,40,91; (d) crystallization by dialysis7,92; (e) crystallization in gels93,94,95); (x) protein purity, homogeneity and monodispersity.
-
56
After the main variables have been noted (see Step 55), 'play around' with them. Alter the precipitant concentration, the pH and the protein concentration. Design a screen by bracketing the precipitant conditions and pH values above and below those that produced the crystals. For example, if crystals were obtained in 25% wt/vol PEG 6000, pH 7.5, a subsequent screen might be designed to vary PEG between 15 and 35% wt/vol versus pH 6.5–8.5. To save protein, larger increments have to be tried initially, with more fine increments as the results dictate. When using PEG as precipitant, evaluate the effects of changing the molecular weight of the PEG. PEG sizes from Mr = 400 to 20,000 have successfully provided protein crystals, but the experience indicates the range 2,000–8,000 as the most successful.
Critical Step
In some cases, varying the pH by 0.1 pH units is enough to stop crystallization. Always check the pH of the final solution containing protein and precipitant.
Critical Step
Take care of PEG solutions. PEGs are inherently unstable and often produce aldehydes and peroxides as by-products. The presence of these compounds becomes more likely as the PEG solution ages, and their formation is promoted by UV light. Store PEG solutions at low temperature (4 °C), in the dark, and possibly even under nitrogen, to avoid oxidation processes initiated by atmospheric oxygen. Mould growth in PEG solutions can be prevented by adding 0.1mM sodium azide.
-
57
(Optional) Switch from PEG 400 to 2-methyl-2,4-pentanediol (MPD), or vice versa, if you experience limited success with either of these compounds.
-
58
Evaluate the effect of different and/or related salts. For example, when ammonium sulfate appears to be effective but does not provides high-quality crystals, evaluate lithium sulfate or other sulfates.
-
59
Vary salt concentration (increase and decrease) in the presence of a fixed amount of PEG.
-
60
Try different buffers, e.g., at pH 6.0 try ADA [N-(2-acetamido)iminodiacetic acid], MES [2-(N-morpholino)ethanesulfonic acid)] or cacodylate.
-
61
Go back to the initial crystallization screening plates. Review the plates, looking for conditions where neither precipitate nor crystals were/are observed. Review the results to identify a common precipitant/ingredient in several or all of these protein samples. For example, you might find that all drops with isopropanol remained clear.
-
62
Add the 'common ingredient' from Step 61 to the current crystallization conditions and determine whether its presence improves the crystal size and/or quality. If, for instance, you observe a difference in the crystal in the presence of isopropanol, consider evaluating other additives in the class of alcohols such as ethanol, methanol, butanol and the like. Please note, however, that alcohols and dioxane have the effect of poisoning the crystals and of slowing down nucleation. Furthermore, alcohols like methanol and isopropanol are volatile and may render problematic the crystal mounting for diffraction data collection because of rapid solvent evaporation and subsequent crystal damage. In this case, use heavier alcohols like isobutanol or 2-butanol96,97,98,99.
Critical Step
Carefully mix additives with the precipitating solution (i.e., reservoir) to avoid errors in the final concentration. It is possible that additives, like glycerol and detergents, will create concentration gradients in the drop that could make reproducing the experiment difficult.
-
63
Evaluate the effect of ligands, inhibitors, cofactors and all the suggestions reported in Table 3.
Table 3 Useful crystallization additives with relative advantages and disadvantages. -
64
Increase the drop volume, that is, going from 4 to 8 μl. This has a twofold effect: an increase in the amount of protein available for crystallization and an increase in the equilibration time of the drop with well solution as a consequence of the lower reservoir/drop volume ratio. It may produce larger crystals.
-
65
Increase protein concentration6: crystals hardly ever form unless the protein concentration largely exceeds its solubility14. Higher nucleation might be observed.
-
66
Perform tests using different reservoir volumes. A smaller volume of the reservoir can alter the kinetics of equilibration between the reservoir and the drop100,101. A lower reservoir/drop volume ratio will in fact slow down equilibration rates. As a general rule, larger crystals with fewer imperfections are obtained if the growth rate is minimized. If your trials produce only microcrystals, reduction of their growth rate can be achieved by the more gradual equilibration, with the reservoir brought about by a decrease in reservoir/drop volume ratio.
-
67
Use agarose or silica gel media for crystal growth. (ref. 7, pp. 127–142) This approach reduces the equilibration rate and provides substantial flexibility and control93,102,103,104.
-
68
If no crystals and only precipitate are the results of the initial screens, bring precipitant/protein concentration ratio to values just below supersaturation, and vary pH and temperature to change the protein solubility.
-
69
If optimization experiments lead to the formation of 'multiple crystals' try obtaining single crystals by (i) exploring new additives as done in the screening experiments, (ii) attempting gel crystallization105, (iii) shifting the phase equilibrium toward the aqueous phase (e.g., increasing ionic strength) to destabilize the crystalline form and prompt the separation the coprecipitated crystals, (iv) changing the pH of crystallization solutions, (v) changing the crystallization temperature, (vi) cocrystallizing with partner proteins/domains or with ligands, (vii) changing the crystallization setup (e.g., from hanging or sitting drop to microbatch), (viii) resorting to DNA shuffling to introduce random mutations.
-
70
If all trials prove unsuccessful, it is worth trying to isolate small crystals or clusters and ask for beamtime on a synchrotron microfocus beamline in order to obtain diffraction from a single domain of a multiple crystal.
-
71
When microcrystalline precipitate is observed and any one of the above optimization strategies has produced useful crystals, evaluate seeding techniques5,6,7. Several seeding techniques are available and are described in Steps 72–98 outlined next.
Optimization of crystallization conditions—crystal nuclei transfer techniques (seeding techniques) General aspects
Timing 60 h–4 d
-
72
Start preparation of crystallization plates with pre-equilibrated protein solution drops (Step 74) before starting the preparation of crystal seeds.
-
73
Transfer the seeds (for any technique used) in the pre-equilibrated plates in duplicate by using both 24 and 48 h pre-equilibrated plates.
-
74
With regard to the preparation of pre-equilibrated protein drops for seeding, ideally, the seeds should be introduced in a protein solution lying in the metastable zone, but determining the metastable zone in the protein phase diagram is very demanding in terms of experimental time and protein supply. The practical alternative to the determination of the phase diagram for the seeding is to prepare, in a 24-wells sitting drop plate, a series of 12 drops (the drops are obtained by mixing 1 μl of protein solution with 1 μl of the appropriate precipitant solution) in which the protein concentration is lowered in steps of 4–5% with respect to the conditions where crystals appeared (i.e., if crystals have been obtained from a 10 mg ml−1 protein solution, prepare 12 drops where the final protein concentration goes from 10 mg ml−1 to 4–5 mg ml−1). The precipitant concentration in the wells remains constant and the same as that used to obtain the initial crystals.
-
75
Prepare the other 12 drops series by keeping the protein concentration constant (i.e., the same as that used to produce the initial crystals) and by lowering the concentration of precipitant in steps of 2–3% with respect to the conditions from which the initial crystals were grown. For example, if crystals were initially obtained from 30% wt/vol PEG 4000, prepare drops where the final PEG concentration in the equilibrated drop will go from 30% wt/vol to approximately 18% wt/vol.
-
76
Duplicate the plate.
Pause point
Let the drops equilibrate at constant temperature for 24 and 48 h.
-
77
Depending on the initial trial results, finer screening grids for seeding can be prepared. Alternative experiments for seeding can be designed45.
Macroseeding (also called seed transfer)
Timing 24 h
-
78
Two different precipitant concentrations for seed washing should be found: (i) a condition in which seed crystals are stable for approximately 15 min, but not more than 1 h, and (ii) a condition in which seed crystals are stable indefinitely7,44. With this aim in mind, set up a series of precipitant concentrations, going from approximately 50% to approximately 150% of the precipitant concentration needed for obtaining the starting crystals, in steps of 10%44.
-
79
Fill the sitting drop bridges (only the bridge!) with approximately 40 μl of the above precipitant solution. Fill the well, around the bridge holding the drop, with water in order to avoid rapid drop evaporation as depicted in Figure 2.
Figure 2 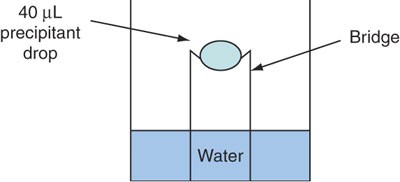
Schematic representation of the sitting drop setup for finding the two precipitant conditions of Step 78.
-
80
Find a sufficient number of crystal seeds that are free of defects (10–20 very thin plates or rods, single prismatic crystals, etc., which are free from evident twinning or any other crystallites).
-
81
Pick up a crystal with a cryo-loop (for description of cryo-loops see for example: http://www.hamptonresearch.com/products/Product.aspx?sid=136), and deposit one crystal in each of the drops prepared in Step 79.
-
82
Observe at periodic intervals up to 12 h. Note the 'survival time' of the crystal in the drop and the precipitant concentration allowing indefinite, 1 h and 15 min survival of the crystal, respectively.
Critical Step
Do not leave your plate on the microscope platform to do this as the lamp will warm up the plate, thus interfering with the experiment.
-
83
Perform a trial wash series, transferring a single crystal from high to low concentration of precipitant, starting with the concentration at which the seed crystals are indefinitely stable, ending with a concentration at which seeds are only stable for 15 min to 1 h. Modify, if necessary, on either end of the concentration range, to keep your crystal intact. Seeds are washed in a slightly dissolving solution to remove the top layer of protein, which contains possible defects, from the surface of the seed without causing excessive etching or cracking.
-
84
Transfer the seed to a pre-equilibrated drop prepared as in Steps 74–76.

Microseeding
Timing 24 h
-
85
To prepare a microseed suspension, wash seeding material as in Steps 78–83, to remove amorphous precipitate.
-
86
Stabilize the seeding material by suspending it in a nondissolving precipitant solution (usually 10–20% above the precipitant concentration from which initial crystals appeared) and by working at a temperature that does not dissolve it.
-
87
Prepare a seed stock suspension by crushing the seeding material (crystals) in the above solution. For crushing, put the solution in an Eppendorf tube together with glass spheres and use a Vortex mixer.
Pause point
This seed stock solution can be stored at constant temperature (i.e., temperature that does not dissolve the crystals) for later use. The seed stock solution is likely to be stable for at least 12 h.
-
88
Perform serial dilutions of the seed stock solution with the precipitant solution used in Step 86, to reach final dilutions of 1 in 1,000 to 1 in 10,000,000. Sequential dilutions are absolutely necessary, since the stock seed solution contains too many nuclei to be useful in the nucleation of only a small number of crystals.
-
89
Introduce microseeds from different dilutions into new pre-equilibrated (24–48 h) drops either by pipetting the nuclei from the stock as a small aliquot (0.1–1 μl) or by transferring them with a seeding wand that is dipped into the microseed mixture to pick up seeds and then touched, stirred or streaked across the surface of the new drop6. Observe the seeded drops every 24 h.
-
90
If nucleation appears to be independent of the dilution of the seed solutions, lower the precipitant concentration in the pre-equilibrated solutions.
-
91
If crystals do not appear in any of the pre-equilibrated drops, increase the precipitant concentration in the solutions to be equilibrated.
-
92
If going from a pre-equilibrated condition to the next, there is a sudden decrease in the number of crystals obtained, design a finer grid around these conditions.
Streak seeding
Timing 3 h
-
93
Mount an animal whisker (not commercially available) on the end of a wand with melted wax.
-
94
Degrease the whisker with ethanol/methanol, wash in water and dry. Alternatively, wash a previously used seeding tool with water and dry, or use the seeding tool from Hampton Research (for the seeding tool description see Hampton Research cat. no. 8-133).
-
95
Touch with the whisker (seeding tool) a crystal obtained in the optimization of crystallization section: seeds will be dislodged by friction.
-
96
Streak the whisker (seeding tool) across the centre of pre-equilibrated (24–48 h) drops (Steps 74–76). A good whisker should be able to transfer seeds evenly to up a dozen drops. This process can be repeated seven to ten times in order to improve the quality and size of the crystal46,47.
Critical Step
Keep the distance the whisker travels in air to a minimum, as in this process the seeds may dehydrate and degrade. Also, the time lapse for which the pre-equilibrated drop wells are open, should be kept to a minimum.
Critical Step
Sitting drops provide better performance than hanging drops for streak seeding, as they do not dry out as much while the cover slip is off.
-
97
Along with streak seeding tries, evaluate also the effect that different additives have in the protein sample drop. Additives to consider include salts, polyols, divalent cations, detergents, chaotropes, organic solvents, ligands and cofactors.
Cross-seeding and epitaxial
Timing 24 h
-
98
To implement cross-seeding, use as nucleation starter-crystals of proteins in some way related to the protein being probed, such as mutants. Different mineral samples (i.e., mica and apophyllite) may instead be used as epitaxial nucleants. Recent studies demonstrate that porous materials, such as porous silicon, with porous sizes comparable to the size of the protein molecules, display nucleation-inducing properties. Specific experimental methods for cross-seeding and epitaxial are not different from the ones already detailed, therefore apply the approach described in Steps 74–9748,49,50,51,106.
Examination of the crystallization experiments in the final stages of optimization
-
99
When we are aiming for highly ordered, relatively large crystals (see INTRODUCTION for crystal size definition), it is better not to disturb the crystal growth. Wait for few days or even 1 or 2 weeks before checking the seeding experiments.
Troubleshooting
Troubleshooting advice can be found in Table 4.
Timing
Preliminary sample preparation and characterization: 30 h–5 d
Protein solubility screens—selection of the appropriate protein concentration for crystallization: 4 h–4 d
Fast screening of crystallization conditions: 2 h for manual preparation of 96 different conditions
Optimization of crystallization conditions—chemical and physical variables: 24 h–48 h
Optimization of crystallization conditions—crystal nuclei transfer techniques (seeding techniques): 60 h–4 d
Note that the above mentioned time intervals are rough estimates. They depend on the operator skill and refer exclusively to the time needed to accomplish the practical aspects of the protocol and do not involve the time needed to observe the outcome of the different experiments performed.
Anticipated results
The following is an example of a grid designed upon observing precipitate formation in a screen from our laboratory:
Grid for OXA-48 enzyme. At a protein concentration of 6 mg ml−1 a precipitate was observed with PEG 4000 20% wt/vol and pH 8.5 in Tris–HCl buffer:
PEG 4000% (wt/vol) 4, 6, 8, 10, 12, 14, 16, 18, 20 each concentration tested versus pH values: 4.5, 5.0, 5.5, 6.0, 6.5, 7.0, 7.5, 8.0, 8.5 (overall a 9 × 9 grid).
The case of the CutA1 protein from Escherichia coli
CutA1 is a small protein of approximately 12 kDa that is widespread in nature from bacteria to plants, animals and humans. The protein was originally identified in a gene locus of Escherichia coli called cutA that is known to be involved in divalent metal ions tolerance, but its specific role in the different organisms was not clear. In order to shed light on the function of the protein, we started a structural determination project of one representative protein from the bacteria (E. coli CutA1) and one from mammals (rat CutA1)67.
The E. coli protein used for the initial crystallization screenings was highly pure and well folded, as indicated by mass spectra and NMR spectroscopy, respectively, and the concentrated solutions appeared to be stable for several days.
Despite the favorable data from the preliminary sample characterization, the initial crystallization screenings of E. coli CutA1 provided only amorphous precipitates. Similarly, every attempt to vary the parameters that are usually the most important effectors of crystallization (pH, precipitant type and temperature) led to complete failures.
The key to the successful crystallization of the E. coli CutA1 was the exploration of the idea that the Cys residues present in the E. coli sequence were not engaged in disulfide bridges, as originally assumed, but in fact exposed to solvent. These residues would thus be subject to oxidation with formation of intermolecular aggregates, which would precipitate during the crystallization trial. Under this hypothesis, we treated the protein solution with p-hydroxy-mercury benzoic acid (an organomercury compound were the Hg atom can exchange his OH group with a SH group from a Cys residue) in a protein/additive ratio of 1/3 (one Hg atom for each of the three Cys present in the sequence) and repeated the crystallization screen.
Success was immediate, and we obtained high-quality crystals (1.5 Å diffraction limit). As revealed by the crystal structure, the p-hydroxy-mercury benzoate molecule protects the Cys sulfidryl group from reacting. At the same time, this mercury–protein adduct provides an excellent heavy atom derivative, which we used for the successful structure determination by multiwavelength anomalous diffraction measurements at the Hg edge67. The crystal structure (PDB code 1NAQ) revealed a trimeric quaternary structure for CutA1 with all Cys exposed to solvent covalently modified by the Hg-compound.
Please note that the material safety data sheet (MSDS) for p-hydroxy-mercury benzoic acid is available at https://fscimage.fishersci.com/msds/71467.htm. However, the same general precautions related to every organomercury compound apply.
The case of Bacillus subtilis superoxide dismutase
While facing the difficult task to crystallize a superoxide dismutase-like protein from Bacillus subtilis (BsSOD) we ran some NMR experiments, which revealed that BsSOD was only partially structured in solution61,107. The NMR data demonstrated the existence of secondary structure elements that fluctuate over several different conformations in solution. We still proceeded with the screening procedure outlined in this protocol, and one of the screens revealed that the protein readily precipitated as amorphous material when a zinc chloride solution was added. This observation alerted us that the Zn(II) ion should cause protein aggregation and precipitation. We then set up a screen by using Zn(II) concentration as a variable and eventually we were able to grow well diffracting crystals of the protein. The crystal structure revealed that the zinc ion is responsible of the formation of a BsSOD dimer by establishing intermolecular coordination bonds with properly positioned Asp and His side chains located at the surface of the protein61. The coordination bonds promote a transition from a disordered structure to a completely folded structure of BsSOD. The experiment, illustrated earlier, suggests that engineering such sites at the surface of a protein might provide an additional tool in the hands of protein crystallographers able to promote the folding of protein lying in a molten-globule-like state25. A research project to explore the possibility to use this method to crystallize such proteins has been started in our laboratory.
The case of yeast copper thionein
The story of yeast copper metallothionein (Cu–MT) provides an example of the use of information from NMR spectroscopy to achieve successful crystallization of a difficult protein24.
Cu–MT contains 53 aa, out of which 12 are Cys and 6–8 copper (I) ions. Crystallization attempts of Cu–MT date back to the protein's discovery in 1975 (ref. 108) and have always failed. NMR measurements on Cu–MT solutions provided evidence that 4 residues at the N-terminus and 13 residues at the C-terminus were disordered and that two Cys located in the disordered C-terminal part were not involved in copper coordination.
These results suggested that the observed disorder could be responsible for the failures of Cu–MT crystallization and a minimal construct was produced lacking the first 4 and the last 13 residues of yeast MT. Subsequent extensive NMR analysis showed that, whatever their structure, the seven copper ions are arranged identically within this minimal frame as they are in the native Cu7-MT109. After several attempts, small but suitable crystals for x-ray analysis could be indeed obtained from this construct, and diffraction data of good quality were measured at a synchrotron radiation source24.
References
Berman, H., Henrick, K., Nakamura, H. & Markley, J.L. The worldwide Protein Data Bank (wwPDB): ensuring a single, uniform archive of PDB data. Nucleic Acids Res. 35, D301–D303 (2007).
Vainshtein, B.K. Modern Crystallography I Symmetry of Crystals, Methods of Structural Crystallography (Springer-Verlag, Berlin, 1981).
Chayen, N.E. Turning protein crystallisation from an art into a science. Curr. Opin. Struct. Biol. 14, 577–583 (2004).
McPherson, A. Introduction to protein crystallization. Methods 34, 254–265 (2004).
McPherson, A. Crystallization of Biological Macromolecules (Cold Spring Harbor Laboratory Press, Cold Spring Harbor, NY, 1999).
Bergfors, T.M. Protein Crystallization: Techniques, Strategies and Tips (International University Line, La Jolla, CA, 1999).
Ducruix, A. & Giége, R. Crystallization of Nucleic Acids and Proteins, A Practical Approach. (IRL Press, Oxford, UK, New York, 1992).
Michel, H. Crystallization of Membrane Proteins (CRC Press, Boca Raton, 1991).
Iwata, S. Methods & Results in Crystallization of Membrane Proteins (IUL Biotechnology Series, La Jolla, CA, 2003).
Hunte, C., von Jagow, G. & Shagger, H. Membrane Protein Purification and Crystallization: A Practical Guide (Academic Press, New York, 2002).
Caffrey, M. Membrane protein crystallization. J. Struct. Biol. 142, 108–132 (2003).
Wiener, M.C. A pedestrian guide to membrane protein crystallization. Methods 34, 364–372 (2004).
Lundstrom, K. Structural genomics on membrane proteins: mini review. Comb. Chem. High Throughput Screen. 7, 431–439 (2004).
Asherie, N. Protein crystallization and phase diagrams. Methods 34, 266–272 (2004).
Chernov, A.A. Crystal growth and crystallography. Acta Crystallogr. A 54, 859–872 (1998).
Chayen, N.E. The role of oil in macromolecular crystallization. Structure 5, 1269–1274 (1997).
McPherson, A. Protein crystallization in the structural genomics era. J. Struct. Funct. Genomics 5, 3–12 (2004).
Rupp, B. & Wang, J. Predictive models for protein crystallization. Methods 34, 390–407 (2004).
Rupp, B. High-throughput crystallography at an affordable cost: the TB structural genomics consortium crystallization facility. Acc. Chem. Res. 36, 173–181 (2003).
Sharff, A. & Jhoti, H. High-throughput crystallography to enhance drug discovery. Curr. Opin. Chem. Biol. 7, 340–345 (2003).
Morissette, S.L. et al. High-throughput crystallization: polymorphs, salts, co-crystals and solvates of pharmaceutical solids. Adv. Drug Deliv. Rev. 56, 275–300 (2004).
Stevens, R.C. High-throughput protein crystallization. Curr. Opin. Struct. Biol. 10, 558–563 (2000).
Chayen, N.E. Protein crystallization for genomics: throughput versus output. J. Struct. Funct. Genomics 4, 115–120 (2003).
Calderone, V. et al. The crystal structure of yeast copper thionein: the solution of a long-lasting enigma. Proc. Natl. Acad. Sci. USA 102, 51–56 (2005).
Derewenda, Z.S. & Vekilov, P.G. Entropy and surface engineering in protein crystallization. Acta Crystallogr. D Biol. Crystallogr. 62, 116–124 (2006).
Derewenda, Z.S. The use of recombinant methods and molecular engineering in protein crystallization. Methods 34, 354–363 (2004).
Giege, R. et al. The role of purification in the crystallization of proteins and nucleic acids. J. Cryst. Growth 76, 554–561 (1986).
Zulauf, M. & D'Arcy, A. Light scattering of proteins as a criterion for crystallization. J. Cryst. Growth 122, 102–106 (1992).
Thomas, B.R., Carter, D. & Rosenberger, F. Effect of microheterogeneity on horse spleen apoferritin crystallization. J. Cryst. Growth 187, 499–510 (1998).
Rosenberger, F. Protein crystallization. J. Cryst. Growth 166, 40–54 (1996).
Pusey, M.L. et al. Life in the fast lane for protein crystallization and x-ray crystallography. Prog. Biophys. Mol. Biol. 88, 359–386 (2005).
Pikal-Cleland, K.A. & Carpenter, J.F. Lyophilization-induced protein denaturation in phosphate buffer systems: monomeric and tetrameric beta-galactosidase. J. Pharm. Sci. 90, 1255–1268 (2001).
Carpenter, J.F., Chang, B.S., Garzon-Rodriguez, W. & Randolph, T.W. Rational design of stable lyophilized protein formulations: theory and practice. Pharm. Biotechnol. 13, 109–133 (2002).
McPherson, A., Malkin, A.J., Kuznetsov, Y.G. & Koszelak, S. Incorporation of impurities into macromolecular crystals. J. Cryst. Growth 168, 74–92 (1996).
Saridakis, E. & Chayen, N.E. Systematic improvement of protein crystals by determining the supersolubility curves of phase diagrams. Biophys. J. 84, 1218–1222 (2003).
Saridakis, E. & Chayen, N.E. Improving protein crystal quality by decoupling nucleation and growth in vapor diffusion. Protein Sci. 9, 755–757 (2000).
Nneji, G.A. & Chayen, N.E. A crystallization plate for controlling evaporation in hanging drops. J. Appl. Crystallogr. 37, 502–503 (2004).
Chayen, N.E. Methods for separating nucleation and growth in protein crystallisation. Prog. Biophys. Mol. Biol. 88, 329–337 (2005).
Talreja, S., Kim, D.Y., Mirarefi, A.Y., Zukoski, C.F. & Kenis, P.J.A. Screening and optimization of protein crystallization conditions through gradual evaporation using a novel crystallization platform. J. Appl. Crystallogr. 38, 988–995 (2005).
D'Arcy, A., Sweeney, A.M. & Haber, A. Practical aspects of using the microbatch method in screening conditions for protein crystallization. Methods 34, 323–328 (2004).
Landsberg, M.J., Bond, J., Gee, C.L., Martin, J.L. & Hankamer, B. A method for screening the temperature dependence of three-dimensional crystal formation. Acta Crystallogr. D Biol. Crystallogr. 62, 559–562 (2006).
Przybylska, M. A double cell for controlling nucleation and growth of protein crystals. J. Appl. Crystallogr. 22, 115–118 (1989).
Saridakis, E.E., Stewart, P.D., Lloyd, L.F. & Blow, D.M. Phase diagram and dilution experiments in the crystallization of carboxypeptidase G2. Acta Crystallogr. D Biol. Crystallogr. 50, 293–297 (1994).
Stura, E.A. & Wilson, I.A. Analytical and production seeding techniques. Methods 1, 38–49 (1990).
Bergfors, T. Seeds to crystals. J. Struct. Biol. 142, 66–76 (2003).
Thaller, C. et al. Repeated seeding technique for growing large single crystals of proteins. J. Mol. Biol. 147, 465–469 (1981).
Stura, E.A. & Wilson, I.A. Applications of the streak seeding technique in protein crystallization. J. Cryst. Growth 110, 270–282 (1991).
Chayen, N.E., Saridakis, E. & Sear, R.P. Experiment and theory for heterogeneous nucleation of protein crystals in a porous medium. Proc. Natl. Acad. Sci. USA 103, 597–601 (2006).
Chayen, N.E., Saridakis, E., El Bahar, R. & Nemirovsky, Y. Porous silicon: an effective nucleation-inducing material for protein crystallization. J. Mol. Biol. 312, 591–595 (2001).
Fermani, S., Falini, G., Minnucci, M. & Ripamonti, A. Protein crystallization on polymeric film surfaces. J. Cryst. Growth 224, 327–334 (2001).
Pechkova, E. & Nicolini, C. Accelerated protein crystal growth by protein thin film template. J. Cryst. Growth 231, 599–602 (2001).
Laemmli, U.K. Cleavage of structural proteins during the assembly of the head of bacteriophage T4 . Nature 227, 680–685 (1970).
Spangler, B.D. & Westbrook, E.M. Isolation of isoelectrically pure cholera toxin for crystallization. J. Cryst. Growth 110, 220–227 (1991).
Wilson, W.W. Light scattering as a diagnostic for protein crystal growth—a practical approach. J. Struct. Biol. 142, 56–65 (2003).
Skouri, M., Delsanti, M., Munch, J.P., Lorber, B. & Giege, R. Dynamic light scattering studies of the aggregation of lysozyme under crystallization conditions. FEBS Lett. 295, 84–88 (1991).
Mogridge, J. Using light scattering to determine the stoichiometry of protein complexes. Methods Mol. Biol. 261, 113–118 (2004).
Georgalis, Y. & Saenger, W. Light scattering studies on supersaturated protein solutions. Sci. Prog. 82, 271–294 (1999).
Geerlof, A. et al. The impact of protein characterization in structural proteomics. Acta Crystallogr. D Biol. Crystallogr. 62, 1125–1136 (2006).
Ferre-D'Amare, A.R. & Burley, S.K. Use of dynamic light scattering to assess crystallizability of macromolecules and macromolecular assemblies. Structure 2, 357–359 (1994).
Chayen, N.E. et al. Trends and challenges in experimental macromolecular crystallography. Q. Rev. Biophys. 29, 227–278 (1996).
Banci, L. et al. A prokaryotic superoxide dismutase paralog lacking two Cu ligands: from largely unstructured in solution to ordered in the crystal. Proc. Natl. Acad. Sci. USA 102, 7541–7546 (2005).
Banci, L. et al. Fully metallated S134N Cu, Zn-superoxide dismutase displays abnormal mobility and intermolecular contacts in solution. J. Biol. Chem. 280, 35815–35821 (2005).
Liou, Y.C. et al. Folding and structural characterization of highly disulfide-bonded beetle antifreeze protein produced in bacteria. Protein Expr. Purif. 19, 148–157 (2000).
Mao, H., Gunasekera, A.H. & Fesik, S.W. Expression, refolding, and isotopic labeling of human serum albumin domains for NMR spectroscopy. Protein Expr. Purif. 20, 492–499 (2000).
Jancarik, J., Pufan, R., Hong, C., Kim, S.H. & Kim, R. Optimum solubility (OS) screening: an efficient method to optimize buffer conditions for homogeneity and crystallization of proteins. Acta Crystallogr. D Biol. Crystallogr. 60, 1670–1673 (2004).
Liljas, A. et al. Crystal structure of human carbonic anhydrase C. Nat. New Biol. 235, 131–137 (1972).
Arnesano, F. et al. The evolutionarily conserved trimeric structure of CutA1 proteins suggests a role in signal transduction. J. Biol. Chem. 278, 45999–46006 (2003).
Lepre, C.A. & Moore, J.M. Microdrop screening: a rapid method to optimize solvent conditions for NMR spectroscopy of proteins. J. Biomol. NMR 12, 493–499 (1998).
Izaac, A., Schall, C.A. & Mueser, T.C. Assessment of a preliminary solubility screen to improve crystallization trials: uncoupling crystal condition searches. Acta Crystallogr. D Biol. Crystallogr. 62, 833–842 (2006).
Collins, B.K., Tomanicek, S.J., Lyamicheva, N., Kaiser, M.W. & Mueser, T.C. A preliminary solubility screen used to improve crystallization trials: crystallization and preliminary x-ray structure determination of Aeropyrum pernix flap endonuclease-1. Acta Crystallogr. D. Biol. Crystallogr. 60, 1674–1678 (2004).
Sazaki, G., Kurihara, K., Nakada, T., Miyashita, S. & Komatsu, H. A novel approach to the solubility measurement of protein crystals by two-beam interferometry. J. Cryst. Growth 169, 355–360 (1996).
Nakazato, K., Homma, T. & Tomo, T. Rapid solubility measurement of protein crystals as a function of precipitant concentration with micro-dialysis cell and two-beam interferometer. J. Synchrotron Rad. 11, 34–37 (2004).
Jancarik, J. & Kim, S.H. Sparse matrix sampling: a screening method for crystallization of proteins. J. Appl. Crystallogr. 24, 409–411 (1991).
Cudney, R., Patel, S., Weisgraber, K., Newhouse, Y. & McPherson, A. Screening and optimization strategies for macromolecular crystal growth. Acta Crystallogr. D. Biol. Crystallogr. 50, 414–423 (1994).
Tran, T.T., Sorel, I. & Lewit-Bentley, A. Statistical experimental design of protein crystallization screening revisited. Acta Crystallogr. D Biol. Crystallogr. 60, 1562–1568 (2004).
Boistelle, R. & Astier, J.P. Crystallization mechanism in solution. J. Cryst. Growth 90, 14–30 (1988).
Ng, J.D. et al. The crystallization of biological macromolecules from precipitates: evidence for Ostwald ripening. J. Cryst. Growth 168, 50–62 (1996).
Vedadi, M. et al. Chemical screening methods to identify ligands that promote protein stability, protein crystallization, and structure determination. Proc. Natl. Acad. Sci. USA 103, 15835–15840 (2006).
McPherson, A. et al. The effects of neutral detergents on the crystallization of soluble proteins. J. Cryst. Growth 76, 547–553 (1986).
Hayes, M.E. et al. Assembly of nucleic acid-lipid nanoparticles from aqueous-organic monophases. Biochim. Biophys. Acta 1758, 429–442 (2006).
Guan, R.J., Wang, M., Liu, X.Q. & Wang, D.C. Optimization of soluble protein crystallization with detergents. J. Cryst. Growth 231, 273–279 (2001).
Shulgin, I.L. & Ruckenstein, E. Relationship between preferential interaction of a protein in an aqueous mixed solvent and its solubility. Biophys. Chem. 118, 128–134 (2005).
Tarentino, A.L., Gomez, C.M. & Plummer, T.H. Deglycosylation of asparagine-linked glycans by peptide:N-glycosidase. Biochemistry 24, 4665–4671 (1985).
Grueninger-Leitch, F., D'Arcy, A., D'Arcy, B. & Chene, C. Deglycosylation of proteins for crystallization using recombinant fusion protein glycosidases. Protein Sci. 5, 2617–2622 (1996).
Prota, A.E., Sage, D.R., Stehle, T. & Fingeroth, J.D. The crystal structure of human CD21: Implications for Epstein-Barr virus and C3d binding. Proc. Natl. Acad. Sci. USA 99, 10641–10646 (2002).
Carafoli, F., Chirgadze, D.Y., Blundell, T.L. & Gherardi, E. Crystal structure of the beta-chain of human hepatocyte growth factor-like/macrophage stimulating protein. FEBS J. 272, 5799–5807 (2005).
Nasreen, A., Vogt, M., Kim, H.J., Eichinger, A. & Skerra, A. Solubility engineering and crystallization of human apolipoprotein D. Protein Sci. 15, 190–199 (2006).
Roe, S. Protein Purification Applications: a Practical Approach (Oxford University Press, Oxford, UK, New York, 2001).
Liu, J.-W., Boucher, Y., Stokes, H.W. & Ollis, D.L. Improving protein solubility: the use of the Escherichia coli dihydrofolate reductase gene as a fusion reporter. Protein Expr. Purif. 47, 258–263 (2006).
Chernov, A.A. Protein crystals and their growth. J. Struct. Biol. 142, 3–21 (2003).
Chayen, N.E. Comparative studies of protein crystallization by vapour-diffusion and microbatch techniques. Acta Crystallogr. D. Biol. Crystallogr. 54, 8–15 (1998).
McPherson, A. Jr . The growth and preliminary investigation of protein and nucleic acid crystals for x-ray diffraction analysis. Methods Biochem. Anal. 23, 249–345 (1976).
Cudney, R., Patel, S. & McPherson, A. Crystallization of macromolecules in silica gels. Acta Crystallogr. D. Biol. Crystallogr. 50, 479–483 (1994).
Garcia-Ruiz, J.M. Counterdiffusion methods for macromolecular crystallization. Methods Enzymol. 368, 130–154 (2003).
Garcia-Ruiz, J.M., Gonzalez-Ramirez, L.A., Gavira, J.A. & Otalora, F. Granada crystallisation box: a new device for protein crystallisation by counter-diffusion techniques. Acta Crystallogr. D. Biol. Crystallogr. 58, 1638–1642 (2002).
Papanikolau, Y. et al. Ionic strength reducers: an efficient approach to protein purification and crystallization. Application to two Rop variants. Acta Crystallogr. D Biol. Crystallogr. 60, 1334–1337 (2004).
Anand, K., Pal, D. & Hilgenfeld, R. An overview on 2-methyl-2,4-pentanediol in crystallization and in crystals of biological macromolecules. Acta Crystallogr. D Biol. Crystallogr. 58, 1722–1728 (2002).
Berger, B.W., Blamey, C.J., Naik, U.P., Bahnson, B.J. & Lenhoff, A.M. Roles of additives and precipitants in crystallization of calcium- and integrin-binding protein. Cryst. Growth Des. 5, 1499–1507 (2005).
Wiencek, J.M. New strategies for protein crystal growth. Annu. Rev. Biomed. Eng 1, 505–534 (1999).
Forsythe, E.L., Maxwell, D.L. & Pusey, M. Vapor diffusion, nucleation rates and the reservoir to crystallization volume ratio. Acta Crystallogr. D Biol. Crystallogr. 58, 1601–1605 (2002).
Walter, T.S. et al. A procedure for setting up high-throughput nanolitre crystallization experiments. Crystallization workflow for initial screening, automated storage, imaging and optimization. Acta Crystallogr. D Biol. Crystallogr. 61, 651–657 (2005).
Wolfova, J., Grandori, L., Chatterjee, N., Carey, J. & Smatanova, I.K. Crystallization of the flavoprotein WrbA optimized by using additives and gels. J. Cryst. Growth 284, 502–505 (2005).
Moreno, A., Theobald-Dietrich, A., Lorber, B., Sauter, C. & Giege, R. Effects of macromolecular impurities and of crystallization method on the quality of eubacterial aspartyl-tRNA synthetase crystals. Acta Crystallogr. D Biol. Crystallogr. 61, 789–792 (2005).
Kinoshita, T., Ataka, M., Warizaya, M., Neya, M. & Fujii, T. Improving quality and harvest period of protein crystals for structure-based drug design: effects of a gel and a magnetic field on bovine adenosine deaminase crystals. Acta Crystallogr. D Biol. Crystallogr. 59, 1333–1335 (2003).
Sica, F. et al. Elimination of twinning in crystals of Sulfolobus solfataricus alcohol dehydrogenase holo-enzyme by growth in agarose gels. Acta Crystallogr. D Biol. Crystallogr. 50, 508–511 (1994).
McPherson, A. & Schlichta, P. The use of heterogeneous and epitaxial nucleants to promote the growth of protein crystals. J. Cryst. Growth 90, 47–50 (1988).
Banci, L. et al. From an inactive prokaryotic SOD homologue to an active protein through site-directed mutagenesis. J. Am. Chem. Soc. 127, 13287–13292 (2005).
Prinz, R. & Weser, U. A naturally occurring Cu-thionein in Saccharomyces cerevisiae . Hoppe Seylers. Z. Physiol Chem. 356, 767–776 (1975).
Luchinat, C. et al. The Cu(I)(7) cluster in yeast copper thionein survives major shortening of the polypeptide backbone as deduced from electronic absorption, circular dichroism, luminescence and (1)H NMR. J. Biol. Inorg. Chem. 8, 353–359 (2003).
Sousa, R. Use of glycerol, polyols and other protein structure stabilizing agents in protein crystallization. Acta Crystallogr. D. Biol. Crystallogr. 51, 271–277 (1995).
Farnum, M. & Zukoski, C. Effect of glycerol on the interactions and solubility of bovine pancreatic trypsin inhibitor. Biophys. J. 76, 2716–2726 (1999).
Charron, C., Kadri, A., Robert, M.C., Giege, R. & Lorber, B. Crystallization in the presence of glycerol displaces water molecules in the structure of thaumatin. Acta Crystallogr. D. Biol. Crystallogr. 58, 2060–2065 (2002).
Trakhanov, S. & Quiocho, S.A. Influence of divalent cations in protein crystallization. Protein Sci. 4, 1914–1919 (1995).
Carbonnaux, C., Ries-Kautt, M. & Ducruix, A. Relative effectiveness of various anions on the solubility of acidic Hypoderma lineatum collagenase at pH 7.2. Protein Sci. 4, 2123–2128 (1995).
Vaney, M.C. et al. Structural effects of monovalent anions on polymorphic lysozyme crystals. Acta Crystallogr. D. Biol. Crystallogr. 57, 929–940 (2001).
Ries-Kautt, M.M. & Ducruix, A.F. Relative effectiveness of various ions on the solubility and crystal growth of lysozyme. J. Biol. Chem. 264, 745–748 (1989).
Dauter, Z. & Dauter, M. Entering a new phase. Using solvent halide ions in protein structure determination. Structure 9, R21–R26 (2001).
Dauter, Z., Dauter, M. & Rajashankar, K.R. Novel approach to phasing proteins: derivatization by short cryo-soaking with halides. Acta Crystallogr. D. Biol. Crystallogr. 56, 232–237 (2000).
Dauter, Z. New approaches to high-throughput phasing. Curr. Opin. Struct. Biol. 12, 674–678 (2002).
Lorber, B., Delucas, L.J. & Bishop, J.B. Changes in the physico-chemical properties of the detergent octyl glucoside during membrane protein crystallization using salts as the precipitant. J. Cryst. Growth 110, 103–113 (1991).
Gebicka, L. & Gebicki, J.L. Kinetic studies on the interaction of ferricytochrome c with anionic surfactants. J. Protein Chem. 18, 165–172 (1999).
Acknowledgements
We thank R. Leone for help in collecting some of the crystal images. This work was supported by MIUR (PRIN 2005, Prot. N. 2005039878, Prot. N. 4455) and by the University of Siena PAR2005.
Author information
Authors and Affiliations
Corresponding author
Ethics declarations
Competing interests
The authors declare no competing financial interests.
Rights and permissions
About this article
Cite this article
Benvenuti, M., Mangani, S. Crystallization of soluble proteins in vapor diffusion for x-ray crystallography. Nat Protoc 2, 1633–1651 (2007). https://doi.org/10.1038/nprot.2007.198
Published:
Issue Date:
DOI: https://doi.org/10.1038/nprot.2007.198
This article is cited by
-
Growing and making nano- and microcrystals
Nature Protocols (2023)
-
A solution processible single-crystal porous organic polymer
Nature Synthesis (2023)
-
Macromolecular crystallization: basics and advanced methodologies
Journal of the Iranian Chemical Society (2021)
-
Positive Effects of Isopropanol as a Co-Precipitant in Glycerol-3-Phosphate Acyltransferase Crystallization
Journal of Ocean University of China (2019)
-
Characterizing metal-binding sites in proteins with X-ray crystallography
Nature Protocols (2018)
Comments
By submitting a comment you agree to abide by our Terms and Community Guidelines. If you find something abusive or that does not comply with our terms or guidelines please flag it as inappropriate.
