Abstract
We previously reported that molecular hydrogen (H2) acts as a novel antioxidant to exhibit multiple functions. Moreover, long-term drinking of H2-water (water infused with H2) enhanced energy expenditure to improve obesity and diabetes in db/db mice accompanied by the increased expression of fibroblast growth factor 21 (FGF21) by an unknown mechanism. H2 was ingested by drinking of H2-water or by oral administration of an H2-producing material, MgH2. The comprehensive gene expression profile in the liver of db/db mice was analyzed by DNA microarray. The molecular mechanisms underlying the gene expression profile was investigated using cultured HepG2 cells. Moreover, the effects on lifespan of drinking H2-water were examined using wild-type mice that were fed a fatty diet. Pathway analyses based on comprehensive gene expression revealed the increased expression of various genes involved in fatty acid and steroid metabolism. As a transcription pathway, the PPARα signaling pathway was identified to upregulate their genes by ingesting H2. As an early event, the gene expression of PGC-1α was transiently increased, followed by increased expression of FGF21. The expression of PGC-1α might be regulated indirectly through sequential regulation by H2, 4-hydroxy-2-nonenal, and Akt/FoxO1 signaling, as suggested in cultured cell experiments. In wild-type mice fed the fatty diet, H2-water improved the level of plasma triglycerides and extended their average of lifespan. H2 induces expression of the PGC-1α gene, followed by stimulation of the PPARα pathway that regulates FGF21, and the fatty acid and steroid metabolism.
Introduction
We previously reported that molecular hydrogen (H2) acts as a novel antioxidant and effectively protects cells against oxidative stress.1 Subsequently, it was revealed that H2 exhibits multiple functions, including anti-inflammation, anti-apoptosis, anti-allergy and regulation of differentiation, in addition to anti-oxidative functions.2,3 Many publications have strongly suggested that H2 has potential for broad therapeutic and preventive applications because of its lack of adverse effects.3 In addition to extensive animal experiments, >10 papers on clinical studies have been published, including on double-blinded clinical studies for patients with Parkinson’s disease and rheumatism.4,5 The field of hydrogen medicine is highly expected to deliver actual medical applications in many diseases.
In addition to anti-oxidative roles, we reported the benefit of ad libitum drinking of H2-water (water infused with H2) for type 2 diabetes using db/db obesity model mice that lack the functional leptin receptor.6 Long-term drinking of H2-water significantly decreased body and fat weights, and the levels of plasma glucose, insulin, and triglyceride. Importantly, the db/db mice ingested the same amounts of water and diet. Moreover, we found enhanced expression of a hepatic hormone, fibroblast growth factor 21 (FGF21), which is known to function to enhance fatty acid and glucose expenditure.6 On the other hand, the phosphoenolpyruvate carboxykinase (PEPCK) and glucose-6-phosphatase, catalytic subunit (G6PC) genes involved in gluconeogenesis were not affected.6 These results suggest the potential benefit of H2 in improving obesity, diabetes, and metabolic syndrome. In fact, drinking H2-water improved nonalcoholic steatohepatitis (NASH) model mice7 and a clinical study indicated that it caused a decrease in low-density lipoprotein in patients with metabolic syndrome.8
To understand the molecular mechanism by which H2 stimulates energy metabolism, it needs to be clarified whether long-term drinking of H2-water (e.g., for 3 months) primarily regulates gene expression to exhibit phenotypic change or conversely phenotypic changes influence gene expression as a secondary consequence.
To reveal the causal association among drinking H2-water, gene expression and phenotypes, we comprehensively analyzed time-dependent expression by microarray, and found that H2 stimulates the gene expression of a transcriptional coactivator, peroxisome proliferator-activated receptor-γ coactivator-1α (PGC-1α), as an early event, followed by activation of the peroxisome proliferator-activated receptor α (PPARα) pathway to transcribe the genes involved in fatty acid metabolism. The expression of PGC-1α might be regulated indirectly through sequential regulation by H2, 4-hydroxy-2-nonenal (4-HNE), and the Akt (or Protein Kinase B (PKB))/Forkhead box protein O1 (FoxO1) signaling. In addition, we show that drinking H2-water improved plasma triglycerides and extended the average of lifespan of the wild-type mice that were fed a fatty diet.
Results
Long-term consumption of H2-water increased the expression of various hepatic metabolic genes
To clarify the causal association in drinking H2-water between gene expression and stimulated energy metabolism, we attempted to identify the changes in gene expression at the early stage before a phenotype appears. When H2-water was given for 14 days, no significant phenotype was observed as judged by body weight and the plasma levels of glucose and triglyceride (Supplementary Figure S1). Thus, we comprehensively screened all genes by DNA microarray on day 14 in order to explore candidate genes that induce the appearance of a phenotype. The hepatic gene expression profiles in mice drinking both H2-water and degassed version as control water were examined using Agilent cDNA microarray technology. Analysis was performed on three samples in each group to evaluate the statistical significance of differences.
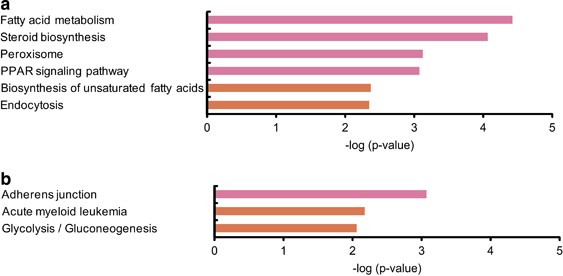
A total of 1,886 genes were significantly differentially expressed, including 1,344 upregulated genes and 542 downregulated ones shown as a heat map panel (Supplementary Figure S2); however, there were no genes for which the expression level changed more than twofold in the H2-water group and that belong to the Kyoto Encyclopedia of Genes and Genomes (KEGG) pathway DataBase, suggesting that the effects of H2 are mild. As the change in the expression of each gene was small but significant, the candidate genes were explored using KEGG pathway analysis. For the analysis on the upregulated genes, six KEGG pathways were found to be significantly changed (P<0.01; Figure 1a). Among these pathways, four pathways were highly significant at P<0.001. For the analysis on the downregulated genes, three KEGG pathways were found to be significantly changed (P<0.01; Figure 1b).
Microarray-based pathway analysis of genes affected by 14 days of consumption of H2. Top-ranked pathways involving (a) upregulated and (b) downregulated genes by drinking H2-water for 14 days. Db/db mice were given water with or without H2 for 2 weeks. Total RNA was prepared from the liver and DNA microarray analysis was performed. All microarray data were subjected to the KEGG (Kyoto Encyclopedia of Genes and Genomes) pathway analysis. The results are expressed as −log (P value). Pink bar, P<0.001; orange bar, P<0.01.
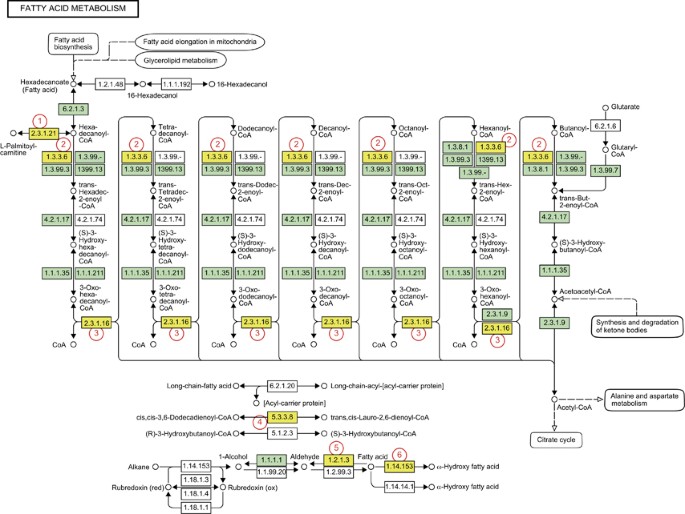
Among these pathways, fatty acid metabolism was identified as only one pathway changed at P<0.0001. Reverse transcription PCR analysis confirmed the significantly increased expression of genes that are involved in fatty acid metabolism (Supplementary Figure S3). The relationships among genes involved in fatty acid metabolism, steroid biosynthesis, peroxisome, and the PPAR signaling pathway are illustrated according to the KEGG pathway (Figure 2, Supplementary Figures S4–S6, respectively). Although the genes sodecenoyl-coenzyme A delta isomerase (Dci) and aldehyde dehydrogenase (Aldh3aa2) associated with fatty acid metabolism are not currently classified as members of the PPARα pathway in the KEGG DataBase, they are target genes of PPARα, as described in a previous report.9 In addition, the PPARα pathway is known to regulate steroid metabolism as well as fatty acid metabolism.9,10 Thus, we focus on the PPARα pathway as the early event that H2 causes.
Hydrogen enhances the expression of a wide variety of fatty acid metabolism-related genes. Differentially expressed genes identified in the KEGG pathway database related to the fatty acid metabolic pathway are shown. Genes for which the expression was significantly increased by H2-water in the pathway are indicated in yellow: (1) carnitine palmitoyltransferase 1a, liver (Cpt1a); (2) acyl-coenzyme A oxidase 1, palmitoyl (Acox1); (3) acetyl-coenzyme A acyltransferase (Acaa1a, Acaa1b); (4) dodecenoyl-coenzyme A delta isomerase (3, 2-trans-enoyl-coenyme A isomerase) (Dci), peroxisomal delta3, delta2-enoyl-coenzyme A isomerase (Peci); (5) aldehyde dehydrogenase (Aldh1a1, Aldh3a2, Aldh1l1); (6) cytochrome P450, family 4, subfamily a, polypeptide (Cyp4a32, Cyp4a31, Cyp4a10).
Consumption of H2-water induces hepatic PGC-1α gene expression
As shown above, H2 influences gene expression upon 2 weeks of its consumption. We also investigated the effect of H2 for shorter periods. Although an amount of H2 in H2-water is limited, MgH2 can produce a desired quantity of H2 by the following reaction in the stomach.
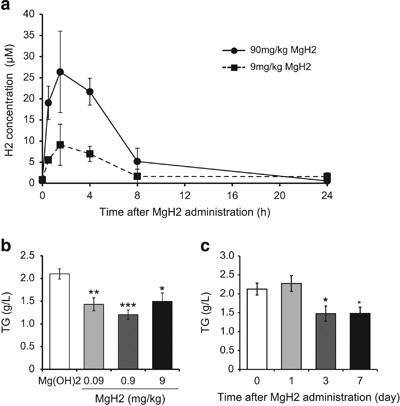
When rats can be orally given MgH2, blood H2 slowly increased in a dose-dependent manner (Figure 3a). When mice were given MgH2 once a day for 4 weeks, the level of plasma triglyceride decreased at the maximum dose of 0.9 mg/kg (Figure 3b). Mg(OH)2 was administered exactly in the same way as a control to avoid the effects of any extrinsic factors. An effect on plasma triglycerides was observed by a single administration per day for 3 days (Figure 3c).
H2 is detected in blood after oral administration of MgH2 and reduced plasma triglyceride level of db/db mice. (a) Rats were administered MgH2 suspension orally by stomach gavage at 9 mg/kg or 90 mg/kg. After 0.5, 1.5, 4, 8, and 24 h, hydrogen concentration in blood was quantified using gas chromatography, as described in Materials and Methods. (b) Db/db mice were given 0.09, 0.9 or 9 mg/kg MgH2 for 28 days. An equal amount of Mg(OH)2, which was produced by 9 mg/kg MgH2, was used as a control. Plasma concentrations of triglycerides are shown as mean±s.e.m. (n=15). *P<0.05, **P<0.01, ***P<0.001. (c) Db/db mice were given 0.9 mg/kg MgH2 for 0, 1, 3, and 7 days. Plasma concentrations of triglycerides are shown as mean±s.e.m. (n=15). *P<0.05.
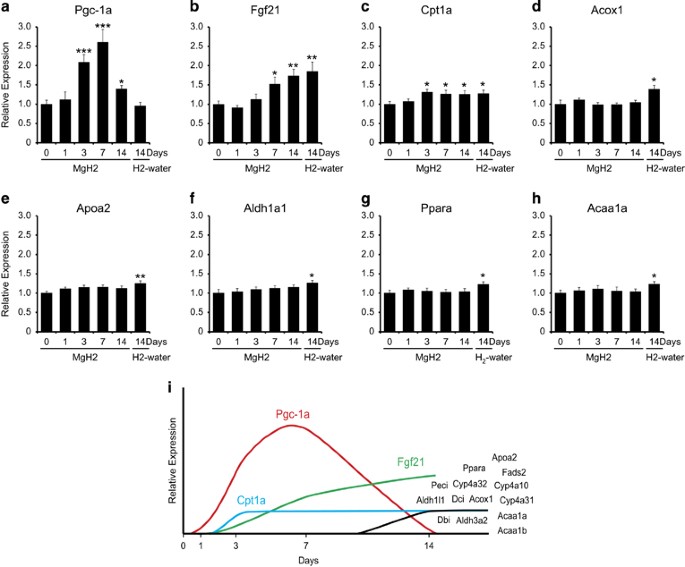
We performed microarray analysis to examine gene expression change by 1, 3, and 7 days of administration of MgH2. One day after administration, there was no significant change in gene expression among the genes selected by the result of 2-week H2-water consumption (Supplementary Figure S7). Whole-genome analysis by microarray showed that PGC-1α expression in db/db mice increased markedly upon 3 days and 7 days of administration, which was confirmed by reverse transcription PCR (Figure 4a). After 3 days of administration of MgH2, carnitine palmitoyltransferase 1A (Cpt1a) gene expression increased, and after 7 days of administration, FGF21 gene expression increased significantly (Figure 4b, c). In contrast, the expression of PGC-1α in C57BL/6 wild-type was not affected by the oral administration of MgH2 (Supplementary Figure S8). This result suggested that the expression PGC-1α is stimulated by H2 only in some pathogenic status.
Three days of consumption of H2-water induces hepatic PGC-1α gene expression. (a–h) Quantitative RT-PCR analysis was used to confirm the differential expression of genes identified by microarray and pathway analyses. A total of eight genes were selected for primer design. The effects of consuming hydrogen for 1–14 days on hepatic gene expression in db/db mice were analyzed. Data are mean±s.e.m. *P<0.05, **P<0.01, ***P<0.001, versus 0 days (n=9). (i) Scheme of gene expression pattern affected by H2. RT-PCR, Reverse transcription PCR.
The expression of PGC-1α is regulated sequentially through H2, 4-HNE, Akt, and FoxO1
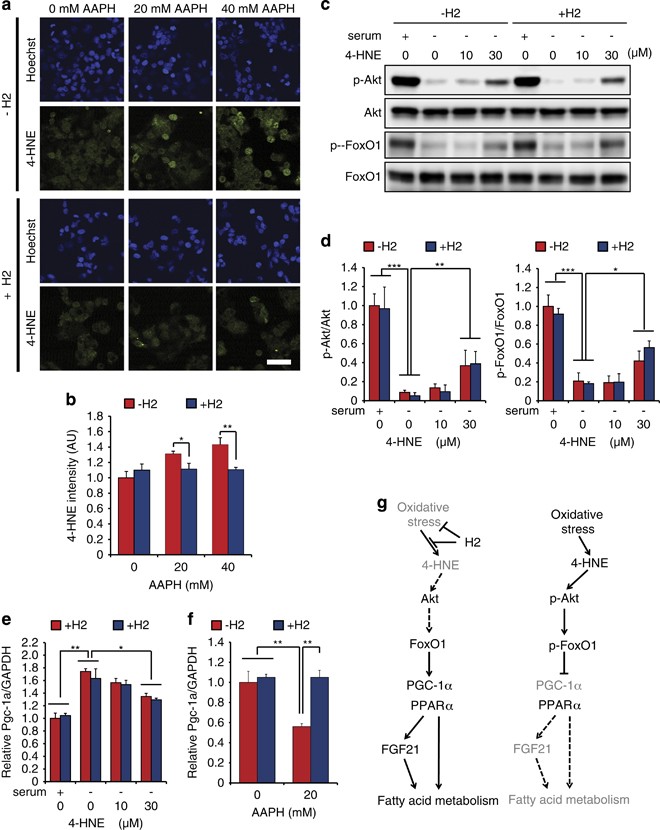
Next, the molecular pathway to upregulate PGC-1α was investigated using a hepatocyte-derived cultured cell line (HepG2). We previously reported that H2 reduces cellular hydroxyl radicals, which is a trigger of the free-radical chain reaction, so it should prevent the free-radical chain reaction, resulting in decreases in peroxides and their end products including 4-HNE.1,11,12 Growing evidence suggests specific functions of 4-HNE as a second messenger in oxidative stress signaling.13,14 Moreover, oxidative stress is increased by obesity.15,16 Thus, we speculated that 4-HNE is initially involved in the pathway. Indeed, we demonstrated that H2 decreased 4-HNE in the presence of a free-radical inducer, 2,2′-azobis(2-amidinopropane) dihydrochloride in HepG2 cells (Figure 5a, b).
Effects of H2 on 4-HNE production and 4-HNE-induced Akt/FoxO1 signaling. (a, b) Effect of H2 on 4-HNE generation. HepG2 cells were treated with AAPH at the indicated concentrations for 6 h in the absence or presence of 10% H2. (a) Representative images of 4-HNE immunostaining (Scale bar: 50 μm). (b) 4-HNE staining was semi-quantified. *P<0.05 vs. **P<0.01 vs. no H2 (n=3) (c, d) Effects of 4-HNE on Akt/FoxO1 signaling. Cells were treated with 4-HNE at the indicated concentrations for 1 h with (+serum) or without (−serum) of 10% fetal bovine serum in the presence (+H2) or absence (−H2) of 50% H2. Cells were lysed, and phosphorylation of Akt and FoxO1 was analyzed by western blotting. (c) Representative western blot of three independent experiments. (d) Quantification of the blots. The amounts of phosphorylated proteins were normalized with the corresponding total protein. Data are shown as mean±s.d. (n=3). *P<0.05, **P<0.01 and ***P<0.001. (e) Effects of H2 on 4-HNE-induced suppression of PGC-1α gene expression. Cells were treated with 4-HNE at the indicated concentrations for 6 h in the presence or absence of 50% H2 under a serum-free condition. Total RNA was prepared from the cells, and the expression of the PGC-1α gene level was estimated using quantitative RT-PCR analysis. Data are mean±s.d. (n=3). *P<0.05 and **P<0.01. (f) HepG2 was exposed to AAPH for 6 h in the absence (−H2) or presence (+H2) of 10% H2, and then the expression of the PGC-1α gene level was estimated as described above. Data are mean±s.d. (n=3). **P<0.01. (g) A hypothetical model of effects of H2. H2 suppresses oxidative stress, especially the generation of lipid peroxides and their end products including 4-HNE. The phosphorylation of Akt, followed by the phosphorylation of FoxO1 (a transcription factor of the PGC-1α gene), is recovered by 4-HNE. Thus, H2 indirectly suppresses the phosphorylations of Akt and FoxO1 through suppressing 4-HNE generation. Because the phosphorylated FoxO1 is an inactive form, H2 indirectly recoveres the expression of the PGC-1α gene. The recovered PGC-1α expression leads to the PPARα pathway that upregulates FGF21, and fatty acid and steroid metabolism. AAPH, 2,2′-azobis(2-amidinopropane) dihydrochloride; RT-PCR, reverse transcription PCR.
Because PGC-1α is transcribed by transcription factors, forkhead box protein O1 (FoxO1) and cAMP-response element-binding protein, using each of their dependent promoters,17 and FoxO1 is phosphorylated by phosphorylated PKB or Akt, causing nuclear exclusion, resulting in suppression of the expression of PGC-1α.17 We found that 4-HNE recovered the phosphorylations of Akt and FoxO1 under a serum-free condition (Figure 5c, d); however, H2 did not affect these phosphorylations (Figure 5c, d). In contrast, 4-HNE downregulated PGC-1α expression (Figure 5e). Importantly, H2 did not directly affect the regulation of PGC-1α in the presence or absence of 4-HNE (Figure 5e); however, H2 recovered the PGC-1α expression that was suppressed by 2,2′-azobis(2-amidinopropane) dihydrochloride (Figure 5f). Thus, the expression of PGC-1α is possibly regulated by the pathway sequentially though H2, 4-HNE, the phosphorylation of Akt and FoxO1. The speculative molecular mechanism is illustrated in Figure 5g based on these experiments using HepG2 cells.
Drinking H2-water improves triglycerides and lifespan
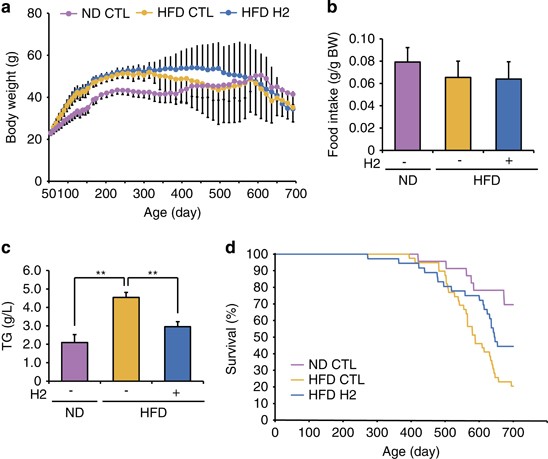
Finally, we examined the effects of the H2-water in wild-type mice that were fed a fatty diet instead of db/db mice. H2-water did not affect body weight and food intake (Figure 6a, b); however, drinking H2-water decreased the plasma level of triglycerides and increased the average of lifespan (Figure 6c, d). Thus, drinking H2-water could be beneficial for wild-type mice fed with a fatty diet.
Consuming H2-water reduces plasma triglyceride levels and extends lifespan in DIO (diet-induced obesity) mice. C57BL/6 mice were fed a normal diet (ND) or a high-fat diet (HFD) with or without H2-water for 74 weeks. (a) Body weights of mice were measured every 2 weeks throughout the experiment. Data are mean±s.d. (b) Average food intakes per body weight are shown. Data are mean±s.d. (c) Plasma triglyceride concentrations are shown. Data are mean±s.e.m. **P<0.01 (n=4–6). (b) Survival curves for C57BL/6 mice fed ND or HFD with or without H2-water. Lifespan was increased (P=0.032) in the H2-consuming HFD group compared with that in the control HFD group (ND group: n=23, HFD control water group: n=38, HFD H2-water group: n=36). (c) Body weights of mice were measured every 2 weeks throughout the experiment. Data are mean±s.d. (d) Average food intakes per body weight are shown. Data are mean±s.d.
Discussion
Our previous study indicated that 3 months of consumption of H2-water improved obesity (body-fat weight) and diabetes (glucose, insulin, and triglycerides) in db/db mice accompanied by increased expression of the FGF21 gene; however, the causal association among their improved phenotypes, stimulated energy metabolism, and gene expression was unclear because of their long-term mutual interactions. In the present study, we comprehensively examined the temporal changes in hepatic gene expression in db/db mice that had ingested H2. Although H2 did not strongly influence each gene’s expression, the KEGG pathway analysis of microarray data revealed with strong significance that genes involved in fatty acid and steroid metabolism were expressed through the PPARα signaling pathway.
For further analysis in shorter administration periods, we used MgH2, which produces H2 in the stomach. The ingestion of H2 for 3 days induced the gene expression of PGC-1α, accompanied by a decrease in plasma triglyceride, and followed by an increase in FGF21.
PGC-1α, FGF21, and PPARα are very important regulators of energy metabolism. PGC-1α is a member of a family of transcription coactivators that have a central role by activating various transcription factors in the regulation of cellular energy metabolism.18,19 When PGC-1α activates the transcription factor PPARα, fatty acid metabolism is enhanced.
The PPARs are members of a relatively large family of nuclear receptors and function as ligand-activated transcriptional factors, all of which are subject to transcriptional coactivation by PGC-1α. PPARα regulates the expression of genes involved in fatty acid β-oxidation.9,20
FGF21 is strongly induced in liver by prolonged fasting via PPAR-α.21 FGF21 stimulates the phosphorylation of fibroblast growth factor receptor substrate 2 and extracellular signal-regulated protein kinases 1 and 2 (ERK1/2) to induce the hepatic expression of key regulators of gluconeogenesis, lipid metabolism, and ketogenesis.22
At the early stage, carnitine palmitoyltransferase 1α (Cpt-1α) slightly but significantly increased. Cpt-1α is transcribed by transcription factors PPARα and TR-β, both of which are coactivated by PGC-1α.23 Thus, it is likely that the expression of Cpt-1α was enhanced by PGC-1α.
The interactions among these key factors are complicated: FGF21 is PGC-1α dependently transcribed by PPARα, while FGF21 induces PGC-1α.21,24,25 Although there are complicated interactions among the key factors, we found that H2 increases the gene expression of PGC-1α as the early event. Thus, PGC-1α activates PPARα, resulting in stimulation of the PPARα pathway. PPARα transcribes the FGF21 gene and genes involved in fatty acid metabolism and steroid metabolism. In turn, FGF21 stimulates the expression of fatty acid metabolism as a hormonal function, as illustrated in Figure 5g.
H2 reduces hydroxyl radicals, which is a trigger of the free-radical chain reaction, so it should prevent the free-radical chain reaction, resulting in decreases of peroxides and their end products including 4-HNE.1 In this study, we found H2 decreased 4-HNE when free radicals were induced (Figure 5a, b), which agreed with previous studies.1,11,12
PGC-1α is transcribed by transcription factors FoxO1 and cAMP-response element-binding protein, using each of their dependent promoters.17 FoxO1 is phosphorylated by activated Akt, causing nuclear exclusion, resulting in suppression of the expression of PGC-1α.17 Indeed, the phosphorylation of Akt and FoxO1 was recovered by 4-HNE, but not by H2, under a serum-free condition in HepG2 cells. Thus, although these conditions in HepG2 cells were far from the physiological conditions in db/db mice, we speculated the involvement of 4-HNE and the phosphorylation of Akt and FoxO1 in inducing PGC-1α, as illustrated in Figure 5g.
PGC-1α also functions as the organizer of mitochondrial biogenesis. Recently, it was reported that H2 enhances mitochondrial membrane potential in damaged sperm.26 Multiple functions of H2 may be elucidated at least partly through the multiple functions of PGC-1α.
Finally, we showed that prolonged drinking of H2-water improved the plasma triglyceride level and extended the average of lifespan in wild-type mice that were fed a fatty diet. It is possible that the lifespan-extending effect of H2-water can be not only based on the effect on the liver but also on skeletal muscle or other organs. Because FGF21 was previously reported to increases lifespan,27 increased energy metabolism in the liver could be one of the major contributors for the extension of the average of lifespan.
Materials and methods
Animals
This study was approved by the Animal Care and Use Committee of Nippon Medical School (Tokyo, Japan). The methods were carried out in ‘accordance’ with the relevant guidelines and regulations.
Genetically diabetic male db/db mice (BKS.Cg-+Leprdb/+Leprdb/Jcl) and their non-diabetic heterozygous db/+ littermates (BKS.Cg-m+/+Leprdb/Jcl) were purchased at 5 weeks of age from CLEA Japan (Tokyo, Japan). For the diet-induced obesity study, C57BL/6 mice were given a high-fat diet (D12451; RESEARCH DIETS, New Brunswick, NJ, USA). Normal-fat diet (D12450B; RESEARCH DIETS) was used for the control group. C57BL/6 mice of 12 weeks of age and male Sprague-Dawley rats of 10 weeks of age were purchased from Nippon SLC (Hamamatsu, Shizuoka, Japan).
Hydrogen treatment
Water with dissolved molecular hydrogen (H2-water) was used for 2 weeks of consumption. The H2-water was prepared as described previously.11 Mice were given water freely using closed glass vessels equipped with an outlet line containing two ball bearings, which kept the water from being degassed. The vessel was refilled with fresh H2-water every day. H2-water degassed by gentle stirring was used as control water.
MgH2, which reacts with H2O and produces H2, was used for short term consumption. MgH2 powder was suspended in glycerol that had been dehydrated with molecular sieves to prevent MgH2 from reacting with H2O. Mice received MgH2 suspension orally by stomach gavage at 9 or 90 mg/kg once a day. MgH2 reacted with H2O in the stomach to produce H2. Mg(OH)2 was used as a control. Hydrogen concentration in blood was measured as described previously.1
Microarray analysis
Total RNA was isolated separately from each mouse tissue using an RNeasy Mini kit (QIAGEN, Valencia, CA, USA) according to the manufacturer’s instructions and dissolved in RNase-free water at a final concentration of 2.0 μg/μl. Nine RNA samples were divided into three sets and made into mixtures (each set contained RNA from three mice). These three RNA sample sets of each experimental group were used for microarray analysis.
Total RNA was labeled using a Low-Input QuickAmp Labeling Kit, Two-Color (Agilent Technologies, Santa Clara, CA, USA). Cy3 dye was used to label cDNA from the control-water group and Cy5 dye was used to label cDNA from the H2-water group. Gene expression analysis was performed on three independent samples for each group using a microarray (SurePrint G3 Mouse GE 8×60 K v2 Microarray, Agilent Technologies, Santa Clara, CA, USA). To compare the results of the three sets of microarray experiments, the signal intensity of each gene from different arrays was normalized by the total intensity in each array. Signal evaluation was performed using Agilent Feature Extraction Software (Agilent Technologies). Statistical analysis was applied to select the differentially expressed genes. Only cases with signal evaluation score=2, and P value <0.05 were identified as differentially expressed genes. For the expression assay for db/+ and db/db mice, Cy3 and Cy5 dyes were used, respectively.
The raw microarray data were deposited in the Gene Expression Omnibus (accession number, GSE71738; http://www.ncbi.nlm.nih.gov/geo/query/acc.cgi?acc=GSE71738).
KEGG pathway analysis
A pathway enrichment analysis of differentially expressed genes was conducted using KEGG pathway information (http://www.genome.jp/kegg/pathway.html). Probe set IDs of each category were first mapped to NCBI Entrez gene IDs according to the Agilent Mouse Array annotation file, and then were mapped to KEGG gene IDs according to the KEGG gene cross-reference file. Pathways that were significantly enriched with differentially expressed genes were identified. Graphical pathway maps were downloaded from the KEGG site, and differentially expressed genes were then highlighted in yellow.
Quantitative real-time RT-PCR (q-PCR)
Complementary DNA was generated by SuperScript II Reverse Transcriptase (Thermo Fisher Scientific Inc., Waltham, MA, USA) from RNA samples that were used for microarray analysis. cDNA was analyzed by quantitative PCR using Thermal Cycler Dice Real Time System TP800 (TAKARA BIO INC., Otsu, Shiga, Japan). All samples were normalized to glyceraldehyde 3-phosphate dehydrogenase (GAPDH) expression. Primer and probe sequences for each PCR are shown in Supplementary Table S1.
Cell culture and treatment of cells
HepG2 human hepatoma cells were treated with 2,2′-azobis(2-amidinopropane) dihydrochloride for 6 h in the presence or absence of 10% H2. For 4-HNE treatment, cells were treated with 4-HNE for 1 h for analysis of phosphorylation or 6 h for analysis of gene expression in the presence or absence of 50% H2.
Immunofluorescence and western blotting
Immunofluorescence was examined as described previously1 using anti-4-HNE antibodies (3.3 μg/ml; MHN-100P; Japan Institute for the Control of Aging, Japan). The cells were counterstained with Hoechst 33342. Immunofluorescence was observed using a laser scanning confocal microscope (FV1200; Olympus, Tokyo, Japan).
For western blotting, the following primary antibodies were used in 5% BSA in TBST: anti-p-Akt (1:5,000, #4060: Cell Signaling Technology, Danvers, MA, USA), anti-total Akt (1:1000, #4691: Cell Signaling Technology), anti-p-FoxO1 (1:2500, #2599: Cell Signaling Technology), anti-total FoxO1 (1:1000, #2880: Cell Signaling Technology). Horseradish peroxidase-conjugated anti-rabbit IgG antibody (sc-2004: Santa Cruz Biotechnology, Dallas, TX, USA) was used as a secondary antibody.
Measurement of plasma triglyceride
Plasma concentrations of triglyceride were determined with commercially available kits (Wako Pure Chemical Industries, Osaka, Japan).
Statistical analysis
We performed statistical analysis by applying an unpaired two-tailed Student's t-test, as described previously.1 Differences were considered statistically significant at P<0.05.
References
Ohsawa, I. et al. Hydrogen acts as a therapeutic antioxidant by selectively reducing cytotoxic oxygen radicals. Nat. Med. 13, 688–694 (2007).
Ohta, S. Recent progress toward hydrogen medicine: potential of molecular hydrogen for preventive and therapeutic applications. Curr. Pharm. Des. 17, 2241–2252 (2011).
Ohta, S. Molecular hydrogen as a preventive and therapeutic medical gas: initiation, development and potential of hydrogen medicine. Pharmacol. Ther. 144, 1–11 (2014).
Yoritaka, A. et al. Pilot study of H(2) therapy in Parkinson's disease: a randomized double-blind placebo-controlled trial. Mov. Disord. 28, 836–839 (2013).
Ishibashi, T. et al. Therapeutic efficacy of infused molecular hydrogen in saline on rheumatoid arthritis: a randomized, double-blind, placebo-controlled pilot study. Int. Immunopharmacol. 21, 468–473 (2014).
Kamimura, N., Nishimaki, K., Ohsawa, I. & Ohta, S. Molecular hydrogen improves obesity and diabetes by inducing hepatic FGF21 and stimulating energy metabolism in db/db mice. Obesity (Silver Spring) 19, 1396–1403 (2011).
Kawai, D. et al. Hydrogen-rich water prevents progression of nonalcoholic steatohepatitis and accompanying hepatocarcinogenesis in mice. Hepatology 56, 912–921 (2012).
Song, G. et al. Hydrogen-rich water decreases serum LDL-cholesterol levels and improves HDL function in patients with potential metabolic syndrome. J. Lipid Res. 54, 1884–1893 (2013).
Rakhshandehroo, M., Knoch, B., Muller, M. & Kersten, S. Peroxisome proliferator-activated receptor alpha target genes. PPAR Res. 2010, 612089 (2010).
Mandard, S., Muller, M. & Kersten, S. Peroxisome proliferator-activated receptor alpha target genes. Cell Mol. Life Sci. 61, 393–416 (2004).
Nagata, K., Nakashima-Kamimura, N., Mikami, T., Ohsawa, I. & Ohta, S. Consumption of molecular hydrogen prevents the stress-induced impairments in hippocampus-dependent learning tasks during chronic physical restraint in mice. Neuropsychopharmacology 34, 501–508 (2009).
Fujita, K. et al. Hydrogen in drinking water reduces dopaminergic neuronal loss in the 1-methyl-4-phenyl-1,2,3,6-tetrahydropyridine mouse model of Parkinson's disease. PLoS ONE 4, e7247 (2009).
Csala, M. et al. On the role of 4-hydroxynonenal in health and disease. Biochim. Biophys. Acta 1852, 826–838 (2015).
Endo, J. et al. Metabolic remodeling induced by mitochondrial aldehyde stress stimulates tolerance to oxidative stress in the heart. Circ. Res. 105, 1118–1127 (2009).
Furukawa, S. et al. Increased oxidative stress in obesity and its impact on metabolic syndrome. J. Clin. Invest. 114, 1752–1761 (2004).
Monteiro, R. & Azevedo, I. Chronic inflammation in obesity and the metabolic syndrome. Mediators Inflamm. 2010, 289645 (2010).
Daitoku, H., Yamagata, K., Matsuzaki, H., Hatta, M. & Fukamizu, A. Regulation of PGC-1 promoter activity by protein kinase B and the forkhead transcription factor FKHR. Diabetes 52, 642–649 (2003).
Liang, H. & Ward, W. F. PGC-1alpha: a key regulator of energy metabolism. Adv. Physiol. Educ. 30, 145–151 (2006).
Puigserver, P. & Spiegelman, B. M. Peroxisome proliferator-activated receptor-gamma coactivator 1 alpha (PGC-1 alpha): transcriptional coactivator and metabolic regulator. Endocr. Rev. 24, 78–90 (2003).
van Raalte, D. H., Li, M., Pritchard, P. H. & Wasan, K. M. Peroxisome proliferator-activated receptor (PPAR)-alpha: a pharmacological target with a promising future. Pharm. Res. 21, 1531–1538 (2004).
Kliewer, S. A. & Mangelsdorf, D. J. Fibroblast growth factor 21: from pharmacology to physiology. Am. J. Clin. Nutr. 91, 254S–257S (2010).
Kharitonenkov, A. et al. FGF-21 as a novel metabolic regulator. J. Clin. Invest. 115, 1627–1635 (2005).
Zhang, Y. et al. Peroxisomal proliferator-activated receptor-gamma coactivator-1 alpha (PGC-1 alpha) enhances the thyroid hormone induction of carnitine palmitoyltransferase I (CPT-I alpha). J. Biol. Chem. 279, 53963–53971 (2004).
Fisher, F. M. et al. Integrated regulation of hepatic metabolism by fibroblast growth factor 21 (FGF21) in vivo. Endocrinology 152, 2996–3004 (2011).
Potthoff, M. J. et al. FGF21 induces PGC-1alpha and regulates carbohydrate and fatty acid metabolism during the adaptive starvation response. Proc. Natl Acad. Sci. USA 106, 10853–10858 (2009).
Nakata, K., Yamashita, N., Noda, Y. & Ohsawa, I. Stimulation of human damaged sperm motility with hydrogen molecule. Med. Gas Res. 5, 2 (2015).
Zhang, Y. et al. The starvation hormone, fibroblast growth factor-21, extends lifespan in mice. eLife 1, e00065 (2012).
Acknowledgements
We thank Ms Mayumi Takeda and Ms Suga Kato for technical assistance and secretarial work, respectively. This work was supported by a grant from the Ministry of Education, Culture, Sports, Science and Technology of Japan (23300257, 24651055 and 26282198 to SO, 23500971 and 26350129 to NK).
Author information
Authors and Affiliations
Contributions
NK and SO provided significant intellectual input to the key idea, concept and hypothesis. NK, HI and KI performed the experiments (NK for Figures 1, 2, 4 and 5c–e, and Supplementary Figures S1–S7, and HI for Figures 3 and 6, Supplementary Figure S8, and KI for Figures 5a,b). NK and SO determined the analytical methodology and conducted the data analysis. SO and NK wrote the manuscript. All authors approved the final version of this article, declared that it was created accurately, and provided written approval of recognition of accountability for all aspects of the work as an author.
Corresponding author
Ethics declarations
Competing interests
The authors declare no conflict of interest.
Supplementary information
Rights and permissions
This work is licensed under a Creative Commons Attribution 4.0 International License. The images or other third party material in this article are included in the article’s Creative Commons license, unless indicated otherwise in the credit line; if the material is not included under the Creative Commons license, users will need to obtain permission from the license holder to reproduce the material. To view a copy of this license, visit http://creativecommons.org/licenses/by/4.0/
About this article
Cite this article
Kamimura, N., Ichimiya, H., Iuchi, K. et al. Molecular hydrogen stimulates the gene expression of transcriptional coactivator PGC-1α to enhance fatty acid metabolism. npj Aging Mech Dis 2, 16008 (2016). https://doi.org/10.1038/npjamd.2016.8
Received:
Revised:
Accepted:
Published:
DOI: https://doi.org/10.1038/npjamd.2016.8
This article is cited by
-
Protective effects of dissolved molecular hydrogen against hydrogen peroxide-, hydroperoxide-, and glyoxal-induced injuries to human skin keratinocytes
Molecular and Cellular Biochemistry (2021)
-
Flaming the fight against cancer cells: the role of microRNA-93
Cancer Cell International (2020)


