
Abstract
A normal conductor placed in good contact with a superconductor can inherit its remarkable electronic properties1,2. This proximity effect microscopically originates from the formation in the conductor of entangled electron–hole states, called Andreev states3,4,5,6,7,8. Spectroscopic studies of Andreev states have been performed in just a handful of systems9,10,11,12,13. The unique geometry, electronic structure and high mobility of graphene14,15 make it a novel platform for studying Andreev physics in two dimensions. Here we use a full van der Waals heterostructure to perform tunnelling spectroscopy measurements of the proximity effect in superconductor–graphene–superconductor junctions. The measured energy spectra, which depend on the phase difference between the superconductors, reveal the presence of a continuum of Andreev bound states. Moreover, our device heterostructure geometry and materials enable us to measure the Andreev spectrum as a function of the graphene Fermi energy, showing a transition between different mesoscopic regimes. Furthermore, by experimentally introducing a novel concept, the supercurrent spectral density, we determine the supercurrent–phase relation in a tunnelling experiment, thus establishing the connection between Andreev physics at finite energy and the Josephson effect. This work opens up new avenues for probing exotic topological phases of matter in hybrid superconducting Dirac materials16,17,18.
Main
When a normal quantum conductor (N) is sandwiched between two superconductors (S), a current can flow in the absence of any voltage, due to the Josephson effect1. This macroscopic supercurrent is driven by the difference between the order parameter phases of the two superconductors, φ. Microscopically, it corresponds to the coherent flow of Cooper pairs through the conductor, which is made possible by successive Andreev reflections at the N/S interfaces, where electrons (holes) are reflected as opposite-spin holes (electrons) (Fig. 1a). Due to this process, resonant electron–hole states form in the central conductor, known as Andreev bound states (ABS)3,4,5,6. They lie as energy levels inside the superconducting gap [−Δ, Δ], only negative-energy states being populated in the ground state (Fig. 1b). Crucially, the Andreev energy En(φ) depends on φ, and each populated ABS carries in response a supercurrent (1/φ0)(∂En/∂φ), where φ0 = ℏ/2e is the reduced flux quantum, with ℏ the reduced Planck constant and e the elementary charge. The overall phase-dependent Andreev spectrum is shown in Fig. 1c and depends on geometric and microscopic parameters7,8, such as the conductor dimensions that determine the number of ABS, the scattering processes in the conductor and the contact’s transparency. Strong ABS phase dependence, and therefore a prominent proximity effect, is achieved in ballistic systems with transparent N/S interfaces7,8.

a, Microscopic picture of the Josephson effect. Supercurrent—coherent flow of Cooper pairs—through a quantum conductor results from successive Andreev reflections at the normal/superconductor interfaces. e, electron; h, hole. b, The DOS in the proximitized conductor is dramatically changed with the appearance of resonant ABS within the induced superconducting gap [−Δ, Δ]. c, ABS energies as a function of phase, for different configurations of the central conductor. In the case of a short single-channel (solid line), there is a single pair of ABS, whereas a long junction contains a large number of ABS (dashed lines). Finite transmission τS < 1 in the conductor leads to a repulsion of the ABS away from zero energy at φ = π, and a reduced contact transparency τC < 1 detaches the ABS from the gap edges at φ = 0. d, Schematics of the tunnelling spectroscopy process. The normal probe is a graphite electrode and the tunnelling barrier a monolayer hBN crystal. e, Device schematics. An encapsulated graphene flake is connected to two superconducting electrodes. Magnetic flux φ threading the loop imposes a phase φ = φ/φ0 across graphene and modulates the Andreev states energy.
Graphene (G) can exhibit low contact resistance and weak scattering when connected to superconducting electrodes19,20. These properties, combined with the ability to control the number of conduction channels with a gate voltage, make graphene an ideal test-bed for exploring Andreev physics in two dimensions (2D). Although the superconducting proximity effect in graphene has attracted considerable research interest19,20,21,22,23,24,25,26,27,28,29, most of the experimental studies have been limited to transport measurements of dissipationless supercurrent in graphene-based (S–G–S) Josephson junctions. Accessing the energy domain while controlling the superconducting phase difference is crucial for probing ABS, and it has been performed in just a few systems, such as silver wires9, carbon nanotubes10, semiconductor nanowires11, and atomic break-junctions12,13. However, a direct spectroscopic observation of phase-dependent ABS in graphene is missing. The way ABS form in graphene still remains an open question, especially around the neutrality point, where its unique electronic spectrum should give rise to specular Andreev reflections27,30 and potentially to exotic ABS. Interest in such a spectroscopy has increased with recent proposals for hosting Majorana modes16,17,18 within proximitized graphene operated in the quantum Hall regime29.
To probe Andreev physics in the energy domain, we perform tunnelling spectroscopy of graphene proximitized by superconductors (Fig. 1d). The experiment is performed using a full van der Waals heterostructure shown schematically in Fig. 1e. A monolayer graphene sheet is encapsulated between hexagonal boron nitride (hBN) crystals. The bottom one is 15 nm thick and isolates graphene from a graphite local backgate, which enables us to control electrostatically the Fermi energy of graphene with the voltage Vg. The top hBN crystal is just one atom thick and is used as a tunnelling barrier. Immediately on top sits a 150-nm-wide metallic probe made of thin graphite. The use of a graphite probe is crucial, as it limits the doping in the graphene (directly underneath the monolayer hBN barrier) owing to the small work function difference between graphite and graphene. This makes the low-density regime around the charge neutrality point (CNP) accessible to our investigations. The graphene sheet, with width W = 2 μm, is well connected to two superconducting aluminium electrodes, with an inter-lead distance L = 380 nm. These electrodes are patterned in a loop that enables us to control the phase difference φ = Φ/φ0 across the graphene by applying a magnetic flux Φ through the loop.
By measuring the differential conductance dI/dV of this tunnelling device at low temperature (20 mK), one can infer the local density of states (DOS) of graphene at energy eV, V being the bias voltage between the graphite probe and the superconducting electrodes (Fig. 1d, e). Such a measurement is shown in Fig. 2a for different values of the magnetic field and a constant gate voltage Vg = 1 V. Each trace exhibits a dip centred at zero bias and two side peaks at V = ±160 μV. We emphasize that the tunnelling process takes place between thin graphite (that is, non-superconductor) and the graphene flake, which is only laterally contacted by the superconductors. The graphene DOS, usually featureless within this very narrow energy range in the normal state, has dramatically changed due to the superconducting proximity effect and displays a soft induced gap Δ ∼ 160 μeV, only slightly reduced compared to that of aluminium ΔAl ∼ 180 μeV. When varying the magnetic field B (Fig. 2b), the DOS oscillates with a periodicity δB = 360 μT, which corresponds to one flux quantum 2πφ0 threading the loop of enclosed area A = 5.7 μm2 (taking into account the Meissner effect). The corresponding phase φ = A(B − B0)/φ0 is shown on the top axis, where B0 = 250 μT is an offset magnetic field in this experiment. The gap and side peaks are most pronounced at φ = 0 and get reduced when the phase is swept towards φ = π (see Fig. 2b, top axis).

a, Differential conductance, dI/dV as a function of bias voltage, V, for different magnetic fields, B, and at a gate voltage Vg = 1 V. b, Colour-coded dI/dV as a function of V and B at Vg = 1 V (the top axis shows B converted into the superconducting phase difference φ). The oscillating spectrum is evidence for a continuum of ABS.
This flux-dependent DOS is consistent with a continuum of ABS modulating with phase. The graphene weak link being spatially extended indeed consists of a large number of conduction channels M ∼ 2W/λF, each containing ∼2Lm/πξ pairs of ABS8. Here, 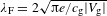 is the Fermi wavelength of electrons in graphene (with cg ≈ 2.3 fF μm−2 the gate capacitance per unit area) and M can be tuned with the backgate Vg typically between 40 and 300, ξ is the superconducting coherence length and Lm the effective length of channel m. To estimate the superconducting coherence length ξ, we measured in the normal regime the gate-dependent differential resistance of a similarly fabricated graphene junction (see Supplementary Fig. 3). From the extracted mean free path le ∼ 140 nm < L, one can infer a lower-bound ξ ∼ 590 nm using the diffusive relation
  , with D = vFle/2 the Einstein diffusion coefficient in 2D and vF the Fermi velocity. Since the S–G–S junction is in the intermediate regime L ∼ ξ, the spectrum is complex and made out of different type of ABS. Most channels are in the short-junction regime (Lm < πξ/2) and contain a single pair of ABS (solid lines in Fig. 1c). In the case of good coupling to the superconducting leads, the ABS strongly depend on phase and are responsible for the flux modulation of the DOS. The latter indeed peaks strongly at the gap when φ = 0, due to the accumulation of ABS at energies En ∼ ±Δ. At φ = π, the ABS reach their minimum energy and populate the gap, resulting in an enhanced DOS at low energy. At the same time, channels with low contact transparency provide ABS that detach from the gap edges at φ = 0 and have weaker phase modulation, thus explaining the observed soft superconducting gap. On top of that, channels with large transverse momentum are effectively longer and contain more ABS that fill the superconducting gap and which exhibit weaker phase modulation (dashed lines in Fig. 1c), contributing therefore to the finite DOS in the soft-gap region. Such soft-gap physics is expected for short and wide quasi-ballistic junctions31. Note, however, that the measured spectra are very different from the ones observed with diffusive metallic junctions with clean interfaces9, which display a strong ‘minigap’ that modulates with the phase.
To characterize further how Andreev physics manifests in graphene, we now vary the carrier density of the weak link n = cg |Vg| /e. In the normal state, the differential conductance as a function of Vg is V-shaped with a minimum at VCNP ∼ 0.05 V, which reflects the linear DOS of the Dirac cone (see Supplementary Fig. 4). Figure 3 shows the DOS in the superconducting state, as a function of both energy and phase, for various values of Vg (see also Supplementary Fig. 6 for a more exhaustive gallery). The energy spectra depend strongly on the graphene carrier density, which is tuned from hole-type (panels a–c) through the CNP (panels d–f) to electron-type (panels g–i). Noticeably, the larger the carrier density, the stronger the DOS is modulated with phase, resulting in a larger supercurrent which is in agreement with transport measurements of G-based Josephson junctions19,20,21,22,23. In contrast, at low density |n| < 1 × 1011 cm−2, close to the CNP (Fig. 3e), the phase modulation of the DOS is very weak. In this gate voltage range, which corresponds to |EF| < 37 meV in Fermi energy, the normal state DOS also shows negligible Vg dependence. We attribute these effects to disorder, which causes the formation of electron–hole puddles in graphene when its energy scale is larger than the Fermi energy32,33. In such a heterogeneous and disordered configuration25, the mean free path is reduced and the graphene enters a long-junction regime. Moreover, the coupling of a given puddle to the superconducting leads tends to be reduced and asymmetric. This results in an overall weak phase modulation of the DOS. Note that such spatial fluctuations of Fermi energy due to disorder may also prevent us from observing exotic ABS arising from specular Andreev reflexions27,30. On the contrary, at large carrier density the phase modulation of the DOS is much stronger. This is consistent with a disorder potential smaller than the Fermi energy, which results in more ABS from well-coupled and transmitted conduction channels in the short-junction limit. At very large carrier density |n| > 3 × 1012 cm−2, one can even measure a complete closing of the induced gap and a flat DOS at φ = π (Fig. 3a, h, i, and Supplementary Fig. 8), as more ballistic ABS reach zero energy at φ = π (solid lines in Fig. 1c).

a–i, Normalized differential conductance as a function of both energy E = eV and superconducting phase difference φ, for different gate voltages, Vg (indicated in each panel). In each panel, the colour-coded differential conductance is linearly scaled to maximize the contrast. The solid black traces in each lower right corner correspond to cross-sections of the data at phases φ/π = 0, 0.2, 0.4, 0.6, 0.8, 1. The x-axis E = eV ranges from −350 μeV to 350 μeV; the y-axis dI/dV ranges from 0.25GN to 1.35GN with GN (Vg) the normal differential conductance (the axis are here not visible; see Supplementary Figs 4 and 5 for quantitative values).
The effect of the normal scattering properties also appears as an asymmetry between the energy spectra for opposite carrier density (see Fig. 3 and Supplementary Fig. 9). When the graphene is hole-doped, the phase modulation of the DOS is indeed smaller with a V-shaped induced gap, whereas it is U-shaped with a stronger phase modulation for the electron-doped case. This is because aluminium n-dopes graphene underneath the contact due to their work function difference, which results in an n–p–n potential profile when Vg < VCNP. These p–n junctions reduce the contacts’ transparency, which repel the ABS from the gap edges toward lower energy (solid lines in Fig. 1c) and weaken the phase modulation of the DOS, in good agreement with measurements of Al–G–Al Josephson junctions that show smaller supercurrent in the hole-doped region21.
Probing Andreev physics in the energy domain while controlling the phase difference additionally allows one to access the supercurrent spectral density JS(E, φ), which quantifies the amount of supercurrent carried by Andreev states at energy E and phase φ. This quantity makes evident the link between Andreev physics and the Josephson effect. It has seldom been discussed in the literature8,34,35,36,37 and, to the best of our knowledge, has never been directly connected to the DOS. We propose here the heuristic definition JS(E, φ) = −(1/φ0)∫0E(∂DOS/∂φ)(ε, φ)dε, which can easily be checked as being correct in the case of a set of discrete ABS. Using this definition and the factor c = 34.7 meV −1 μS−1 to convert tunnelling conductance to DOS (see Supplementary Section 6), one can numerically compute JS for each energy spectrum. Figure 4 shows both the Andreev spectrum in graphene and its corresponding supercurrent spectral density for a gate voltage Vg = 2.4 V. The data confirm that opposite energy ABS carry opposite supercurrent, as expected from time-reversal symmetry. Going further, one can derive the supercurrent in the ground state, defined as IS(φ) = (1/2)∫−∞∞sgn(− E)JS(E, φ)dE (Fig. 4c), and thus access the Josephson current–phase relation. In this measurement, which was taken over a large range in magnetic field, both DOS, JS and IS oscillate with phase, the oscillations being progressively washed out at large field. At large fields, a significant flux is threading graphene due to its extended 2D-nature, which results in a space-dependent phase difference and a dephasing of ABS along the junction. Close to zero flux, the current–phase relation is strongly anharmonic (see Supplementary Fig. 11) and can be fitted by the supercurrent carried by perfectly coupled short ABS with an average transmission coefficient τ = 0.725 (solid red curve)6. This confirms that ABS from well-coupled and well-transmitted short channels are dominating the supercurrent at large carrier density.

a,b, Colour-coded DOS (a) and supercurrent spectral density JS (b) as a function of both energy E = eV and superconducting phase difference φ, at a gate voltage Vg = 2.4 V. c, Corresponding ground state supercurrent (black dotted line) as a function of φ. A clear anharmonic supercurrent–phase relation can be seen near zero φ. The solid red line corresponds to the supercurrent carried by perfectly coupled short ABS with an average transmission coefficient τ = 0.725.
Our tunnelling spectroscopy study provides fundamental insights into how the Josephson effect develops in graphene, and it can be extended to other 2D materials. The combined effects of disorder, geometry, and Fermi energy offer many opportunities to investigate Andreev physics in different mesoscopic superconductivity regimes. Moreover, as graphene’s extended 2D nature enables one to combine superconductivity and the quantum Hall effect29, this platform is promising for the detection of Majorana modes18, key ingredients for topologically protected quantum computation.
Methods
The van der Waals heterostructure is created via successive pick-ups and transfers using a polymer-based dry transfer technique38,39 (see Supplementary Information for a detailed description of the fabrication procedure). The superconducting electrodes are fabricated by electron-beam lithography and evaporation of 70 nm of aluminium, with 7 nm of titanium as a sticking layer. The sample is anchored to the mixing chamber of a dilution refrigerator at 20 mK, well below the transition temperature of aluminium (TC ∼ 1.1 K). The biasing and measurement lines are heavily filtered using both discrete and distributed cryogenic low-pass filters40. The measurements are made at low frequency (10–100 Hz) using room-temperature amplification and standard lock-in techniques with an excitation voltage of 5–10 μV.
Data availability.
The data that support the plots within this paper and other findings of this study are available from the corresponding author upon reasonable request.
Additional Information
Publisher’s note: Springer Nature remains neutral with regard to jurisdictional claims in published maps and institutional affiliations.
References
Josephson, B. D. Possible new effects in superconductive tunnelling. Phys. Lett. 1, 251–253 (1962).
De Gennes, P. G. Boundary effects in superconductors. Rev. Mod. Phys. 36, 225–237 (1964).
Kulik, I. O. Macroscopic quantization and the proximity effect in S–N–S junctions. Sov. Phys. JETP 30, 944–950 (1970).
Furusaki, A. & Tsukada, M. Dc Josephson effect and Andreev reflection. Solid State Commun. 78, 299–302 (1991).
Beenakker, C. W. J. & van Houten, H. Josephson current through a superconducting quantum point contact shorter than the coherence length. Phys. Rev. Lett. 66, 3056–3059 (1991).
Bagwell, P. F. Suppression of the Josephson current through a narrow, mesoscopic, semiconductor channel by a single impurity. Phys. Rev. B 46, 12573–12586 (1992).
Wendin, G. & Shumeiko, V. S. Josephson transport in complex mesoscopic structures. Superlattices Microstruct. 20, 569–573 (1996).
Samuelsson, P., Lantz, J., Shumeiko, V. S. & Wendin, G. Nonequilibrium Josephson current in ballistic multiterminal SNS junctions. Phys. Rev. B 62, 1319–1337 (2000).
Le Sueur, H., Joyez, P., Pothier, H., Urbina, C. & Esteve, D. Phase controlled superconducting proximity effect probed by tunneling spectroscopy. Phys. Rev. Lett. 100, 197002 (2008).
Pillet, J.-D. et al. Revealing the electronic structure of a carbon nanotube carrying a supercurrent. Nat. Phys. 6, 965–969 (2010).
Chang, W., Manucharyan, V. E., Jespersen, T. S., Nygård, J. & Marcus, C. M. Tunneling spectroscopy of quasiparticle bound states in a spinful Josephson junction. Phys. Rev. Lett. 110, 217005 (2013).
Bretheau, L., Girit, Ç. Ö., Pothier, H., Esteve, D. & Urbina, C. Exciting Andreev pairs in a superconducting atomic contact. Nature 499, 312–315 (2013).
Bretheau, L., Girit, Ç. Ö., Urbina, C., Esteve, D. & Pothier, H. Supercurrent spectroscopy of Andreev states. Phys. Rev. X 3, 041034 (2013).
Castro Neto, A. H., Guinea, F., Peres, N. M. R., Novoselov, K. S. & Geim, A. K. The electronic properties of graphene. Rev. Mod. Phys. 81, 109–162 (2009).
Das Sarma, S., Adam, S., Hwang, E. H. & Rossi, E. Electronic transport in two-dimensional graphene. Rev. Mod. Phys. 83, 407–470 (2011).
Lindner, N. H., Berg, E., Refael, G. & Stern, A. Fractionalizing majorana fermions: Non-abelian statistics on the edges of abelian quantum Hall states. Phys. Rev. X 2, 041002 (2012).
Clarke, D. J., Alicea, J. & Shtengel, K. Exotic non-abelian anyons from conventional fractional quantum Hall states. Nat. Commun. 4, 1348 (2013).
San-Jose, P., Aguado, R., Guinea, F., Fernandez-Rossier, J. & Lado, J. Majorana zero modes in graphene. Phys. Rev. X 5, 041042 (2015).
Calado, V. E. et al. Ballistic Josephson junctions in edge-contacted graphene. Nat. Nanotech. 10, 761–764 (2015).
Ben Shalom, M. et al. Quantum oscillations of the critical current and high-field superconducting proximity in ballistic graphene. Nat. Phys. 12, 318–322 (2015).
Heersche, H. B., Jarillo-Herrero, P., Oostinga, J. B., Vandersypen, L. M. K. & Morpurgo, A. F. Bipolar supercurrent in graphene. Nature 446, 56–59 (2007).
Du, X., Skachko, I. & Andrei, E. Y. Josephson current and multiple Andreev reflections in graphene SNS junctions. Phys. Rev. B 77, 184507 (2008).
Girit, Ç. et al. Tunable graphene dc superconducting quantum interference device. Nano Lett. 9, 198–199 (2009).
Dirks, T. et al. Transport through Andreev bound states in a graphene quantum dot. Nat. Phys. 7, 386–390 (2011).
Komatsu, K., Li, C., Autier-Laurent, S., Bouchiat, H. & Guéron, S. Superconducting proximity effect in long superconductor/graphene/superconductor junctions: from specular Andreev reflection at zero field to the quantum Hall regime. Phys. Rev. B 86, 115412 (2012).
Allen, M. T. et al. Spatially resolved edge currents and guided-wave electronic states in graphene. Nat. Phys. 12, 128–133 (2015).
Efetov, D. K. et al. Specular interband Andreev reflections at van der Waals interfaces between graphene and NbSe2 . Nat. Phys. 12, 328–332 (2015).
Natterer, F. D. et al. Scanning tunneling spectroscopy of proximity superconductivity in epitaxial multilayer graphene. Phys. Rev. B 93, 045406 (2016).
Amet, F. et al. Supercurrent in the quantum Hall regime. Science 352, 966–969 (2016).
Beenakker, C. W. J. Specular Andreev reflection in graphene. Phys. Rev. Lett. 97, 067007 (2006).
Lodder, A. & Nazarov, Y. V. Density of states and the energy gap in Andreev billiards. Phys. Rev. B 58, 5783–5788 (1998).
Martin, J. et al. Observation of electron–hole puddles in graphene using a scanning single-electron transistor. Nat. Phys. 4, 144–148 (2008).
Xue, J. M. et al. Scanning tunnelling microscopy and spectroscopy of ultra-flat graphene on hexagonal boron nitride. Nat. Mater. 10, 282–285 (2011).
van Wees, B. J., Lenssen, K. M. H. & Harmans, C. J. P. M. Transmission formalism for supercurrent flow in multiprobe superconductor-semiconductor-superconductor devices. Phys. Rev. B 44, 470–473 (1991).
Wilhelm, F. K., Schön, G. & Zaikin, A. D. Mesoscopic superconducting-normal metal-superconducting transistor. Phys. Rev. Lett. 81, 1682–1685 (1998).
Baselmans, J. J. A., Morpurgo, A. F., van Wees, B. J. & Klapwijk, T. M. Reversing the direction of the supercurrent in a controllable Josephson junction. Nature 397, 43–45 (1999).
Baselmans, J. J. A., Heikkilä, T. T., van Wees, B. J. & Klapwijk, T. M. Direct observation of the transition from the conventional superconducting state to the pi state in a controllable Josephson junction. Phys. Rev. Lett. 89, 207002 (2002).
Wang, L. et al. One-dimensional electrical contact to a two-dimensional material. Science 342, 614–617 (2013).
Wang, J. I. et al. Electronic transport of encapsulated graphene and WSe2 devices fabricated by pick-up of prepatterned hBN. Nano Lett. 15, 1898–1903 (2015).
Spietz, L., Teufel, J. & Schoelkopf, R. J. A twisted pair cryogenic filter. Preprint at http://arXiv.org/abs/cond-mat/0601316 1–12 (2006).
Acknowledgements
We acknowledge helpful discussions with W. Belzig, J. C. Cuevas, V. Fatemi, Ç. Girit, P. Joyez, A. L. Yeyati, J.-D. Pillet, H. Pothier, V. Shumeiko and C. Urbina. This work has been primarily supported by the US DOE, BES Office, Division of Materials Sciences and Engineering under Award DE-SC0001819 and by the Gordon and Betty Moore Foundation’s EPiQS Initiative through Grant GBMF4541 to P.J.-H. J.I.-J.W. was partially supported by a Taiwan Merit Scholarship TMS-094-1-A-001. This work made use of the MRSEC Shared Experimental Facilities supported by NSF under award No. DMR-0819762 and of Harvard’s CNS, supported by NSF under Grant ECS-0335765.
Author information
Authors and Affiliations
Contributions
J.I.-J.W., L.B. and P.J.-H. designed the experiment. J.I.-J.W. and R.P. fabricated the devices. L.B. and J.I.-J.W. carried out the measurements. L.B. analysed and interpreted the data. K.W. and T.T. supplied hBN crystals. L.B. and J.I.-J.W. wrote the manuscript with input from all the authors.
Corresponding authors
Ethics declarations
Competing interests
The authors declare no competing financial interests.
Supplementary information
Supplementary information
Supplementary information (PDF 7793 kb)
Rights and permissions
About this article

Cite this article
Bretheau, L., Wang, JJ., Pisoni, R. et al. Tunnelling spectroscopy of Andreev states in graphene. Nature Phys 13, 756–760 (2017). https://doi.org/10.1038/nphys4110
Received:
Accepted:
Published:
Issue Date:
DOI: https://doi.org/10.1038/nphys4110
This article is cited by
-
Phase-engineering the Andreev band structure of a three-terminal Josephson junction
Nature Communications (2023)
-
Proximity-induced superconductivity in epitaxial topological insulator/graphene/gallium heterostructures
Nature Materials (2023)
-
Microwave-induced conductance replicas in hybrid Josephson junctions without Floquet—Andreev states
Nature Communications (2023)
-
Proximity-induced superconductivity in (Bi1−xSbx)2Te3 topological-insulator nanowires
Communications Materials (2022)
-
Effect of dilute impurities on short graphene Josephson junctions
Communications Physics (2022)
