
Abstract
The cheapest and thus widespread way to add new generators to a high-voltage power grid is by a simple tree-like connection scheme. However, it is not entirely clear how such locally cost-minimizing connection schemes affect overall system performance, in particular the stability against blackouts. Here we investigate how local patterns in the network topology influence a power grid’s ability to withstand blackout-prone large perturbations. Employing basin stability, a nonlinear concept, we find in numerical simulations of artificially generated power grids that tree-like connection schemes—so-called dead ends and dead trees—strongly diminish stability. A case study of the Northern European power system confirms this result and demonstrates that the inverse is also true: repairing dead ends by addition of a few transmission lines substantially enhances stability. This may indicate a topological design principle for future power grids: avoid dead ends.
Introduction
Decarbonization1,2 strategies such as Germany’s Energiewende, a roadmap that aims3 at producing at least 80% of electricity from renewable sources by 2050, require vast numbers of new generation facilities to go online. The cheapest way to connect a new facility would be by a single transmission line linking it directly to the nearest node in the existing power grid. Such a connection scheme is called a dead end. If several new generators are to be connected, a tree-like structure branching towards the units would minimize construction costs. Such a connection scheme contains several dead ends and is called a dead tree. Although today’s power grids are predominantly organized in a meshed way, they include numerous dead ends and dead trees. These structures are usually implemented carrying two parallel high-voltage circuits to achieve electrical, so-called (n−1) redundancy. However, their inherent lack of topological redundancy—that is, of alternative routes on the network—may substantially weaken a grid’s stability against blackout-prone large perturbations, as we will show below.
Power outages can arise for various reasons, including line overload or voltage collapse4. Here we will focus on a third possible cause: the loss of synchrony. In normal operation, a power grid runs in the synchronous state in which all frequencies equal the rated frequency (50 or 60 Hz) and in which steady power flows equate supply and demand at all nodes5,6,7. When parts of a power grid desynchronize, destructive power oscillations emerge. To avoid damage, affected components must then be switched off. However, such switchings can in turn desynchronize other grid components, possibly provoking a cascade of further shut-downs and ending in a large-scale blackout8,9,10.
Grids are designed so that the synchronous state is locally stable, implying that a cascade-triggering desynchronization cannot be caused by a small perturbation—such as a consumer turning on their coffee machine11. Yet many intriguing questions on the relation between grid topology and local stability are still unanswered, and this is a highly active field of research. Recently, Rohden et at.12 found that the decentralization of power supply can improve the local stability of the synchronous state. Witthaut and Timme13 reported that, counterintuitively, addition of transmission lines can harm stability. Lozano et al.14 inferred from network partitions the minimum transfer capacity a grid requires to have a locally stable synchronous state. Dörfler et al.15 formulated rigorous conditions for such a state in terms of the wiring topology. In addition, finally, Motter et al.16 discovered a new way to improve local stability by tuning parameters of individual nodes in the grid.
However, even if the synchronous state is stable against small perturbations, a power grid’s state space is also populated by numerous stable non-synchronous states to which the grid might be pushed by short circuits, fluctuations in renewable generation or other large perturbations5,12,17,18. Indeed, large perturbations occur so often that a whole subbranch of power grid engineering, called transient stability analysis, has been dedicated to them. The standard transient stability toolbox, based on time domain simulations and Lyapunov function considerations18,19, assesses whether or not a power grid will return to synchrony after a given large perturbation. Along these lines, Filetrella et al.17. studied how the response of small test grids to large perturbations changes when the lines’ transfer capacity is increased. Rohden et al.12 analysed how decentralization can weaken a grid’s stability against large perturbations.
These studies have explored the relation between network properties and grid stability against rather specific kinds of large perturbation. In contrast, we focus here on the fundamental system characteristic that determines a grid’s response to generic large perturbations: the basin of attraction of the synchronous state. To that end, we perform numerical simulations on a model of the extrahigh-voltage transmission part of power grids and use a component-wise version of basin stability20, a nonlinear concept focussing on the basin’s volume. This allows us to study how a grid’s degree of stability against large single-node perturbations is influenced by patterns in the network topology. Our main finding is that the cheapest of all connection schemes, namely dead ends and dead trees, severely harm grid stability. This result is underscored by the observation in a case study of the Northern European power grid that ‘healing’ of dead ends by means of a few extra transmission lines significantly increases stability. We conclude that, from a purely topological point of view, dead ends should be avoided in future power grids.
Results
One-node model
Large perturbations hitting a power grid typically involve a local power imbalance. Imagine, for example, a generator delivering a constant amount of power via a single extrahigh-voltage transmission line that suddenly suffers a short circuit. Control devices immediately interrupt the line to clear the fault. Consequently, the mechanical power injected via the generator’s turbine has no electrical way out anymore. Energy conservation forces this power surplus into the turbine’s rotational energy, thus driving up its frequency. Hence, when the transmission line is automatically re-closed after some delay, the generator has moved away from its pre-fault working point. The crucial question is: from this perturbed state, will it return to the desired synchronous state?
We use the classical power grid model5,6,12,13,17 to illuminate the outlined situation. Its most basic version describes a single-generator’s dynamics as (see Methods)


where θ and ω denote phase and angular frequency of the generator’s voltage vector in a reference frame co-rotating at the grid’s rated frequency. Therefore, ω=0 means synchrony. Importantly, the law of induction binds ω to the angular frequency of the turbine. Therefore, ω here represents both electrical and mechanical rotation. The term −αω denotes damping, P is net power input—that is, local generation minus local consumption—and Ptrans=K sin(θ−θgrid) quantifies the power flow to the grid across the transmission line. For functional reasons, the transfer capacity K>0 of the transmission line must exceed |P|. Yet for economic reasons, it is usually not much larger than |P|. This one-node version of the model treats the grid as unaffected by the generator. Hence, θgrid≡0.
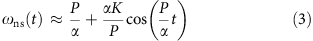
Let us now revisit the situation outlined above. Initially, the generator is in the synchronous state (θs, ωs=0), with θs=arcsin(P/K)∈[−π/2, π/2], in which Ptrans exactly balances net power input P. Then suddenly, at time t0, K is switched to 0. This makes ω increase until the line re-connects at time t1 (see trajectory 1 in Fig. 1a). Will the generator converge to (θs, 0) from the perturbed state ? If t1 is small, then constitutes a small perturbation with respect to (θs, 0) and the standard linearization-based stability analysis applies. It maintains that the generator will return to (θs, 0) if K>|P|, as then (θs, 0) is locally stable. However, the clearing time t1 is typically not small5, rendering the linear analysis incomplete20. Indeed, the generator will only return to the synchronous state if is inside that state’s basin of attraction  (the green area in Fig. 1a). Otherwise, it will converge to a different solution of (1)−(2): a non-synchronous limit cycle characterized by

(a–c) State space of the model (1)−(2), with α=0.1, P=1 and (a) K=8, (b) K=24, (c) K=65 (see Methods). The solid black circle marks the desired synchronous state (θs,0), and the solid red line shows the undesired non-synchronous limit cycle attractor. The basin of attraction of (θs, 0) is coloured green, and that of the limit cycle is coloured white. In (a), the grey dashed line indicates the fault-on (K=0) trajectory 1 and its end point . The dash-dotted line indicates the fault-on (K=8, P=−6) trajectory 2. (d) Basin stability S of the synchronous state versus the transmission capacity K.
(provided |P|/α2≫1, |P|2/α2≫K, see Supplementary Note 1).
Other, possibly serial, faults may push the generator from the synchronous state to perturbed states anywhere in state space. If, for instance, the turning on of a major load or a large fluctuation in renewable generation temporarily drove P below zero, the generator’s state would deviate into the lower half of state space (see illustrative trajectory 2 in Fig. 1a). Clearly, the synchronous basin should be as large as possible. We therefore quantify how stable the synchronous state is against general large perturbations in terms of basin stability S, a measure of the basin’s volume20.
Specifically, we define basin stability as

Here
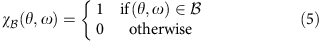
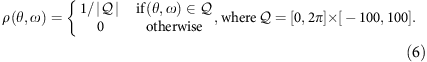
is the indicator function of the synchronous state’s basin and ρ is a density with ∫ρ(θ, ω) dθdω=1 that reflects to which states in state space the system may be pushed by large perturbations. The number S∈[0,1] expresses the likelihood that the system returns to the synchronous state after having been hit by a large perturbation occuring randomly according to the probability density ρ. S=0 when synchrony is unstable, and S=1 when it is globally stable. We estimate basin stability by means of a numerical Monte-Carlo procedure20,21,22: draw T random initial states according to ρ, simulate the associated trajectories, and count the number U of times the system converges to the synchronous state. Then S≈U/T. We use T=500 throughout this paper, which yields20 a standard error of  .
.
Intuition suggests that the synchronous state should become more stable when the transmission line’s transfer capacity K increases. This is indeed what we find: the expanding green area in Fig. 1a–c and the characteristic in Fig. 1d show that basin stability S, starting from S=0 for K<|P|, improves substantially as K goes up, until finally synchrony becomes the only stable state (S=1). Here we have chosen a uniform distribution restricted to a large box in state space, namely
This choice allows to clearly distinguish the three important cases in which covers (i) significantly less than half of state space (Fig. 1a); (ii) about half of state space (Fig. 1b); and (iii) all of state space (Fig. 1c). We keep using this choice of ρ in the following.
Multinode model
The one-node model of equations (1 and 2) is of course a strong simplification: there will be some interplay between multiple nodes after one of them has been hit by a large perturbation, and whether or not the grid will return to synchrony depends on the affected node’s properties, particularly its position within the grid topology. Hence, we now turn to an N-node version of the model that captures in a coarse-grained way12,13,17 the decisive electromechanical interactions taking place in the transmission grid after a large perturbation (see Methods). It reads

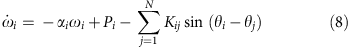
where θi and ωi denote phase and frequency of the generator at node i, and αi and Pi are its damping constant and net power input. We refer to nodes with Pi>0 as net generators and to nodes with Pi<0 as net consumers. The matrix {Kij} reflects the wiring topology, with Kij=Kji>0 if nodes i and j are connected, and Kij=0 otherwise.
Power grids do possess stable non-synchronous states5,12,13,17,18. We assume that there is also a stable synchronous state with constant phases  and frequencies ωi=0, and with basin of attraction . How stable is this state against large local perturbations that affect a single node? And how does this depend on the network topology? Before turning to a case study of the Northern European power grid, we address these questions statistically by studying an ensemble of 1,000 randomly generated power grids with N=100 nodes and E=135 transmission lines. These numbers yield the average degree 〈d〉=2.7, a value typical of power transmission grids23. To focus on the topology, we simplify generator and transmission details, assuming αi≡α, and Kij=Kji=K for connected nodes. Furthermore, we select a load scenario with only two types of nodes, randomly choosing N/2 net generators and net consumers with Pi=+P and Pi=−P, respectively. Then, for each ensemble grid, we measure for each node i its single-node basin stability

where S(·) as defined in equation (4) and

is the two-dimensional slice of the synchronous state’s 2N-dimensional basin that determines the grid’s response to single-node perturbations hitting node i. The number Si∈[0,1] expresses the probability that the grid will return to its synchronous state after node i has been hit by a single-node perturbation. To estimate Si, we randomly draw T initial values (θ, ω) according to ρ as defined in equation (6). For each of them we then initiate the multinode grid at

integrate equations (7 and 8), and finally count the number Ui of times in which the grid converges to its synchronous state. Then Si≈Ui/T.
As the ensemble contains 1,000 grids with N=100 nodes each, we thus obtain 100,000 individual measurements of single-node basin stability Si. Figure 2a shows the histogram of all these Si. Evidently, most nodes show a fair value of basin stability. Now, what is special about the nodes with poor stability (Si<0.30) or high stability (Si>0.95)? In the one-node model of equations (1 and 2), we observed that the synchronous state’s stability improves substantially when K increases (Fig. 1d). Hence, in multinode grids governed by equations (7 and 8), we might hypothesize that the synchronous state should be very stable against perturbations that hit a node i with large degree di, as the overall coupling to the grid, diK, increases linearly with di. To check this, we compute the average basin stability 〈S〉 of all nodes in the whole ensemble that have degree d. The resulting characteristic is shown in Fig. 2b. It is rather flat and has a large standard deviation. Hence, against the initial guess, basin stability 〈S〉 does not significantly increase with d. Degree does, however, possess a second-order importance: if the neighbours of node i have a large average degree

(a) Histogram of single-node basin stability Si for all nodes in all ensemble networks. Dotted lines delimit nodes with poor stability (Si<0.30) and high stability (Si>0.95). (b) Ensemble average basin stability 〈S〉 of nodes with degree d. (c,d) 〈S〉 of nodes of degree d whose neighbours have the average degree dav ((c) d=1, 2, (d) d=3, 4). (e) 〈S〉 of nodes with shortest-path betweenness b. (f) Shown are typical examples of nodes (coloured red) that have certain distinct values of betweenness b. They are located inside dead ends or dead trees (see also Fig. 3a). The dashed boxes indicate the respective remainder of the grid that contains the printed-on number of nodes. In b–e, red and green shades indicate ±one s.d. Simulation parameters: N=100, E=135, α=0.1, P=1 and K=8 (see Methods).

then the expected basin stability 〈S〉 is large (provided di≥2, Fig. 2c,d)
A major clue for understanding these observations, and the influence of topology on stability in general, comes from the characteristic that shows how the average basin stability 〈S〉 of nodes in the ensemble depends on another tried and tested network metric, the so-called shortest-path betweenness b. For node i, shortest-path betweenness bi measures how many of all shortest paths in the network run through i. It is defined24 as

where Πjk is the number of shortest paths from node j to node k and  is the number of shortest paths from node j to node k that go through node i. Although the curve 〈S〉(b) (see Fig. 2e) is insignificant for most values of b, it reveals some pronounced downward peaks that, according to the explanatory sketch (Fig. 2f), show that the synchronous state is particularly unstable against perturbations hitting nodes that are located inside dead ends, or more generally dead trees, which are discernible by very specific betweenness values. This is illustrated by the network snippet in Fig. 3a, in which the nodes marked 4 and 6 are both located within a dead tree. As can be seen from Fig. 2f, their betweenness values are b4=3N−10 and b6=N−2. In agreement with the statistics in Fig. 2e, the two nodes possess poor levels of basin stability.

(a) Shown is a snippet from the Northern European power grid (see Fig. 4). Squares (circles) depict net consumers with Pi=−P (net generators with Pi=+P). The colour scale indicates how large a node’s basin stability Si is. The set of nodes {4, 5, 6, 7} makes up a dead tree that includes two dead ends: {5} and {6, 7}. Nodes 4 and 6 have the distinct betweenness values b4=3N−10 and b6=N−2. As expected from Fig. 3e,f, they possess a poor basin stability. Note that the nodes labelled {1, 2, 3, 4, 5, 6, 7} here correspond to nodes {91, 90, 85, 88, 89, 87, 86} in Supplementary Table 1 and Supplementary Note 4. (b) Ensemble average basin stability 〈S〉 of nodes of degree d that are adjacent or non-adjacent to dead trees. Shades indicate±one s.d. Nodes inside dead trees are not included in the statistics. (c,d) Time series of nodal frequencies after a particular perturbation has hit node (c) 2, (d) 6 of the network snippet shown in (a). Ensemble simulation parameters: N=100, E=135, α=0.1, P=1 and K=8 (see Methods).
Why is that? A detailed statistical analysis of the grid dynamics (see Supplementary Note 2) reveals that a large single-node perturbation of the form (11) can, for most fair-stability nodes, only induce one sort of non-synchronous state: the node i that is initially affected becomes strongly desynchronized, having its frequency ωi oscillating about Pi/α (cf. equation (3)), whereas all other nodes remain almost synchronous (ω oscillating close to zero). This case is illustrated in Fig. 3c, in which a large perturbation hits node 2 of the network snippet shown in Fig. 3a. However, when a dead end is close-by, perturbations tend to creep into it, rattling and desynchronizing the nodes it contains. By this mechanism, multiple other sorts of non-synchronous states can arise—for instance, the one depicted in Fig. 3d. Here a large perturbation that initially affects node 6 (cf. Fig. 3a) leaves this node almost synchronous but heavily desynchronizes the dead-end node 7 (which is pushed to oscillate around P7/α, cf. equation (3)).
These observations suggest that dead trees should drastically lower the basin stability of nodes adjacent to them. We find that this is indeed the case (Fig. 3b). Furthermore, non-adjacent nodes do display the increasing dependence of 〈S〉 on degree d we had hypothesized earlier. It is now clear why we could not already observe this dependence in Fig. 2b: the characteristic shown there is, basically, an average over the two curves of Fig. 3b. In this average, the curve associated with nodes adjacent to dead trees becomes ever more dominant as d increases because a randomly picked node with large degree is very likely to be connected to at least one stability-adverse dead tree. Conversely, as dead trees in our ensemble grids often consist of a single degree-one node, a randomly picked node whose neighbours have a large average degree is unlikely to be connected to a dead tree. Hence, the increase of the curves in Fig. 2c,d.
Case study
Do these results from the random-grid ensemble carry over to real-world topologies? We now turn to a case study of the Northern European power grid whose transmission part, with N=236 nodes and E=320 connections, is depicted in Fig. 4 (see Methods and Supplementary Note 4). As before, in order to concentrate on the effects of the wiring topology, we neglect other transmission and generation details, randomly assign N/2 net generators (with Pi=+P) and N/2 net consumers (with Pi=−P) and perform numerical simulations of the coarse-grained model equations (7 and 8) to estimate single-node basin stability Si for every node (see listing in Supplementary Table 1). What we find is in line with the ensemble results: the grid’s synchronous state is especially unstable against large perturbations hitting nodes adjacent to or inside of dead ends or dead trees. For example, observe the poor basin stability values of nodes 1, 2 and 3 indicated in Fig. 4.

The grid has N=236 nodes and E=320 transmission lines. The load scenario was chosen randomly, with squares (circles) depicting N/2 net consumers with Pi=−P (net generators with Pi=+P). The colour scale indicates how large a node’s basin stability Si is. Insets I–III show that re-computed basin stability values after 27 lines have been added in order to ‘heal’ dead trees. New lines are coloured red. Our simulation parameters, α=0.1, P=1 and K=8, imply the simplifying assumptions that all generators in the grid are of the same making and that all transmission lines are of the same voltage and impedance. These assumptions enable us to focus on the effects of the (unweighted) topology. For details, see Methods, Supplementary Table 1 and Supplementary Note 4. Note that the nodes labelled {1, 2, 3, 4} here correspond to nodes {192, 208, 96, 176} in the listings in the Supplementary Information.
Would a ‘healing’ of the appendices bring benefits? To check this, we virtually add transmission lines to the grid according to a simple procedure: for each dead tree, the node is identified in the grid that has the minimum Euclidean distance to any node inside the tree, yet is not itself part of or adjacent to the tree. Then we add a transmission line between this node and the tree node it is so close to. These steps are repeated until all dead trees have been ‘healed’. On the assumption that the costs for each new line are proportional to the Euclidean distance spanned, the total costs of the procedure depend on the order in which the appendices are handled. We employ the most cost-efficient order.
This leaves us with 27 extra lines, of which some are shown in red in the insets of Fig. 4 (all of them are shown in Supplementary Fig. 2). Admittedly, this is a quick fix, and some of these lines may be impossible to build in the real world because of geological constraints such as mountain ridges. Nevertheless, it is illustrative to evaluate the impact of the new topology they induce.
Therefore, we now re-estimate the single-node basin stability for all nodes. The results, listed in Supplementary Table 1 and illustrated in the insets of Fig. 4, demonstrate that these few extra lines—just 8% of the total number—suffice to improve stability significantly. In particular, the amended grid has no poor-stability (red) nodes anymore.
Discussion
We have investigated the stability of power grids by means of a component-wise version of basin stability, a method that has not been used before and, we believe, might also benefit investigations into other multicomponent systems, including ecosystems25, food webs26 and gene regulatory networks27,28. Specifically, we have assigned to each node of a power grid a number called single-node basin stability that measures how stable the grid’s synchronous state is against large perturbations hitting that node. This way, nodes can roughly be classified into three groups, corresponding to poor stability, fair stability and high stability.
Of the many functional aspects that presumably matter for this stability classification, we have focussed on the impact of the network topology and performed a statistical analysis of an ensemble of artificially generated power grids. We have found several clear relationships: first, as one might expect, nodes that have a large degree and are thus strongly coupled to the grid are likely to have high stability. Second, and less expected, nodes adjacent to dead ends or dead trees are likely to possess poor stability, and on average even show much poorer stability than nodes that terminate such appendices. In a detailed investigation of the grid dynamics, we uncovered that this is because of the fact that dead trees provide easy access to certain non-synchronous states in state space. In addition, the effect is a strong one: a node adjacent to a dead tree is likely to have poor stability even if it has a large degree.
In a case study of the Northern European power grid, we have observed that nodes adjacent to dead trees indeed tend to have poor stability and established that the inverse statement is also true: ‘healing’ of dead trees through addition of transmission lines substantially enhances stability.
When interpreting these findings, one has to take into account the simplifications our study is based on. First, we have sought to obtain a maximally clear view on the effects that the topology has on grid stability, and for that purpose neglected a host of other details on generators, load characteristics and transmission systems. Second, we have treated large perturbations as initially affecting only two of our model grids’ 2N-dimensions, disregarding that any real short circuit, load switching or severe fluctuation in renewable generation is sure to affect every node in a grid to some extent.
On one hand, these simplifications should gradually be overcome in future studies by incorporating ever more dynamical details and inhomogeneities, and by striving for more realistic, higher dimensional representations of large perturbations. As a first step beyond the single-node perspective offered here, one could for instance investigate how actual short circuits may affect localized groups of nodes. On the other hand, the simplifications have enabled us to isolate a drastic effect of the topology on the dynamics: the mere presence of dead trees makes it easier to push a grid into a blackout-inducing non-synchronous state. As the model we use captures the complex nonlinear coupled-rotating-mass dynamics that is among the main determinants of a power grid’s response to large perturbations, we consider it likely that this effect also exists in the real world.
There may be different remedies to the adverse impact of dead trees. Congruent with the focus of this study, we have suggested a topological solution: ‘healing’ of dead trees through addition of transmission lines. Other solutions on which research could be performed may include increasing the transfer capacity of lines inside a dead tree or placing extra control devices or damper windings at particular nodes. The point is that dead trees appear to make such additional investment necessary—or else increase the risk of a potentially very expensive29,30,31 large-scale blackout. Therefore, we propose to add one item to the list of power grid design principles: in order not to topologically undermine grid stability, avoid dead ends! With regard to the worldwide effort of making power grids more sustainable by connecting new low-carbon generation facilities, it might be particularly worth heeding this principle: when taking into account systemic risks and burdens, the seemlingly cheapest connection schemes, tree-like structures, may not be so cheap after all.
What remains to be done? A very concrete question arises from the ‘healing’ procedure we have applied to the Northern European grid: whereas the addition of transmission lines significantly benefitted the single-node basin stability of 30 of the 236 nodes (see Supplementary Table 1), at the same time it made the stability of two nodes reduce from high to fair (see node 4 in Fig. 4). We cannot explain this detrimental effect yet. Hence, it might be fruitful to perform a systematic investigation along the lines of the paper by Witthaut and Timme13 to see by which mechanisms addition of transmission lines can harm basin stability.
In addition, one could explore parallels and differences between the linear approach to stability and the nonlinear one adopted here. For instance, Lozano et al.14 observed that a grid’s linear stability may be diminished by groups of nodes that are connected to the bulk of the grid by only a single transmission line. Similarly, we have found that dead trees, which are also connected to the bulk by only one line, significantly decrease nonlinear basin stability. Besides, we have performed a single-node assessment of linear stability analogous to single-node basin stability by measuring for each node the convergence rate after small single-node perturbations. However, the outcome turned out to be very plain: we found the same convergence rate for all nodes (see Supplementary Note 3). The analysis of Motter et al.16 helps to offer an explanation of this outcome as an effect of the simplifying assumption of identical damping constants that we made. In future, it may hence be worthwile performing another single-node investigation of linear stability under more heterogeneous circumstances.
Finally, the relation between grid properties and the synchronous state’s basin of attraction deserves further determined research effort. Deeper understanding may lead towards more elaborate design principles that would make tomorrow’s power grids even more stable than today’s.
Methods
Power grid model
Power grids are vast, highly complex machines and one usually focusses on the aspects most relevant for the problem to be addressed instead of modelling every detail as accurately as possible5. Along these lines, we employ in this paper a model of the extrahigh-voltage transmission part of a power grid to investigate how the effects of large perturbations unfold there, treating devices connected to the lower-voltage distribution grids in a coarse-grained way.
Specifically, (i) we model all loads and renewable generation facilities as constant consumers or producers of power that are connected to the transmission grid via radially organized distribution networks. These networks are eliminated by means of Kron reduction5,32. (ii) We replace according to Zhukov’s aggregation method5 all rotating masses connected to a node in the transmission grid by a single equivalent generator that has the cumulative moment of inertia and the cumulative power injection. (iii) We assume that there are some rotating masses connected to every node of the transmission grid. This is intended to take into account the large number of small-scale generation present in every power system33 and leads to an equivalent generator being placed at every node of the transmission grid in step (ii).
The system of equivalent generators connected by lines of the transmission grid is modelled using the classical swing equation system (see refs 5, 13, 17 for a derivation)


where θi, ωi and Vi are the phase, angular frequency and magnitude of the voltage vector at equivalent generator i, measured in a frame of reference that co-rotates with the grid’s rated frequency ωs. Furthermore, Mi is the cumulative moment of inertia of the masses represented by node i,  is their cumulative power injection (both terms result from Zhukov’s aggregation),
  is the amount of power consumed or injected by constant loads and renewable generation devices (this term results from Kron reduction) and Li is the net injected power. The model incorporates frequency dynamics based on the balance of active power but neglects voltage dynamics on the assumption of perfect reactive power control. Note that equations (14 and 15) formally correspond to a second-order Kuramoto model34.
In the model, the damping constant Di reflects not so much the effect of mechanical friction (which is very small) but incorporates into the model the important role of damping windings built in to keep frequencies as close as possible to ωs. Moreover, the admittance matrix {Yij} represents extrahigh-voltage transmission lines, with Yij=1/Xij if there is a line between nodes i and j and Yij=0 otherwise. Therein, Xij is the reactance of a transmission line (its resistance is comparatively small5 and often neglected in transient stability studies).
To obtain the model equations (1 and 2) resp. equations (7 and 8) used above, we divide equation (15) by Miωs and define αi=Di/(Miωs), Pi:=Li/(Miωs) and Kij:=YijViVj/(Miωs).
Synchronous state
The multinode model’s state space could in principle accomodate multiple synchronous invariant sets, each of them satisfying ωi=0 and  for all i and characterized by a specific set of phase differences {θi−θj|i≠j}. However, for each of the grids we have studied, a single synchronous invariant set turned out to be dominant in the sense that it attracted the vast majority of synchronizing initial conditions around the set {ωi=0 for all i}. In the main text, we refer to the dominant synchronous invariant set of a grid as the synchronous state.
Model parameters
In both the ensemble study and the case study of the Northern European power grid, we choose the model parameters as follows. As we seek to focus on the effects of the (unweighted) topology, we assume that (i) all generators are of the same making, so that Mi=M and Di=D for all i; (ii) the voltage level is the same everywhere, so that Vi=V for all i; (iii) all transmission lines have the same reactance, so that Xij=X if there is a line between i and j. Furthermore, we impose a load scenario in which half of the nodes are randomly selected to be net generators with Li=L>0 and the other half are net consumers with Li=−L. This choice satisfies the synchronization condition of total generated power being equal to total consumed power,  .
.
We specify a load scenario by setting L=200 MW and choose as the transmission capacity V2/X=1,600 MW, which corresponds7 to a 400-km-long line at a voltage of 380 kV. Furthermore, we set M=40 × 103kg m2, which amounts to35 assuming the inertia of a 400 MW power plant at each node. Note that the average installed generation capacity per node in the Northern European extrahigh-voltage transmission grid is indeed 400 MW (amounting to a total36 of 96 GW).
With ωs=2π × 50 Hz≈314.59 s−1, these settings give P=L/(Mωs)≈16 s−2 and K=(V2/X)/(Mωs) ≈128 s−2. 1/α is the decay time of electromechanical transients induced by large perturbations and is typically of the order5 1–10 s. Here we choose α=0.4 s−1 so that 1/α=2.5 s. Finally, we measure time in units of 0.25 s, so that in our simulations P=1, K=8 and α=0.1. Note that the Northern Grid configuration shown in Fig. 4 can cope with up to P=1.86 at K=8, so that our setting P=1 can be considered a modest load scenario.
Parameter sensitivity
In general, we observe that single-node basin stability increases in the simulated power grids when the damping constant α or the transfer capacity K increases. However, our main finding is retained: nodes adjacent to (or inside of) dead trees typically reveal stability values that are significantly below the average stability of non-adjacent nodes. This is illustrated in Supplementary Fig. 3, for which we re-estimated basin stability of the Northern European transmission grid, now using α=0.2 (doubled compared with before), P=1.6 and K=8.
Basin of attraction
In a dynamical system, the basin of attraction of an attractor is defined as the set of initial states from which the system converges to this attractor. In Fig. 1a–c, the green area shows the basin of attraction of the one-node model’s synchronous state (a fixed point) and the white area shows the basin of the non-synchronous state (a limit cycle). Basins of attraction are a fundamental concept of dynamical systems theory and can be very complicated in nature37.
Ensemble of randomly generated networks
We study 1,000 randomly generated power grid networks with N=100 nodes and E=135 transmission lines. These settings yield the average degree 〈d〉=2.7, a value typical of power transmission grids23. For each power grid in the ensemble, we estimate basin stability Si for each node i. The ensemble average 〈S〉 for a certain topological property (such as betweenness b=3N−10) is computed by averaging over the Si of all nodes in the ensemble that possess this property.
Additional information
How to cite this article: Menck, P. J. et al. How dead ends undermine power grid stability. Nat. Commun. 5:3969 doi: 10.1038/ncomms4969 (2014).
References
Schellnhuber, H. J., Cramer, W., Nakicenovic, N., Wigley, T. & Yohe, G. Avoiding Dangerous Climate Change Cambridge University Press (2006).
Stern, N. N. H. The Economics of Climate Change: the Stern Review Cambridge University Press (2007).
Federal Government of Germany. Energiekonzept für eine umweltschonende, zuverlässige und bezahlbare Energieversorgung (2011) http://www.bmu.de/fileadmin/bmu-import/files/pdfs/allgemein/application/pdf/energiekonzept_bundesregierung.pdf (accessed 13 December 2013).
Ewart, D. N. Whys and wherefores of power system blackouts: an examination of the factors that increase the likelihood and the frequency of system failure. IEEE Spectrum 15, 36–41 (1978).
Machowski, J., Bialek, J. W. & Bumby, J. R. Power System Dynamics: Stability and Control John Wiley & Sons (2008).
Hill, D. J. & Chen, G. in:Proc. of the 2006 IEEE Int. Sym. on Circuits and Systems 722–725 (2006).
Spring, E. Elektrische Energienetze: Energieübertragung und -verteilung VDE Verlag GmbH (2003).
Motter, A. E. & Lai, Y.-C. Cascade-based attacks on complex networks. Phys. Rev. E 66, 065102 (2002).
Crucitti, P., Latora, V. & Marchiori, M. Model for cascading failures in complex networks. Phys. Rev. E 69, 045104 (2004).
Buldyrev, S. V., Parshani, R., Paul, G., Stanley, H. E. & Havlin, S. Catastrophic cascade of failures in interdependent networks. Nature 464, 1025–1028 (2010).
Dobson, I. Complex networks: synchrony and your morning coffee. Nat. Phys. 9, 133–134 (2013).
Rohden, M., Sorge, A., Timme, M. & Witthaut, D. Self-organized synchronization in decentralized power grids. Phys. Rev. Lett. 109, 064101 (2012).
Witthaut, D. & Timme, M. Braess’s paradox in oscillator networks, desynchronization and power outage. New J. Phys. 14, 083036 (2012).
Lozano, S., Buzna, L. & Daz-Guilera, A. Role of network topology in the synchronization of power systems. Eur. Phys. J. B 85, 1–8 (2012).
Dörfler, F., Chertkov, M. & Bullo, F. Synchronization in complex oscillator networks and smart grids. Proc. Natl Acad. Sci. USA 110, 2005–2010 (2013).
Motter, A. E., Myers, S. A., Anghel, M. & Nishikawa, T. Spontaneous synchrony in power-grid networks. Nat. Phys. 9, 191–197 (2013).
Filatrella, G., Nielsen, A. H. & Pedersen, N. F. Analysis of a power grid using a Kuramoto-like model. Eur. Phys. J. B 61, 485–491 (2008).
Chiang, H.-D. Direct Methods for Stability Analysis of Electric Power Systems John Wiley & Sons (2011).
Chiang, H.-D., Chu, C.-C. & Cauley, G. Direct stability analysis of electric power systems using energy functions: theory, applications, and perspective. Proc. IEEE 83, 1497–1529 (1995).
Menck, P. J., Heitzig, J., Marwan, N. & Kurths, J. How basin stability complements the linear-stability paradigm. Nat. Phys. 9, 89–92 (2013).
von Neumann, J. Various techniques used in connection with random digits. Appl. Math Ser. 12, 1 (1951).
Wiley, D. A., Strogatz, S. H. & Girvan, M. The size of the sync basin. Chaos 16, 015103 (2006).
Sun, K. Complex networks theory: a new method of research in power grid. Transm. Distrib. Conf. Exhib. Asia Pacific 2005 IEEE/PES 1–6 (2005).
Newman, M. E. J. The structure and function of complex networks. SIAM Rev. 45, 167–256 (2003).
May, R. M. Thresholds and breakpoints in ecosystems with a multiplicity of stable states. Nature 269, 471–477 (1977).
Gross, T., Rudolf, L., Levin, S. A. & Dieckmann, U. Generalized models reveal stabilizing factors in food webs. Science 325, 747–750 (2009).
Cookson, N. A., Tsimring, L. S. & Hasty, J. The pedestrian watchmaker: genetic clocks from engineered oscillators. FEBS Lett. 583, 3931 (2009).
Huang, S. & Ingber, D. E. A non-genetic basis for cancer progression and metastasis: Self-organizing attractors in cell regulatory networks. Breast Dis. 26, 27–54 (2007).
Fairley, P. The unruly power grid. IEEE Spectrum 41, 22–27 (2004).
Newman, D. E., Carreras, B. A., Lynch, V. E. & Dobson, I. Exploring complex systems aspects of blackout risk and mitigation. IEEE Trans. Reliab. 60, 134–143 (2011).
U.S.-Canada Power System Outage Task Force. Final report on the August 14, 2003 Blackout in the united states and canada: causes and recommendations (2004) http://energy.gov/sites/prod/files/oeprod/DocumentsandMedia/BlackoutFinal-Web.pdf (accessed 13 December 2013).
Dörfler, F. & Bullo, B. Kron reduction of graphs with applications to electrical networks. IEEE Trans Circuits Syst. 60, 153–163 (2013).
Bollen, M. H. & Hassan, F. Integration of Distributed Generation in the Power System John Wiley & Sons (2011).
Kuramoto, Y. InInternational Symposium on Mathematical Problems in Theoretical Physics 420–422Springer (1975).
Horowitz, S. H. & Phadke, A. G. Power System Relaying John Wiley & Sons (2008).
ENTSO-E. Statistical yearbook 2011. https://www.entsoe.eu/fileadmin/user_upload/_library/publications/entsoe/Statistical_Yearbook/SYB_2011/121216_SYB_2011_final.pdf (accessed 13 December 2013).
Nusse, H. E. & Yorke, J. A. Basins of attraction. Science 271, 1376–1380 (1996).
Acknowledgements
The authors acknowledge financial support from the Government of the Russian Federation (Agreement No. 14.Z50.31.0033), IRTG 1740 (Deutsche Forschungsgemeinschaft), the SWIPO-Project (European Union EIT Climate-KIC) and Konrad-Adenauer-Stiftung. P.J.M. dankt Annbritt, Emil, Ole und Alma.
Author information
Authors and Affiliations
Contributions
P.J.M. conceived the study, performed the numerics and prepared the manuscript. All authors discussed the results, drew conclusions and edited the manuscript.
Corresponding author
Ethics declarations
Competing interests
The authors declare no competing financial interests.
Supplementary information
Supplementary Information
Supplementary Figures 1-3, Supplementary Table 1 and Supplementary Notes 1-4 (PDF 487 kb)
Rights and permissions
About this article

Cite this article
Menck, P., Heitzig, J., Kurths, J. et al. How dead ends undermine power grid stability. Nat Commun 5, 3969 (2014). https://doi.org/10.1038/ncomms4969
Received:
Accepted:
Published:
DOI: https://doi.org/10.1038/ncomms4969
This article is cited by
-
Autonomous inference of complex network dynamics from incomplete and noisy data
Nature Computational Science (2022)
-
Coupled power generators require stability buffers in addition to inertia
Scientific Reports (2022)
-
HFANet: hierarchical feature fusion attention network for classification of glomerular immunofluorescence images
Neural Computing and Applications (2022)
-
bSTAB: an open-source software for computing the basin stability of multi-stable dynamical systems
Nonlinear Dynamics (2022)
-
Asymmetry underlies stability in power grids
Nature Communications (2021)
Comments
By submitting a comment you agree to abide by our Terms and Community Guidelines. If you find something abusive or that does not comply with our terms or guidelines please flag it as inappropriate.
