
Abstract
Human-associated microbial communities have a crucial role in determining our health and well-being1,2, and this has led to the continuing development of microbiome-based therapies3 such as faecal microbiota transplantation4,5. These microbial communities are very complex, dynamic6 and highly personalized ecosystems3,7, exhibiting a high degree of inter-individual variability in both species assemblages8 and abundance profiles9. It is not known whether the underlying ecological dynamics of these communities, which can be parameterized by growth rates, and intra- and inter-species interactions in population dynamics models10, are largely host-independent (that is, universal) or host-specific. If the inter-individual variability reflects host-specific dynamics due to differences in host lifestyle11, physiology12 or genetics13, then generic microbiome manipulations may have unintended consequences, rendering them ineffective or even detrimental. Alternatively, microbial ecosystems of different subjects may exhibit universal dynamics, with the inter-individual variability mainly originating from differences in the sets of colonizing species7,14. Here we develop a new computational method to characterize human microbial dynamics. By applying this method to cross-sectional data from two large-scale metagenomic studies—the Human Microbiome Project9,15 and the Student Microbiome Project16—we show that gut and mouth microbiomes display pronounced universal dynamics, whereas communities associated with certain skin sites are probably shaped by differences in the host environment. Notably, the universality of gut microbial dynamics is not observed in subjects with recurrent Clostridium difficile infection17 but is observed in the same set of subjects after faecal microbiota transplantation. These results fundamentally improve our understanding of the processes that shape human microbial ecosystems, and pave the way to designing general microbiome-based therapies18.
This is a preview of subscription content, access via your institution
Access options
Subscribe to this journal
Receive 51 print issues and online access
$199.00 per year
only $3.90 per issue
Buy this article
- Purchase on Springer Link
- Instant access to full article PDF
Prices may be subject to local taxes which are calculated during checkout


References
Cho, I. & Blaser, M. J. The human microbiome: at the interface of health and disease. Nat. Rev. Genet. 13, 260–270 (2012)
Pflughoeft, K. J. & Versalovic, J. Human microbiome in health and disease. Annu. Rev. Pathol. 7, 99–122 (2012)
Lozupone, C. A., Stombaugh, J. I., Gordon, J. I., Jansson, J. K. & Knight, R. Diversity, stability and resilience of the human gut microbiota. Nature 489, 220–230 (2012)
Borody, T. J. & Khoruts, A. Fecal microbiota transplantation and emerging applications. Nat. Rev. Gastroenterol. Hepatol. 9, 88–96 (2011)
Aroniadis, O. C. & Brandt, L. J. Fecal microbiota transplantation: past, present and future. Curr. Opin. Gastroenterol. 29, 79–84 (2013)
Gerber, G. K. The dynamic microbiome. FEBS Lett. 588, 4131–4139 (2014)
Costello, E. K., Stagaman, K., Dethlefsen, L., Bohannan, B. J. M. & Relman, D. a. The application of ecological theory toward an understanding of the human microbiome. Science 336, 1255–1262 (2012)
Franzosa, E. A. et al. Identifying personal microbiomes using metagenomic codes. Proc. Natl Acad. Sci. USA 112, E2930–E2938 (2015)
The Human Microbiome Project Consortium. Structure, function and diversity of the healthy human microbiome. Nature 486, 207–214 (2012)
Bucci, V. & Xavier, J. B. Towards predictive models of the human gut microbiome. J. Mol. Biol. 426, 3907–3916 (2014)
David, L. A. et al. Host lifestyle affects human microbiota on daily timescales. Genome Biol. 15, R89 (2014)
Sommer, F. & Backhed, F. The gut microbiota—masters of host development and physiology. Nat. Rev. Microbiol. 11, 227–238 (2013)
Goodrich, J. K. et al. Human genetics shape the gut microbiome. Cell 159, 789–799 (2014)
Walter, J. & Ley, R. The human gut microbiome: ecology and recent evolutionary changes. Annu. Rev. Microbiol. 65, 411–429 (2011)
The Human Microbiome Project Consortium. A framework for human microbiome research. Nature 486, 215–221 (2012)
Flores, G. E. et al. Temporal variability is a personalized feature of the human microbiome. Genome Biol. 15, 531 (2014)
Youngster, I. et al. Fecal microbiota transplant for relapsing Clostridium difficile infection using a frozen inoculum from unrelated donors: a randomized, open-label, controlled pilot study. Clin. Infect. Dis. 58, 1515–1522 (2014)
Lemon, K. P., Armitage, G. C., Relman, D. a. & Fischbach, M. a. Microbiota-targeted therapies: an ecological perspective. Sci. Transl. Med. 4, 137rv135 (2012)
Levy, R. & Borenstein, E. Metabolic modeling of species interaction in the human microbiome elucidates community-level assembly rules. Proc. Natl Acad. Sci. USA 110, 12804–12809 (2013)
Jumpertz, R. et al. Energy-balance studies reveal associations between gut microbes, caloric load, and nutrient absorption in humans. Am. J. Clin. Nutr. 94, 58–65 (2011)
Faust, K. & Raes, J. Microbial interactions: from networks to models. Nat. Rev. Microbiol. 10, 538–550 (2012)
Friedman, J. & Alm, E. J. Inferring correlation networks from genomic survey data. PLoS Comput. Biol. 8, e1002687 (2012)
Koren, O. et al. A guide to enterotypes across the human body: meta-analysis of microbial community structures in human microbiome datasets. PLoS Comput. Biol. 9, e1002863 (2013)
Gibson, T. E., Bashan, A., Cao, H.-T., Weiss, S. T. & Liu, Y.-Y. On the origins and control of community types in the human microbiome. PLOS Comput. Biol. 12, e1004688 (2016)
Stein, R. R. et al. Ecological modeling from time-series inference: insight into dynamics and stability of intestinal microbiota. PLOS Comput. Biol. 9, e1003388 (2013)
Fisher, C. K. & Mehta, P. Identifying keystone species in the human gut microbiome from metagenomic timeseries using sparse linear regression. PLoS ONE 9, e102451 (2014)
Buffie, C. G. et al. Precision microbiome reconstitution restores bile acid mediated resistance to Clostridium difficile. Nature 517, 205–208 (2015)
Caporaso, J. G. et al. Moving pictures of the human microbiome. Genome Biol. 12, R50 (2011)
Kassam, Z., Lee, C. H., Yuan, Y. & Hunt, R. H. Fecal microbiota transplantation for Clostridium difficile infection: systematic review and meta-analysis. Am. J. Gastroenterol. 108, 500–508 (2013)
Lozupone, C. A., Hamady, M., Kelley, S. T. & Knight, R. Quantitative and qualitative beta diversity measures lead to different insights into factors that structure microbial communities. Appl. Environ. Microbiol. 73, 1576–1585 (2007)
Faith, J. J. et al. The long-term stability of the human gut microbiota. Science 341, 1237439 (2013)
Gilbert, J. A. & Alverdy, J. Stool consistency as a major confounding factor affecting microbiota composition: an ignored variable? Gut 65, 1–2 (2016)
Vandeputte, D. et al. Stool consistency is strongly associated with gut microbiota richness and composition, enterotypes and bacterial growth rates. Gut 65, 57–62 (2016)
Lawley, T. D. et al. Targeted restoration of the intestinal microbiota with a simple, defined bacteriotherapy resolves relapsing Clostridium difficile disease in mice. PLoS Pathog. 8, e1002995 (2012)
Faust, K. & Raes, J. Microbial interactions: from networks to models. Nat. Rev. Microbiol. 10, 538–550 (2012)
Goodrich, J. K. et al. Conducting a microbiome study. Cell 158, 250–262 (2014)
Benjamini, Y. & Hochberg, Y. Controlling the false discovery rate: a practical and powerful approach to multiple testing. J. R. Statist. Soc. B 57, 289–300 (1995)
Wu, G. D. et al. Linking long-term dietary patterns with gut microbial enterotypes. Science 334, 105–108 (2011)
Bickel, S. L., Tang, K. W. & Grossart, H.-P. Ciliate epibionts associated with crustacean zooplankton in German lakes: distribution, motility and bacterivory. Front. Microbiol. 3, 243 (2012)
Acknowledgements
We thank E. K. Silverman, G. Weinstock, C. Huttenhower, R. Knight, G. Ackermann, D. Del Vecchio, D. Lauffenburger, G. Abu-Ali, J. Sordillo, M. McGeachie, and J. Gore for discussions. Special thanks to A.-L. Barabási and J. Loscalzo for careful reading of the manuscript. This work was partially supported by the John Templeton Foundation (award number 51977) and National Institutes of Health (R01 HL091528).
Author information
Authors and Affiliations
Contributions
Y.-Y.L. conceived and designed the project. A.B. developed the DOC analysis, performed numerical simulations, and analysed all the real data. A.B. and Y.-Y.L. performed analytical calculations. A.B. and V.J.C. performed statistical tests. All authors analysed the results. A.B. and Y.-Y.L. wrote the manuscript. All authors edited the manuscript.
Corresponding author
Ethics declarations
Competing interests
The authors declare no competing financial interests.
Additional information
Reviewer Information Nature thanks F. He, P. Rohani and the other anonymous reviewer(s) for their contribution to the peer review of this work.
Extended data figures and tables
Extended Data Figure 1 Displacement of normalized N-dimensional random walks.
a, Trajectory of a two-dimensional random-walk represents the absolute abundance of two species  . The initial state is marked by a red circle and the first 100 steps are shown. The solid black line is the one-dimensional simplex upon which the locations are projected to obtain the relative abundances
  . The dotted lines starting at the origin represent the projection process: all the points in a dotted line have the same relative abundances and they are all projected to the intersection of the dotted line and the simplex (for example, the solid red and green circles are projected to the red and green open circles, respectively). We define a new coordinate
 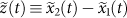 for the location of normalized relative abundance on the simplex. The displacement of the normalized random walk after t steps is then
  , where
  is the projected location of the initial state (see, as an example, the distance between the green and the red open circles in a). b, Distributions of displacement of an ensemble of 1,000 random walks after t steps (t = 1, 5, 10, 100, 1,000). For small t, the displacement distributions depend on t, while for large t (t = 100, 1,000) the distributions are the same. c, Symbols represent the average displacement of 1,000 N-dimensional normalized random walks (here we set N = 50), measured as DrJSD, and the error bars represent the s.d. Each random walk is forced to stay on the positive orthant, that is, if
  we set
  . DrJSD was calculated using all N coordinates, setting
  as a pseudo count for
  . Where t is small, the distance grows with increasing t; however, the distance saturates for large t. The dashed red and green lines represent the average distance between two random locations (green) and between the final locations (
 ) of the random walks (red).
Extended Data Figure 2 Detection of group dynamics using an ordination technique.
a–h, In each row, 500 synthetic samples were generated. Samples in the same group were taken from the steady states of the same GLV model of 100 species. The initial species assemblages were determined in two scenarios: at random (a–d) or on the basis of the group (e–h). In the latter scenario, in each group the species were first randomly ordered and then in each of the samples the first f species were selected and the other been removed (f is randomly chosen from a uniform distribution  ). In columns a and e, a standard ordination technique, that is, principal coordinate analysis (PCoA), was applied. All 500 samples were shown in the plane of the first two principal coordinates (using rJSD as the distance metric) and coloured according to their group. In b and f, only the samples that have high overlap (>0.95) with at least one other sample were shown. Panels c and g show the dissimilarity distributions P(rJSD) between the high-overlap sample pairs. Panels d and h show the DOCs. The ordination technique successfully detects the existence of group dynamics (especially when the number of groups is small). We anticipate that the group dynamics can also be detected by classical clustering analysis. In the scenario of random collections, the PCoA of high-overlap samples, that is, samples that have high overlap (>0.95) with at least one other sample, is doing better than the PCoA of all samples to detect group dynamics, especially for a small number (~2–10) of groups. Moreover, for a small number of groups, the dissimilarity distributions P(rJSD) can distinguish between the two scenarios of initial assemblage selection: random or group-based. The ordination technique cannot distinguish between the cases of 500 groups (individual dynamics) and single group (universal dynamics). Those cases can be distinguished by the DOC analysis.
Extended Data Figure 3 Detecting universality in population dynamics models.
Synthetic microbial samples were calculated as steady states of GLV models (see Methods). The GLV models are generated as cohorts (100 models in each cohort) with different levels of (i) inter-species interaction strength; and (ii) universality, tuned by the parameters  and
and  , respectively (see Methods). In each of the 100 models, a random fraction f of the species (
 ) was initially removed, and the remaining species were initiated with random abundance
  ). The dissimilarity–overlap points of sample pairs in each cohort and of the corresponding randomized samples are shown in light blue and yellow, respectively. The solid curves represent the DOCs calculated using the robust LOWESS method. The DOC of cohorts generated by GLV models without inter-species interactions (a1, a4, a7) is flat even in the high-overlap region. This is because, without inter-species interactions, for any sample pair the presence or absence of unique (that is, non-shared) species has no effect on the shared ones. A flat DOC is also observed in the case of individual dynamics (a7, a8, a9), where a higher overlap between sample pairs does not lead to more similar abundance profiles. However, in the case of universal dynamics with strong inter-species interactions (for example, a3), the DOC displays a clear negative slope in the high-overlap region.
Extended Data Figure 4 DOC analysis of gut microbiome samples from longitudinal studies.
a–d, Sample pairs are selected from four different subjects, with number of samples: Ma = 299, Mb = 180, Mc = 336, Md = 131, respectively. The mean DOCs (calculated from 100 bootstrap realizations using the robust LOWESS method) of each subject and the corresponding randomized samples are shown in dark blue and yellow, respectively. The shaded area indicates the range of the 94% confidence intervals. The overlap distributions are shown in red. For all the four subjects, a clear negative slope of the DOC is observed at the high-overlap region, indicating largely time-invariant or universal dynamics for each subject throughout the measurement period. This is in marked contrast with the flat DOC of the null model (see Supplementary Information section 1.3). The secondary peak of lower-overlap samples in b (overlap of ~0.8) is of sample pairs from two different periods, before and after a Salmonella infection, which represent two distinct microbial steady states and thus exhibit a flat DOC. This is consistent with our assumption of time-invariant microbial dynamics for a given healthy individual.
Extended Data Figure 5 DOC analysis of gut microbiome samples is consistent across different studies and different dissimilarity measures.
For two microbiome samples, the dissimilarity of their abundance profiles over shared species can be evaluated by different measures. Weighted measures, such as rJSD, Bray–Curtis (BC) dissimilarity and Yue–Clayton (YC) dissimilarity should be applied to the renormalized abundance profiles, to ensure mathematical independence between the overlap and the dissimilarity measures. Rank-based dissimilarity measures, for example, negative Spearman correlation (nSC), can be directly applied without renormalization. We used the four dissimilarity measures (rJSD, BC, YC and nSC) to calculate the DOC (using robust LOWESS) of gut microbiome samples from two studies: HMP and SMP. In all cases, we observed a pronounced negative slope in the DOC (dark-blue curve) of real sample pairs (light-blue points) and a flat DOC (orange curve) for the pairs of randomized samples (yellow points).
Extended Data Figure 6 Quantifying the universality of human microbial dynamics in different body sites.
a, The fraction (fns) of data for which a negative slope is observed in Fig. 3. Note that for overlap values close to zero (for example, Fig. 3d, f1) a positive slope occurs as the artefact of dissimilarity between relative abundance profiles with small number of species (see Supplementary Information section 1.1.3). For gut and mouth, a negative slope of DOC is observed in the two data sets for a broad range of overlap, indicating a significant universality of microbial dynamics in those habitats. By contrast, the negative slope of DOC in the hand’s skin microbiome is observed only for a small part of the sample pairs. b, Box plot of the slope of DOC calculated from 200 bootstrap realizations. The slope is calculated by fitting a linear mixed-effects model for data points with overlap larger than the median. We report one-tailed P values, calculated as the fraction of bootstrap realizations with a non-negative slope, adjusted for multiple comparisons by the procedure of Benjamini and Hochberg. The null hypothesis of non-negative slope is rejected for all body sites (P < 1 × 10⁻²) except four skin sites: forehead (P = 0.099), palm (P = 0.377) in the SMP study and left/right antecubital fossa in the HMP study (P = 0.099 and P = 0.495).
Extended Data Figure 7 Effects of various host factors on the DOC analysis.
a, The effect of body mass index (BMI) on the DOC analysis. a1, DOC analysis of all gut microbiome sample pairs among 190 subjects from the HMP study. Red points represent samples pairs associated with at least one obese subject (with BMI > 30). a2, Same as in a1, but 13 obese subjects with BMI > 30 were excluded. a3, Blue points represent the gut microbiome samples’ overlap and ΔBMI. The red curve is the average (error bars represent the s.e.m.). a4, Dissimilarity versus ΔBMI. a5, Distribution of ΔBMI values, divided into four groups of equal number of pairs. a6–a9, DOC analysis of the sample pairs in each group. b, The effect of diet on the DOC analysis. b1, Diet difference (Δdiet) between two subjects is defined as the Euclidean distance between their associated diet scores in the two leading principal components PC1 and PC2. In total there are M = 97 healthy subjects in the COMBO study38. b2, Overlap versus Δdiet. Blue points represent the overlap and Δdiet of all gut microbiome pairs among the 97 subjects from the COMBO study. The red curve is the average (error bars represent the s.e.m.). b3, Dissimilarity versus Δdiet. b4, Distribution of Δdiet values, divided into four groups of equal number of pairs. b5–b8, DOC analysis of the pairs in each group. c, The effect of age on the DOC analysis. c1, Overlap versus Δdiet. Blue points represent the overlap and Δage of all gut microbiome samples pairs between the 190 subjects from the HMP study. The red curve is the average (error bars represent the s.e.m.). c2, Dissimilarity versus Δage. c3, Distribution of Δage values, divided into four groups of equal number of pairs. c4–c7, DOC analysis of the pairs in each group. d, The effect of stool consistency on the DOC analysis. d1, DOC analysis of all sample pairs. In this data set the subjects have BSS values between 1 and 6. The points (sample pairs) associated with subjects with BSS = 6 (at least one subject has BSS = 6) are coloured in red. The black line is the DOC. d2, DOC analysis of all subjects with BSS < 6. d3, d4, Among all subjects with 1 ≤ BSS ≤ 5, the overlap and the dissimilarity are independent of ΔBSS. d5, Distribution of ΔBSS values for the 46 subjects with 1 ≤ BSS ≤ 5. d6, d7, DOC analysis of the pairs with similar BSS values, 0 ≤ ΔBSS ≤ 1 (d6), and pairs with more different BSS values, 2 ≤ ΔBSS ≤ 4 (d7). In both cases, a clear negative slope of the DOC is observed. e, The effect of race on the DOC analysis. e1, All subjects (M = 190). e2, e3, White subjects (M = 153) (e2) and Asian subjects (M = 25) (e3). Note that in the HMP study, stool samples were collected from 153 white subjects, 10 black subjects, 25 Asian subjects, and 2 subjects from other races.
Extended Data Figure 8 DOC analysis under special conditions.
a, The effect of strongly interacting species. A comparison of two GLV models of 100 species with random inter-species interactions. The system parameters were fixed for all the simulated samples (M = 100), representing maximal universality. In a1, all species have the same characteristic interaction strength, while in a2, the inter-species interactions of one species are markedly stronger than all other species, representing a strongly interacting species. The presence/absence of the strongly interacting species markedly affects (either directly or indirectly) the abundance profile of many other species, leading to a pronounced secondary cloud of points in the dissimilarity–overlap plane (a4). The effect is the most pronounced in the region of high-overlap (top 5%) pairs, and can be detected by looking at their dissimilarity distributions (a5, a6). b, DOC behaves the same for samples with uniform or skewed abundance distribution. b1, b2, Samples were generated from the steady states of the GLV model with largely uniform abundance distribution (determined mainly by the species growth rates). In the presence of inter-species interactions (b1), a negative slope of the DOC is observed. By contrast, in the absence of inter-species interactions (b2), a flat DOC is observed. b3, Real samples from the gut (from the HMP study, genus level) exhibit a high level of alpha-diversity and a very skewed abundance distribution. A negative slope of the DOC in the high-overlap region is observed. b4, The randomized samples preserve the abundance distribution of the real samples but the effect of inter-species interactions is removed, leading to a flat DOC. c, Effect of core species and non-interacting periphery species. c1, Samples were generated as steady states of the GLV model with N =100 species. The parameters of the GLV model were fixed for all the samples, representing maximal universality. The initial species assemblages were chosen as follows: 30 species were present in all the samples, representing a set of ‘core species’, and the other 70 ‘peripheral’ species were present with lower probability (mean 0.18, min 0.12, and max 0.24). c2, Presence probability of real gut microbial samples, from the HMP at the genus level. Only one genus (Bacterioides) is present in all the samples. c3, Species presence probability in a GLV model where all species are present with average probability 0.6. c4, The effect of the interactions of the peripheral species. In the GLV model, the inter-species interactions among the core species (core–core) has a characteristic strength σcore = 0.15, and both the periphery–periphery and the periphery–core interactions have a characteristic strength σp. When σp = 0, that is, the peripheral species do not interact with the core species, the DOC is flat. When σp > 0, the DOC has a negative slope. c5, c6, In the case of real gut microbiome samples as well as the GLV model without core species, the DOC has a negative slope in the high-overlap region. d, The effect of sequencing depth on the DOC analysis. d1, Richness (number of present OTUs) versus sequencing depth of 190 HMP gut samples. 12 subjects with fewer than 1,300 reads per sample were excluded and the remaining 178 were assigned into two groups of n = 89 subjects, with average sequencing depth 3,019 and 8,640 reads per sample. d2, d3, The characteristic overlap between samples of group 1 is smaller than between samples of group 2. However, DOC analysis of each group shows a clear negative slope. d4–d6, Samples of each group were rarefied before analysis with minimal community size of 1,317 and 4,333 in group 1 and 2, respectively, as represented by the black dashed lines in d4. d7–d9, Samples of both groups were rarefied before analysis with the same minimal community size of 1,317, as represented by the black dashed line in d7.
Extended Data Figure 9 DOC analysis of longitudinal microbiome data from six lakes in Germany39.
Data downloaded from http://qiita.microbio.me, study ID 945. a, Stechlin (M = 440). b, Haus (M = 26). c, Tiefwaren (M = 164). d, Melzer (M = 68). e, Breiter Luzin (M = 89). f, Fuchskuhle (M = 355). Blue points represent the dissimilarity–overlap values of sample pairs from the same lake. The DOCs of real samples from each lake and that from the corresponding randomized samples are calculated using robust LOWESS and shown in red and yellow, respectively. For all the six lakes, a clear negative slope is observed for the DOCs of real samples, suggesting universal or time-invariant microbial dynamics for each lake. Differences in the DOC shapes (for example, the moderate DOC slope in b, c and d, in contrast with the steep DOC in a, e and f) deserve a systematic study of those microbial ecosystems. This example clear demonstrates the applicability of DOC analysis to general microbial ecosystems, for example, soil, ocean, rizosphere/phyllosphere and fermenters.
Extended Data Figure 10 Average dissimilarity between two normalized random vectors.
Two independent vectors x, y of  elements randomly chosen from the uniform distribution
  were generated and then normalized
  and
and  . (Note that in practice all
  elements are always shared in x and y, since zeros are very unlikely.) The dissimilarity
  is then calculated using the five dissimilarity measures (DJSD, DrJSD, DBC, DYC and DnSC). Average dissimilarity and standard deviations of 1,000 pairs are shown in a1, b1, c1, d1 and e1, for the different measures. The horizontal black dashed line represents the average dissimilarity for n = 100. For all the measures here, the dissimilarity displays no n-dependence for n > 15, while DnSC is n-independent for any n > 0. Similar analysis was performed for vectors whose elements were chosen from power-law distributions
  with α = 3 (a2, b2, c2, d2 and e2) and
  with α = 2 (a3, b3, c3, d3 and e3).
Supplementary information
Supplementary Information
This file contains Supplementary Text and Data, Supplementary Tables 1-4 and additional references. (PDF 929 kb)
Supplementary Data
This zipped file contains the source code of the DOC method. (ZIP 329 kb)
Rights and permissions
About this article

Cite this article
Bashan, A., Gibson, T., Friedman, J. et al. Universality of human microbial dynamics. Nature 534, 259–262 (2016). https://doi.org/10.1038/nature18301
Received:
Accepted:
Published:
Issue Date:
DOI: https://doi.org/10.1038/nature18301
This article is cited by
-
Global diversity and biogeography of potential phytopathogenic fungi in a changing world
Nature Communications (2023)
-
Growth phase estimation for abundant bacterial populations sampled longitudinally from human stool metagenomes
Nature Communications (2023)
-
How diverse ecosystems remain stable
Nature Ecology & Evolution (2022)
-
Complexity–stability trade-off in empirical microbial ecosystems
Nature Ecology & Evolution (2022)
-
Repeated introduction of micropollutants enhances microbial succession despite stable degradation patterns
ISME Communications (2022)
Comments
By submitting a comment you agree to abide by our Terms and Community Guidelines. If you find something abusive or that does not comply with our terms or guidelines please flag it as inappropriate.
