
Abstract
Purpose: Segregation and interchromosomal effect studies have been performed in reciprocal translocation carriers by sperm-fluorescent in situ hybridization reporting a great heterogeneity. The divergences have been attributed to the particular cytogenetic characteristics of each rearrangement. Nevertheless, there is no consensus in the factors that are responsible for such variability. The purpose of this study was to determine which cytogenetic features influence in the segregation and interchromosomal effect outcome.
Methods: Segregation and interchromosomal effects analyses were performed in 14 reciprocal translocation carriers, selected because they presented very different cytogenetic features regarding the tetravalent pairing geometry. In each segregation study, a customized combination of probes was used to identify all the segregation products. In the interchromosomal effect study, we used a triple-color fluorescent in situ hybridization for chromosomes X, Y, and 18.
Results: A preferential segregation pattern with a gradually decreasing production of Alternate, Adjacent I, Adjacent II, and 3:1 segregation was observed in the segregation analysis. Some specific features have been observed to influence this distribution: size of the translocated and centric segments and the presence of centromeres from acrocentric chromosomes in the center of the cross. Aneuploidy/diploidy screening revealed increased frequencies of numerical anomalies in seven carriers.
Conclusions: Our data suggest that reciprocal translocations display a more homogeneous behavior than described in the literature. The interchromosomal effects represent an additional source of imbalances in these carriers.
Main
Reciprocal translocations are one of the most common structural chromosome reorganizations in humans, with an incidence of approximately 0.14% in newborn.1 In these rearrangements, usually two chromosomes are involved, each one of them having a breakpoint which generates two distal segments that are interchanged.
The numerous possibilities of breakpoints and chromosomes that can be combined give rise to the formation of almost singular reorganizations, although it has been seen that not all of the bands are equally involved,2 and some specific characteristics can promote the occurrence of reciprocal translocations with a higher recurrence.3–5
In reciprocal translocations, the two derivative chromosomes produced as a consequence of the interchange of the distal segments are partly homologous to the respective original partner and partly to the donor chromosome. During meiosis, both derivative chromosomes plus their respective normal homologues can pair, forming a structure called “tetravalent,” which allows complete homosynapsis among the chromosomes involved. In the absence of interstitial chiasmata within this structure, the balanced delivering of the chromosomes in the daughter cells would only be accomplished by the occurrence of an Alternate segregation (the two normal chromosomes to one pole and the derivatives to the other), whereas any other segregation mode would lead to the production of unbalanced gametes.
Sperm segregation studies published in the literature (approximately 70 reciprocal translocation carriers) report ranges of normal/balanced gametes from 19 to 81%.6 According to such variability, it has been assumed that the proportion of normal/balanced gametes produced is specific in each case.7 The main variables proposed to influence the segregation behavior of reciprocal translocations are the length of the translocated and interstitial segments, the position of the centromere, and the presence/absence of heterochromatic regions.8 Altogether, these are the major factors that affect the distribution and frequency of chiasmata within the tetravalent. Variations in any of these aspects could somehow influence the way of delivering the four chromosomes involved in the tetravalent, and thus determine the different patterns of segregation that have been observed in reciprocal translocation carriers.
In this way, the reproductive competence of these carriers and the risk of transmitting chromosome abnormalities to the offspring will also be greatly related to these features. The reduced fertility of these patients is the reason that most of them seek reproductive advice. The understanding of the behavior of these rearrangements and the features that can influence the production of normal/balanced gametes in these patients is of substantial importance for their clinical guidance.
In this work, sperm fluorescent in situ hybridization (FISH) studies have been performed on 14 reciprocal translocations carriers to evaluate the segregation behavior of their respective rearrangements. This population represents the largest series of reciprocal translocations analyzed so far in the same laboratory. These 14 cases were selected from a larger population of reciprocal translocation carriers recruited in our laboratory because they presented very different cytogenetic characteristics. This selection was performed with the aim of including as much variability as possible in the population analyzed, and thus to reflect any existent variation in the segregation patterns displayed. The results obtained have been statistically analyzed and then discussed according to the cytogenetic features of the rearrangements.
An aneuploidy screening for chromosomes 18, X, and Y was also performed in the sperm samples of these carriers. This study was focused on shedding more light on the controversial existence of an interchromosomal effect (ICE),9 a phenomenon that has been described to be a consequence of interferences produced by the rearrangements in the segregation of other chromosome pairs. These chromosomes were selected on the basis of a significant number of meiotic studies in humans, which have demonstrated the preferential association of the sex vesicle with the chromosome involved in the reorganization. These associations have been proposed by some authors as the prime cause of ICE.10–16 In this sense, the wide range of reciprocal translocations analyzed with their different configurations allows for an extensive vision of the distribution of this effect.
MATERIALS AND METHODS
Patients
This study was carried out on 14 reciprocal translocation carriers who sought advice for infertility (Table 1). This population was formed by including the cases recruited in our laboratory, which brought more heterogeneity to the group regarding the cytogenetic characteristics of the rearrangement. Among them are cases with fairly symmetric tetravalents (P1, P2, P3, and P4), cases with a very small translocated segment (P5, P6, P7, and P8), cases with both translocated segments being very small (P9, P10, and P11), and cases with one of the translocated segments and one of the nontranslocated segments being very small (P12, P13, and P14). Partial data from Cases P3, P12, and P13 have already been published.17,18
The age range of the patients was 22–54 years and their seminal parameters were established according to the criteria of the World Health Organization19 (Table 1).
Patients gave their informed consent in writing to participate in the study, and the protocol used was approved by our Institutional Ethics Committee.
Semen sample processing
Sperm samples were fixed in methanol:acetic acid (3:1), and sperm nuclei were decondensed by slide incubation in 5 mM dithiothreitol as detailed elsewhere.20
Fluorescent in situ hybridization
As detailed in Table 2, specific combinations of three or four probes were used in the segregation study to identify the segregation products of each reciprocal translocation (Table 2).
In all patients, the occurrence of ICEs for chromosomes 18, X, and Y was also evaluated by a triple-color FISH approach (CEP18, D18Z1, Spectrum Aqua/CEPX, DXZ1, Spectrum Green/CEPY, DYZ3, Spectrum Orange; Vysis Inc., Downers Grove, IL).
The protocol for probes and sample denaturation, incubation, and detection was standardized in our laboratory in accordance to the manufacturer's instructions (Vysis Inc.; Qbiogene, Inc., Irvine, CA).
Between 600 and 10,000 spermatozoa per patient were analyzed for the segregation study (Table 3) and 3,000 and 10,000 for the ICE evaluation (Table 4). Analyses were done using an Olympus BX60 epifluorescence microscope equipped with filter sets for fluorescein isothiocyanate, Texas Red, Aqua and 4′,6- diamidino-2-phenylindole/Texas Red/fluorescein isothiocyanate using standard assessment criteria.21
Statistical analysis
Data obtained were statistically analyzed using SPSS 13.0 (SPSS Inc., Chicago, IL) under the advice of the Statistical Service of the Universitat Autònoma de Barcelona. A Hierarchical Conglomerates analysis was used to group the cases according to the similarity of the segregation patterns displayed. The nonparametric Mann-Whitney U test was used to evaluate the existence of significant differences in the production of the diverse segregants between the main groups.
Percentages of Adjacent I and Adjacent II segregants were statistically analyzed in relation to the length of translocated and centric segments, respectively, using the Pearson correlation coefficient. Differences between individuals with large centric segments and short centric segments regarding their production of Adjacent II segregants were evaluated using the Mann-Whitney U test.
The frequencies of aneuploidies detected in the ICE study were compared with control values using a χ2 test. This control population was previously analyzed in our laboratory using the same protocol and scoring criteria.22 Different parameters that could be related to a possible promotion of those aneuploidies in the analyzed population were evaluated: seminogram, chromosomes involved in the rearrangement, and age of the patients. A Pearson correlation coefficient was used to evaluate this last factor, and results were considered statistically significant when P < 0.05.
RESULTS
Data obtained in the segregation analysis of the 14 reciprocal translocations (Table 3) showed a main occurrence of the Alternate segregation mode with a production of normal/balanced gametes ranging from 37.1 to 61.8%, with an average ±SD of 46.4 ±6.5. Regarding the production of unbalanced gametes, the Adjacent I segregation mode was the most frequent (range 21.8–38.3%) with an average ±SD of 33.6 ±4.4, followed by Adjacent II (range 0.2–25.4%, with an average ±SD of 11.7 ±6.9) and finally, the 3:1 segregation mode (range 2.3–13.6%, with an average ±SD of 6.8 ±3.5). In the segregation study, the methodological approach did not allow us to differentiate between 4:0 segregations and diploid spermatozoa, which accounted for 0–1.9%.
In the statistical processing of data, the percentages obtained from each individual for these four segregation modes were evaluated using an Analysis of Hierarchical Conglomerates that established different groups. The classification obtained has been presented in a dendrogram (Fig. 1) that allows one to easily see the clusters formed. In this diagram, the cases are grouped at a certain distance level that goes from 0 (maximum similarity) to 25 (less correspondence). As we can see in Figure 1, most of the individuals appeared grouped in a major cluster (Cluster 1) at a distance = 10, which indicated a considerable resemblance among them. At the same time, this group contained two smaller clusters:

Dendrogram obtained in the hierarchical cluster analysis using the ward method.
-
Cluster 1.1 (Fig. 1) included Cases P3, P4, P7, and P6, which were characterized by having a high production of Alternate segregation gametes closely followed by Adjacent I with averages ±SDs of 44.9 ±2.5 and 36.5 ±1.9, respectively (Fig. 2). The production of Adjacent II was small and similar to the 3:1 segregation gametes (approximately 8%).
Fig 2 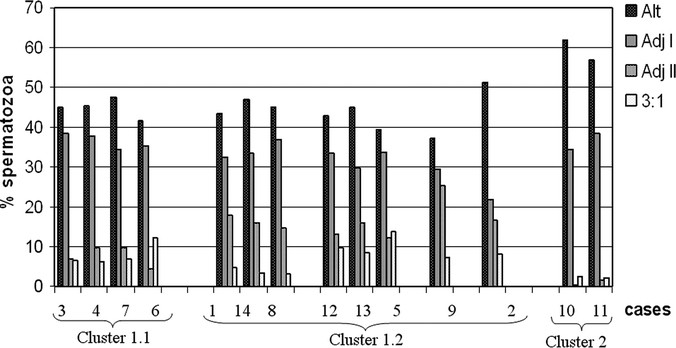
Graphic representation of the segregation patterns obtained and grouped according to the hierarchical cluster analysis.
-
Cluster 1.2 (Fig. 1) comprised the major part of the individuals (P1, P2, P5, P8, P9, P12, P13, and P14). Compared with Cluster 1.1, these individuals presented an increased Adjacent II segregation mode describing a more staggered distribution of all the segregation modes. Within this group, these individuals were distributed as follows:
-
Cases P1, P14, and P8 were grouped together (Cluster 1.2.1; Fig. 1) and showed a reduced 3:1 segregation mode (average ±SD = 3.8 ±0.8), which was noticeably distant to their respective Adjacent II segregation mode (average ±SD = 16.1 ±1.6) (Fig. 2). The remaining segregation modes were similar to those observed in Cluster 1.1 (average ±SD of 45.1 ±1.6 for Alternate segregation and 34.3 ±2.5 for Adjacent I segregation).
-
Cases P12, P13, and P5 (Cluster 1.2.2; Fig. 1) were characterized by having a close production of Adjacent II and 3:1 segregants (Fig. 2), but with higher percentages than Cluster 1.1 (13.8 ±1.2 and 10.7 ±2.6, respectively).
-
And, finally, Cases P2 and P9 were classified separately. Case P2 because of its high proportion of Adjacent II segregation products (25.4%) and Case P9 because of its low proportion of Adjacent I segregation products (21.8%).
-

Apart from this major group, another cluster was created at a very distant level (distance = 25) which included the individuals P10 and P11 (Cluster 2; Fig. 1). The principal features that made these two cases so distinct from the rest were the nearly total absence of products resulting from Adjacent II and 3:1 segregation. Regarding the rest of the segregation modes, these two cases showed a significantly increased production of Alternate segregation gametes when compared with the rest of the reciprocal translocation carriers analyzed (P < 0.028; Mann-Whitney U test), whereas Adjacent I segregation gametes presented similar frequencies (P = 0.201; Mann-Whitney U test).
To better ascertain the occurrence of Adjacent I and Adjacent II segregations in the different cases, the percentages obtained for these two segregation modes were correlated with the length of the shortest translocated segment of the translocation and the length of the shortest centric segment, respectively (Pearsons correlation coefficient). A statistically significant correlation was found in the first case (R = −0.575; P = 0.0313) (Fig. 3) but not in the other (R = 0.438; P = 0.117) (Fig. 4). Nevertheless, in this last case, a clear tendency of the individuals with shorter centric segments to produce higher amounts of Adjacent II segregants was observed in the descriptive statistics (Fig. 4), whereas individuals with large centric segments appeared to produce lower Adjacent II segregants. The dissimilarity between these two groups was analyzed using the nonparametrical Mann-Whitney U test, and significant differences were obtained for both parameters: the production of Adjacent II segregants (Z = −2.969; P = 0.003) and the length of the centric segment (Z = −3.102; P = 0.002).

Representation of the Pearson correlation between the size of the shortest translocated segment of the 14 individuals and their production of gametes with an Adjacent I content.

Representation of the Pearson correlation between the size of the shortest centric segment of the 14 individuals and their production of gametes with Adjacent II content. Individuals represented by a white dot (○) display significant differences for the production of Adjacent II segregants (Z = −2.969, Mann-Whitney U test; P = 0.003) and the length of the centric segment (Z = −3.102, Mann-Whitney U test; P = 0.002), with respect to individuals represented by a black dot (•).
Concerning the evaluation of the ICE, 7 of the 14 cases showed statistically significant increases in the aneuploid frequencies obtained for some of the chromosomes analyzed when compared with the control population (P < 0.05)22 (Table 4): Cases P2, P3, P6, P7, P11, and P13 presented increased sex-chromosome disomies. Moreover, Cases P2 and P6 also presented an increased frequency of chromosome 18 disomies. Diploidy rates did not seem to be significantly different from the percentages of spermatozoa scored as diploid/4:0 in the segregation study, thus indicating a low or null occurrence of the 4:0 segregation mode. The percentages of diploid gametes seemed to be significantly increased in Cases P1, P2, P3, P6, and P11 when compared with the control population (P < 0.05).22
Regarding the evaluation of the other parameters considered of interest for the influence in the occurrence of aneuploidies, we could not find any preference in the distribution of the seminal parameters among the individuals who presented a positive ICE (the seminograms of those individuals varied from normozoospermia to oligoasthenoteratozoospermia; Table 1). The chromosomes involved in the rearrangements associated to a positive ICE included all kinds of morphological variables (metacentrics, submetacentrics, acrocentrics). And, we could not find a statistical correlation between the percentages of aneuploidies and the age of the individuals analyzed (P = 0.336).
DISCUSSION
General behavior
Segregation patterns displayed by reciprocal translocations show a great complexity because of the numerous segregation products that can be generated. However, these products are mostly distributed among four segregation modes, which can display variable frequencies.
In the 14 cases presented in this study, a clear prevalence of the Alternate segregation mode was observed, closely followed by Adjacent I segregation. This pattern is in agreement with the cytogenetic behavior classically associated with reciprocal translocations,23 which describes an enhanced tendency of homologous centromeres to migrate to opposite poles. This behavior has also been observed in most of the previously published sperm FISH segregation studies performed in reciprocal translocation carriers.6,18,24–28
From a cytogenetic point of view, the distribution of the chromosomes by Adjacent II segregation can be considered equivalent to what happens in a nondisjunction (the homologous centromeres involved in the tetravalent segregate to the same pole). For this reason, this segregation mode has been classically considered to be more unlikely than the previous ones. Nevertheless, in the literature, Escudero et al.29 and Brugnon et al.24 described frequencies of Adjacent II higher than Alternate or Adjacent I. Those same studies together with Martini et al.,30 Rives et al.,31 Van Assche et al.,32 Estop et al.,33 and Geneix et al.,34 also described high frequencies of 3:1 segregation products, a kind of segregation which in our population seemed to be the least frequent. Regarding that point, we think that it is important to note that segregation studies in reciprocal translocation carriers involve a greatly complicated methodological approach which, as has been discussed elsewhere,35 can result in an overestimation of some specific types of unbalanced gametes. For this reason, we must be very cautious in the interpretation of the results obtained in reciprocal translocation segregation studies as it is very difficult to rule out the possibility that such unusual segregation patterns with such high rater of gametes with a combination of few signals do not involve misinterpreted hybridization failures.
Cytogenetic features predisposing segregation
In our population, despite the fact that most of the analyzed individuals displayed a general tendency of behaving according to the classical pattern described, the statistical analysis of the data obtained for all of the segregation patterns revealed the existence of slight variations in the previously pointed-out scaled distribution of the four segregation modes (Fig. 2). Within Cluster 1, the differences among the subclusters could not be associated with any of the cytogenetic features of the individuals that formed each group, neither when we looked at the symmetry of the cross nor when we analyzed the sizes of the translocated and nontranslocated segments. The position of the centromeres and, thus, the size of the interstitial segments were also very different within the groups, but we could not find a preferential implication of specific chromosomes or heterochromatic blocks in the different groups. Still we cannot discard the fact that a potential interindividual variation in the occurrence and distribution of recombination events36–39 could influence this differential behavior.
However, the individuals included in Cluster 2 (P10 and P11) who displayed a much different segregation behavior compared with Cluster 1 (increased frequencies of Alternate and Adjacent I gametes to the detriment of Adjacent II and 3:1 segregation) were carriers of a kind of reciprocal translocation that shared very similar features: very short translocated segments (according to the Généthon map, 0 cM for the shortest translocated segment in both cases and <50 cM for the largest translocated segment) and the presence of centromeric heterochromatin in the center of the cross (see idiograms in Table 1). These specific cytogenetic characteristics would have a negative influence on recombination because they would make difficult the occurrence of chiasmata in the translocated segments and in the central region of the cross (pericentromeric region). Without recombination in those regions, no structures would maintain the four chromosomes paired after Prophase I,40 and the chromosomes would reach the Metaphase I plate as two independent bivalents. This atypical circumstance would explain the observed segregation outcome of the two translocations: each one of the two bivalents would behave independently at Anaphase I and, thus, the segregation products generated would be equivalent to those obtained by either an Alternate or an Adjacent I segregation mode (Adjacent II and 3:1 segregation would imply the occurrence of a double nondisjunction and a single nondisjunction event, respectively).
Nevertheless, the formation of a “standard” tetravalent by these two singular reciprocal translocations cannot always be discarded. In the case that the largest translocated segments would also host a chiasma, the four chromosomes would display a zigzag-chain configuration. In this situation, we would expect a prevalent Alternate segregation as well, followed by Adjacent I and then, Adjacent II and 3:1 segregation. That could explain the small number of sperm detected with an Adjacent II and 3:1 content.
Even though the tetravalent configuration of Cases P10 and P11 is not very usual, another reciprocal translocation with those same cytogenetic features has been reported in the literature.24 This carrier, with karyotype 46,XY,t(2;22)(q33;p11), displayed a segregation pattern very similar to that observed in Cases P10 and P11 (53.9% Alternate; 43.8% Adjacent I; 0.3% Adjacent II; 2% 3:1 segregation), concurring with the possible influence of the cytogenetic features mentioned in the described behavior.
Among the other reciprocal translocation carriers analyzed herein, the Case P9 also presented small translocated segments (39 and 18 cM) but none of these segments were as short as in Cases P10 and P11. This case did not present a centromere in the central region of the cross either. For these reasons, a prevalent formation of a complete tetravalent by this rearrangement could be expected, which would segregate in a similar way to that observed in the other reciprocal translocation carriers.
Besides the implication of the cytogenetic features described for Cases P10 and P11, other characteristics have been previously proposed by some authors to have a direct influence on the meiotic behavior of the chromosomes involved in a reciprocal translocation. Faraut et al.41 described a predisposition for the Adjacent I segregation mode in those cases with short translocated segments. We analyzed this parameter in our population, and we also found a statistically significant correlation between the percentages of Adjacent I segregation products and the lengths (cM) of the shortest translocated segment (Fig. 3).
Notwithstanding, Faraut et al.41 also presented a significant correlation between the presence of short centric segments and the production of gametes with an Adjacent II content, but this correlation was not statistically significant in our population (Fig. 4). Nevertheless, two groups of individuals with a clearly different behavior were observed: those cases with one of the centric segments shorter than 90 cM presented a production of Adjacent II segregants between 13 and 25% (individuals represented by a white dot; Fig. 4) whereas those with larger centric segments (>90 cM) had a lower production of this segregation mode (0–15%) (individuals represented by a black dot; Fig. 4).
Interchromosomal effect
Regarding the evaluation of ICE in our population, 7 of the 14 cases (50%) presented increased frequencies of aneuploidies and/or diploidies for the analyzed chromosomes. To further delve into the occurrence of this phenomenon, other factors that could be associated with those increases were analyzed:
-
Concerning the morphological features of the chromosomes involved in the rearrangements, we considered those aspects that could interfere with the synaptic process. First, the influence of acrocentric chromosomes was discarded, as they were equally involved in the cases with a positive ICE and with a negative ICE. However, asymmetric tetravalents did not present a preferential predisposition in causing aneuploid increases. And, finally, chromosomes with large blocs of heterochromatin (i.e., 1, 9, and 16) were present in carriers with manifested ICE and in carriers without ICE.
-
Alternatively, the presence of abnormal seminal parameters was also considered because an association between low semen quality and increased tax of aneuploid sperm has been described.31,42–44 In this sense, a recent study (Sarrate et al., unpublished results) has revealed a 14% incidence of this phenomenon in individuals with altered seminal parameters and a normal karyotype. Nevertheless, in the population of reciprocal translocation carriers analyzed in this work, the frequency of cases with increased percentages of aneuploidies rose to 50%. Such a difference could only be explained by the existence of other sources than the ones existing in a general infertile population.35
-
And, eventually, the influence of age in the production of aneuploid gametes was also evaluated. Some previously published works described an increasing production of gametes with numerical abnormalities according to the age of the individuals, whereas others have not.45 Although limited because of the sample size and the range of ages of the males studies, we did not find a statistical correlation between the percentages of aneuploidies and diploidies observed and the age of the patients, suggesting that this parameter was not determinant in the ICE results.
Altogether, and despite the divergences of opinion about the origin of such aneuploidies in structural reorganization carriers, it seems to be very plausible that this kind of reorganization has a direct influence in the production of additional numerical abnormalities for other chromosomes than those involved in the rearrangement. The distribution of this phenomenon among reciprocal translocation carriers seems to be random. And the chromosomes that might be affected could be others than those analyzed in this work because other studies report significant increases for chromosomes 1, 15, 16, and 21.18,25,27,46,47
To conclude, from the results obtained in the reciprocal translocation analyzed, we can observe a preferential segregation pattern with a gradually decreasing production of Alternate, Adjacent I, Adjacent II, and 3:1 segregation. This is especially important when considering that the population analyzed was created by selecting those reciprocal translocation carriers that included more variability in the sample regarding the configuration of the rearrangements. Consequently, it would be plausible that those cases with cytogenetic resemblances to the ranges described would also display similar segregation patterns than those observed.
Still, it seems that some specific cytogenetic features can influence the segregation behavior of reciprocal translocations, modifying this pattern (the shortness of the translocated segments could promote Adjacent I segregation which, combined with the location of centromeres in the center of the tetravalent, could result in a drastic reduction of Adjacent II and 3:1 segregation). In this sense, and according to the observation of singular models of behavior among reciprocal translocations, segregation studies with an elaborate, strict scoring criterion in large series of reciprocal translocations that bring more heterogeneity than the recruited in this study could help to clarify the remaining unknown factors about the cytogenetic behavior of these reorganizations.
References
Nielsen J, Wohlert M . Chromosome abnormalities found among 34,910 newborn children: results from a 13-year incidence study in Arhus, Denmark. Hum Genet 1991; 87: 81–83.
Benn PA, Benn MJ . Recurrent breakpoints in balanced autosomal translocations in man. Proceedings of the 54th Annual Meeting of the American Society of Human Genetics. 2004 865/F863: 173.
Kurahashi H, Shaikh T, Takata M, Toda T, Emanuel BS . The constitutional t(17;22): another translocation mediated by palindromic AT-rich repeats. Am J Hum Genet 2003; 72: 733–738.
Kato T, Inagaki H, Yamada K, et al. Genetic variation affects de novo translocation frequency. Science 2006; 311: 971
Kurahashi H, Shaikh TH, Hu P, Roe BA, Emanuel BS, Budarf ML . Regions of genomic instability on 22q11 and 11q23 as the etiology for the recurrent constitutional t(11;22). Hum Mol Genet 2000; 9: 1665–1670.
Benet J, Oliver-Bonet M, Cifuentes P, Templado C, Navarro J . Segregation of chromosomes in sperm of reciprocal translocation carriers: a review. Cytogenet Genome Res 2005; 111: 281–290.
Shi Q, Martin RH . Aneuploidy in human spermatozoa: FISH analysis in men with constitutional chromosomal abnormalities, and in infertile men. Reproduction 2001; 121: 655–666.
Jalbert P, Sele B, Jalbert H . Reciprocal translocations: a way to predict the mode of imbalanced segregation by pachytene-diagram drawing. Hum Genet 1980; 55: 209–222.
Lejeune J Autosomal disorders. Pediatrics 1963; 32: 326–337.
Luciani JM, Guichaoua MR, Mattei A, Morazzani MR . Pachytene analysis of a man with a 13q;14q translocation and infertility. Behavior of the trivalent and nonrandom association with the sex vesicle. Cytogenet Cell Genet 1984; 38: 14–22.
Gabriel-Robez O, Ratomponirina C, Dutrillaux B, Carre-Pigeon F, Rumpler Y . Meiotic association between the XY chromosomes and the autosomal quadrivalent of a reciprocal translocation in two infertile men, 46,XY,t(19;22) and 46,XY,t(17;21). Cytogenet Cell Genet 1986; 43: 154–160.
Saadallah N, Hulten M . EM investigations of surface spread synaptonemal complexes in a human male carrier of a pericentric inversion inv(13)(p12q14): the role of heterosynapsis for spermatocyte survival. Ann Hum Genet 1986; 50( pt 4): 369–383.
Vidal F, Navarro J, Templado C, Egozcue J . Synaptonemal complex studies in the male. Hum Reprod 1987; 2: 577–581.
Batanian J, Hulten MA . Electron microscopic investigations of synaptonemal complexes in an infertile human male carrier of a pericentric inversion inv(1)(p32q42). Regular loop formation but defective synapsis including a possible interchromosomal effect. Hum Genet 1987; 76: 81–89.
Guichaoua MR, Quack B, Speed RM, Noel B, Chandley AC, Luciani JM . Infertility in human males with autosomal translocations: meiotic study of a 14;22 Robertsonian translocation. Hum Genet 1990; 86: 162–166.
Navarro J, Vidal F, Benet J, Templado C, Marina S, Egozcue J . XY-trivalent association and synaptic anomalies in a male carrier of a Robertsonian t(13;14) translocation. Hum Reprod 1991; 6: 376–381.
Blanco J, Egozcue J, Clusellas N, Vidal F . FISH on sperm heads allows the analysis of chromosome segregation and interchromosomal effects in carriers of structural rearrangements: results in a translocation carrier, t(5;8)(q33;q13). Cytogenet Cell Genet 1998; 83: 275–280.
Anton E, Vidal F, Egozcue J, Blanco J . Preferential alternate segregation in the common t(11;22)(q23;q11) reciprocal translocation: sperm FISH analysis in two brothers. Reprod Biomed Online 2004; 9: 637–644.
World Health Organization WHO laboratory manual for the examination of human semen and semen-cervical mucus interaction. 4th ed. Cambridge, UK: Cambridge University Press 1999.
Vidal F, Moragas M, Catala V, et al. Sephadex filtration and human serum albumin gradients do not select spermatozoa by sex chromosome: a fluorescent in-situ hybridization study. Hum Reprod 1993; 8: 1740–1743.
Blanco J, Egozcue J, Vidal F . Incidence of chromosome 21 disomy in human spermatozoa as determined by fluorescent in-situ hybridization. Hum Reprod 1996; 11: 722–726.
Blanco J, Rubio C, Simon C, Egozcue J, Vidal F . Increased incidence of disomic sperm nuclei in a 47,XYY male assessed by fluorescent in situ hybridization (FISH). Hum Genet 1997; 99: 413–416.
Sybenga J . General cytogenetics. Amsterdam, The Netherlands: North-Holland Publishing Company 1975.
Brugnon F, Van Assche E, Verheyen G, et al. Study of two markers of apoptosis and meiotic segregation in ejaculated sperm of chromosomal translocation carrier patients. Hum Reprod 2006; 21: 685–693.
Midro AT, Wiland E, Panasiuk B, Lesniewicz R, Kurpisz M . Risk evaluation of carriers with chromosome reciprocal translocation t(7;13)(q34;q13) and concomitant meiotic segregation analyzed by FISH on ejaculated spermatozoa. Am J Med Genet A 2006; 140: 245–256.
Yakut T, Ercelen N, Acar H, Kimya Y, Egeli U . Meiotic segregation analysis of reciprocal translocations both in sperms and blastomeres. Am J Med Genet A 2006; 140: 1074–1082.
Kekesi A, Erdei E, Torok M, Dravucz S, Toth A . Segregation of chromosomes in spermatozoa of four Hungarian translocation carriers. Fertil Steril 2007; 88: 212 e5–11.
Nishikawa N, Sato T, Suzumori N, Sonta S, Suzumori K . Meiotic segregation analysis in male translocation carriers by using fluorescent in situ hybridization. Int J Androl 2008; 31: 60–66.
Escudero T, Abdelhadi I, Sandalinas M, Munne S . Predictive value of sperm fluorescence in situ hybridization analysis on the outcome of preimplantation genetic diagnosis for translocations. Fertil Steril 2003; 79: 1528–1534.
Martini E, von Bergh AR, Coonen E, et al. Detection of structural abnormalities in spermatozoa of a translocation carrier t(3;11)(q27.3;q24.3) by triple FISH. Hum Genet 1998; 102: 157–165.
Rives N, Jarnot M, Mousset-Simeon N, Joly G, Mace B . Fluorescence in situ hybridisation (FISH) analysis of chromosome segregation and interchromosomal effect in spermatozoa of a reciprocal translocation t(9,10)(q11;p11.1) carrier. J Hum Genet 2003; 48: 535–540.
Van Assche E, Staessen C, Vegetti W, et al. Preimplantation genetic diagnosis and sperm analysis by fluorescence in-situ hybridization for the most common reciprocal translocation t(11;22). Mol Hum Reprod 1999; 5: 682–690.
Estop AM, Cieply KM, Munne S, Feingold E . Multicolor fluorescence in situ hybridization analysis of the spermatozoa of a male heterozygous for a reciprocal translocation t(11;22)(q23;q11). Hum Genet 1999; 104: 412–417.
Geneix A, Schubert B, Force A, Rodet K, Briancon G, Boucher D . Sperm analysis by FISH in a case of t(17; 22)(q11; q12) balanced translocation: case report. Hum Reprod 2002; 17: 325–331.
Anton E, Vidal F, Blanco J . Role of sperm FISH studies in the genetic reproductive advice of structural reorganization carriers. Hum Reprod 2007; 22: 2088–2092.
Hassold T, Judis L, Chan ER, Schwartz S, Seftel A, Lynn A . Cytological studies of meiotic recombination in human males. Cytogenet Genome Res 2004; 107: 249–255.
Codina-Pascual M, Campillo M, Kraus J, et al. Crossover frequency and synaptonemal complex length: their variability and effects on human male meiosis. Mol Hum Reprod 2006; 12: 123–133.
Codina-Pascual M, Oliver-Bonet M, Navarro J, et al. Synapsis and meiotic recombination analyses: MLH1 focus in the XY pair as an indicator. Hum Reprod 2005; 20: 2133–2139.
Sun F, Trpkov K, Rademaker A, Ko E, Martin RH . Variation in meiotic recombination frequencies among human males. Hum Genet 2005; 116: 172–178.
Petronczki M, Siomos MF, Nasmyth K . Un menage a quatre: the molecular biology of chromosome segregation in meiosis. Cell 2003; 112: 423–440.
Faraut T, Mermet MA, Demongeot J, Cohen O . Cooperation of selection and meiotic mechanisms in the production of imbalances in reciprocal translocations. Cytogenet Cell Genet 2000; 88: 15–21.
Miharu N . Chromosome abnormalities in sperm from infertile men with normal somatic karyotypes: oligozoospermia. Cytogenet Genome Res 2005; 111: 347–351.
Machev N, Gosset P, Viville S . Chromosome abnormalities in sperm from infertile men with normal somatic karyotypes: teratozoospermia. Cytogenet Genome Res 2005; 111: 352–357.
Burrello N, Vicari E, Calogero AE . Chromosome abnormalities in spermatozoa of patients with azoospermia and normal somatic karyotype. Cytogenet Genome Res 2005; 111: 363–365.
Buwe A, Guttenbach M, Schmid M . Effect of paternal age on the frequency of cytogenetic abnormalities in human spermatozoa. Cytogenet Genome Res 2005; 111: 213–228.
Douet-Guilbert N, Bris MJ, Amice V, et al. Interchromosomal effect in sperm of males with translocations: report of 6 cases and review of the literature. Int J Androl 2005; 28: 372–379.
Machev N, Gosset P, Warter S, Treger M, Schillinger M, Viville S . Fluorescence in situ hybridization sperm analysis of six translocation carriers provides evidence of an interchromosomal effect. Fertil Steril 2005; 84: 365–373.
Acknowledgements
This work was funded by the Project 2005SGR-00437 (Agència de Gestió d'Ajuts Universitaris i de Recerca de la Generalitat de Catalunya, Spain) and Project 180034 (Universitat Autònoma de Barcelona, Spain). E.A. was the recipient of an FI/FIAP grant (2001FI/00457, Direcció General de Recerca de la Generalitat de Catalunya, Spain).
We thank Mercedes Campillo for her assistance in the data analysis.
Author information
Authors and Affiliations
Corresponding author
Additional information
Disclosure: The authors declare no conflict of interest.
A supplementary figure is available via the ArticlePlus feature at www.geneticsinmedicine.org. Please go to the October issue and click on the ArticlePlus link posted with the article in the Table of Contents to view this material.
Rights and permissions
About this article
Cite this article
Anton, E., Vidal, F. & Blanco, J. Reciprocal translocations: tracing their meiotic behavior. Genet Med 10, 730–738 (2008). https://doi.org/10.1097/GIM.0b013e318187760f
Received:
Accepted:
Issue Date:
DOI: https://doi.org/10.1097/GIM.0b013e318187760f
Keywords
This article is cited by
-
Conventional ICSI improves the euploid embryo rate in male reciprocal translocation carriers
Journal of Assisted Reproduction and Genetics (2021)
-
Analysis of meiotic segregation modes in biopsied blastocysts from preimplantation genetic testing cycles of reciprocal translocations
Molecular Cytogenetics (2019)
-
A report of nine cases and review of the literature of infertile men carrying balanced translocations involving chromosome 5
Molecular Cytogenetics (2018)
-
Preliminary analysis of numerical chromosome abnormalities in reciprocal and Robertsonian translocation preimplantation genetic diagnosis cases with 24-chromosomal analysis with an aCGH/SNP microarray
Journal of Assisted Reproduction and Genetics (2018)
-
Reproductive outcomes following preimplantation genetic diagnosis using fluorescence in situ hybridization for 52 translocation carrier couples with a history of recurrent pregnancy loss
Journal of Human Genetics (2016)
