
Abstract
Recent ancient DNA studies on European Neolithic human populations have provided persuasive evidence of a major migration of farmers originating from the Aegean, accompanied by sporadic hunter-gatherer admixture into early Neolithic populations, but increasing toward the Late Neolithic. In this context, ancient mitochondrial DNA data collected from the Neolithic necropolis of Gurgy (Paris Basin, France), the largest mitochondrial DNA sample obtained from a single archeological site for the Early/Middle Neolithic period, indicate little differentiation from farmers associated to both the Danubian and Mediterranean Neolithic migration routes, as well as from Western European hunter-gatherers. To test whether this pattern of differentiation could arise in a single unstructured population by genetic drift alone, we used serial coalescent simulations. We explore female effective population size parameter combinations at the time of the colonization of Europe 45000 years ago and the most recent of the Neolithic samples analyzed in this study 5900 years ago, and identify conditions under which population panmixia between hunter-gatherers/Early-Middle Neolithic farmers and Gurgy cannot be rejected. In relation to other studies on the current debate of the origins of Europeans, these results suggest increasing hunter-gatherer admixture into farmers’ group migrating farther west in Europe.
Introduction
The introduction of farming into Europe around 8600 years ago led to fundamental changes in subsistence strategy and social organization, and left signatures of population turnover.1, 2, 3, 4 It is widely believed that farming spread into Europe from the Aegean along both Mediterranean and Danubian routes.3, 5 Recent archeological6 and paleogenetic evidence1, 2, 4, 5, 7 indicate a crucial role for migration, with only sporadic hunter-gatherer (HG) admixture into early Neolithic populations, but increasing toward the Late Neolithic.1, 7, 8 However, these local inferences still permit spatiotemporal heterogeneity in HG admixture during the Neolithic in continental Europe.
In this context, the mitochondrial DNA (mtDNA) diversity of the Gurgy ‘Les Noisats’ site, located south of the Paris Basin and dated from 7000 to 6000 years ago, is striking since descriptive analyses9 indicated affinities not only with early farmers associated with both the Danubian and Mediterranean migration routes but also with European HG. Notably, a relatively lower differentiation between Gurgy and European HG (FST=0.08) was observed when compared with other published levels of differentiation between Early Neolithic farmers and HG (eg, FST=0.0923 (ref. 10); FST=0.163 (ref. 2)). This suggests complex admixture pattern between HG and farmer groups to shape Gurgy mtDNA diversity.
Previous mtDNA studies2, 10, 11 have used serial coalescent simulations to test for genetic continuity between HG, Neolithic farmers and extant DNA samples from the same geographic region, and regularly concluded in genetic discontinuity between groups. We used a similar approach to address if the observed level of mtDNA differentiation between European HG, Neolithic farmer and Gurgy groups could be obtained under a panmictic population model with various combinations of effective population sizes. Our approach differs in three major aspects from previous studies:2, 10, 11 first, we grouped the ancient mtDNA sequences according to subsistence strategy (HG or Neolithic farmers) and Neolithic context (Mediterranean/South-, Danubian/Central- or Gurgy- farmers). Some of the sample groups are consequently contemporaneous and can represent various regions. Second, we did not include modern population sample into the comparison. Third, we extended the effective population size ranges used previously2, 11 toward the lower bound to explore further demographic scenarios.
Materials and methods
We compiled 282 available ancient mtDNA HVR-I sequences (NC_012920.1:m.16024_16380; Supplementary Table S1). Following Rivollat et al. 2015, ancient mtDNA data were partitioned into four sample groups: (i) Gurgy Les Noisats necropolis (hereafter referred to as ‘Gurgy’, n=39 sequences), (ii) Neolithic farmers from south Europe (group ‘South-F’, n=56, partitioned into four chronological subgroups), (iii) Neolithic farmers from central Europe (‘Central-F’, n=147, 5 subgroups) and (iv) hunter-gatherers (‘HG’, n=40, 16 subgroups). Chronological subgroups were defined according to both shared geographic location and median calibrated C14 dates (see Figures 1 and 2). As a test statistic that measures the level of population differentiation, we calculated six pairwise FST between the four groups (Figure 3) with ARLSUMSTAT version 3.5.1.2.12

Geographic locations of the sites sampled for ancient mtDNA in the current analysis. 1 refers to the most recent sample group in the gene genealogy and 26 to the most ancient. Groups were categorized based on common median C14 dates, archeological context and geographic location; one group can consequently be sampled from more than one geographic location; for those groups with more than one location, only the location of the largest sample size group is displayed on the map (details in Figure 2 and Supplementary Table S1).
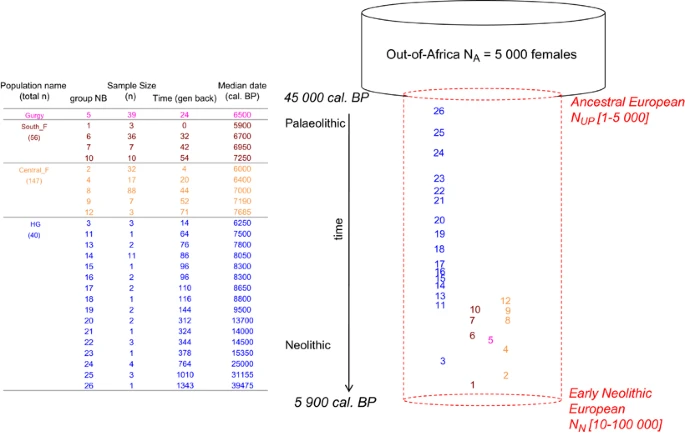
Demographic model simulated with the serial coalescent. Time is the median calibrated C14 years before present (cal BP) backward in time from ‘t0’ and expressed in generations. ‘t0’ refers to 5900 years cal. BP, the median C14 date of the youngest ancient mtDNA sample. Groups are numbered backward in time from the most recent to the most ancient. The dashed cylinder shows constant population size between NUP and NN, but the simulated population can undergo expansion or decline depending on the combinations of these parameter values.

Probability of obtaining simulated FST value greater than that observed for the six pairwise population groups compared (see text for details). Corresponding observed pairwise FST are shown in the top left corner of each grid. The 50 × 50 grids show values of assumed effective population size NN on the x-axis and values of parameterized NUP on the y-axis (note that 25 values are shown on each axis for clarity, see Supplementary Table S2). The top right area delimited by vertical and horizontal black lines outline NN and NUP ranges, respectively, used in comparable studies.2, 11 Gray shows proportions of observed FST greater than observed (proportion >0.05), for which panmixia cannot be rejected. Color-scale represents significance level from blue (proportion lower or equal to 0.05) to red (proportion close to 0). Proportions were obtained over 50 000 simulated pairwise FST per combination of NN and NUP value. A full color version of this figure is available at the European Journal of Human Genetics journal online.
Following previous studies,2, 11 we performed serial coalescent simulations under a single panmictic population model with two demographic events: an initial colonization of Europe 45 000 years ago of female effective population size NUP, followed by exponential growth or decline to the Neolithic transition in Western Europe 5900 years cal. BP of female effective population size NN. Before NUP, we assume an ancestral female effective population size NA of 5000, derived from the commonly used long-term effective human population size of 10 000 individuals outside Africa13 and assuming a 1:1 female to male ratio. We explored 50 values for NUP ranging from 1 to 5000 and 50 values for NN ranging from 10 to 100 000 (Supplementary Table S2). We generated 50 000 mitochondrial genealogies of ancient HG and farmer sequences using fastsimcoal version 2.5.1 (ref. 12) under each of the 2500 NUP–NN combinations (Supplementary Table S2). We used a fixed mutation rate of 5 × 10⁻⁶/bp/generation,15 assuming a 25 years generation time. These simulated genealogies were used to compute expected pairwise FST values for the six sample comparisons (Figure 2). We recorded the proportion of simulated FST values that were greater than those observed per FST and parameter combination (Figure 3).
We also tested if the six observed pairwise FST values as well as eight within sample group statistic values (number of segregating sites and of pairwise differences) could be recovered from simulations under this simple model by performing an approximate Bayesian computation (ABC)-related approach16 (see details in SI). We used the rejection algorithm of the ‘abc’ package17 available in R to retain the parameter combinations that generated simulated pairwise FST the closest to the six observed values. Even though we provide some effective population size estimates, we caution against over-interpretation since there is likely insufficient information in the data to make precise estimates.
Results and discussion
Analyses indicate that for the six pairwise population group comparisons, some NUP–NN combinations can result in simulated differentiation greater than the one observed (gray area on Figure 3). Notably, results show that we cannot reject the possibility that European HG, South-F, Central-F and Gurgy were sampled from a single panmictic population. Whereas these results may appear to contrast with previous studies that have used serial coalescent simulations to address local mtDNA population continuity between diachronic HG and farmers samples,2, 11 we highlight that our analyses do not address ‘population continuity’ as defined in these studies. The grouping of diachronic samples may artificially reduce the level of differentiation that would be observed in case of significant mtDNA population structure. This grouping none-the-less allows us to investigate the genetic relationships between set of lineage samples associated with specific archeological Neolithic contexts.
We confirmed that our panmictic population model generated simulated between and within population group diversity values close to the observed using an ABC-rejection algorithm (see SI and Supplementary Figure S1). The 95% credible intervals estimated from the retained simulations are (5–3500) NUP females and (200–7750) NN females. These estimates concur with the observation that the parameter space for which a panmictic population model may hold is rather narrow (Figure 3). Most NN values tested and compatible with the level of mtDNA differentiation observed are relatively low (10–200 females for the South-F and Central-F comparison, Figure 3). Noteworthy, some NUP–NN combinations imply a population decline that clearly contrasts with previous studies based on modern DNA data, which have inferred female effective population size growth in Europe during the Holocene.18 However, we were not constrained to simulate population expansion, since we did not consider modern DNA data in our analyses. Moreover, a Holocene population decline in Europe corroborates recent Y chromosome data18 and various archeological evidence support demographic fluctuation of Neolithic populations.19, 20
Our results indicate that a simple panmictic population model can account for the mtDNA differentiation observed between European HG and Early/Middle Neolithic farmers; a larger proportion of the HG–Gurgy explored parameter space failed to reject panmixia. This result suggests increasing HG admixture into farmers’ group migrating farther west in Europe. Similarly, we note that a larger proportion of the explored parameter space fails to reject panmixia when comparing Gurgy and South-F than when comparing Gurgy and Central-F. Thus, our results seem to support Gurgy as the most ancient Neolithic sample studied so far with appreciable admixture between pre-Neolithic HG and Early/Middle Neolithic farmers from both streams of Neolithization in Europe (with a suspected higher participation of Mediterranean farmers).
As with any model, the one we test here has a few assumptions that may not hold, for example, NA of female to male ratio of 1 (ref. 18) and no population structure in any of the four groups.5 Moreover, the panmictic population model proposed would need to be compared against alternatives (eg, ref. 11). Such a simple panmictic population model nevertheless lays the ground for building more complex ones.17 Notably, a serial coalescent approach coupled with ABC would allow estimation of the possible contribution of each of the three population groups (HG, Mediterranean and Central Europe farmers) in shaping Gurgy mitochondrial diversity.
References
Haak W, Lazaridis I, Patterson N et al: Massive migration from the steppe was a source for Indo-European languages in Europe. Nature 2015; 552: 207–211.
Bramanti B, Thomas MG, Haak W et al: Genetic discontinuity between local hunter-gatherers and central Europe’s first farmers. Science 2009; 326: 137–140.
Childe VG . The Dawn of European Civilization. Kegan Paul: London, 1925; 328.
Lazaridis I, Patterson N, Mittnik A et al: Ancient human genomes suggest three ancestral populations for present-day Europeans. Nature 2014; 513: 409–413.
Hofmanová Z, Kreutzer S, Hellenthal G et al: Early farmers from across Europe directly descended fron Neolithic Aegeans. Proc Natl Acad Sci 2016; 113: 6886–6891.
Bocquet-Appel J-P, Naji S, Vander Linden M, Kozlowski JK : Detection of diffusion and contact zones of early farming in Europe from the space-time distribution of 14C dates. J Archaeol Sci 2009; 36: 807–820.
Brandt G, Haak W, Adler CJ et al: Ancient DNA reveals key stages in the formation of central european mitochondrial genetic diversity. Science 2013; 342: 257–261.
Bollongino R, Nehlich O, Richards MP et al2000 Years of parallel societies in Stone Age Central Europe. Science 2013; 342: 479–481.
Rivollat M, Mendisco F, Pemonge M-H et al: When the waves of European neolithization met: first paleogenetic evidence from early farmers in the Southern Paris Basin. PLoS One 2015; 10: e0125521.
Haak W, Balanovsky O, Sanchez JJ et al: Ancient DNA from European early neolithic farmers reveals their near eastern affinities. PLoS Biol 2010; 8: e1000536.
Rasteiro R, Chikhi L : Female and male perspectives on the neolithic transition in Europe: clues from ancient and modern genetic data. PLoS One 2013; 8: e60944.
Excoffier L, Lischer HE : Arlequin suite ver 3.5: a new series of programs to perform population genetics analyses under Linux and Windows. Mol Ecol Resour 2010; 10: 564–567.
1000 Genomes Project Consortium, Abecasis GR, Altshuler D et alA map of human genome variation from population-scale sequencing: Nature 2010; 467: 1061–1073.
Excoffier L, Foll M : Fastsimcoal: a continuous-time coalescent simulator of genomic diversity under arbitrarily complex evolutionary scenarios. Bioinformatics 2011; 27: 1332–1334.
Soares P, Ermini L, Thomson N et al: Correcting for purifying selection: an improved human mitochondrial molecular clock. Am J Hum Genet 2009; 84: 740–759.
Beaumont MA, Zhang W, Balding DJ : Approximate Bayesian computation in population genetics. Genetics 2002; 162: 2025–2035.
Csilléry K, Blum MG, Gaggiotti OE, François O : Approximate Bayesian computation (ABC) in practice. Trends Ecol Evol 2010; 25: 410–418.
Karmin M, Saag L, Vicente M et al: A recent bottleneck of Y chromosome diversity coincides with a global change in culture. Genome Res 2015; 25: 459–466.
Shennan S, Downey SS, Timpson A et al: Regional population collapse followed initial agriculture booms in mid-Holocene Europe. Nat Commun 2013; 4: 2486.
Wirtz KW, Lemmen C : A global dynamic model for the Neolithic transition. Climatic Change 2003; 59: 333–367.
Acknowledgements
This work was supported by a ministerial grant from the Research National Agency as a program of prospects investments (ANR-10-LABX-52, DHP project; dir: SR; Université Bordeaux 1, LaScArBx-ANR; 2012-14; and ANR-10-IDEX-03-02 to MR for work in UCL) and a Leverhulme Programme grant to AM Migliano (UCL Anthropology) and MGT (RP2011-R-045). The authors acknowledge the use of the UCL Legion High Performance Computing Facility (Legion@UCL), and associated support services, in the completion of this work.
Author information
Authors and Affiliations
Corresponding authors
Ethics declarations
Competing interests
The authors declare no conflict of interest.
Additional information
Supplementary Information accompanies this paper on European Journal of Human Genetics website
Rights and permissions
About this article

Cite this article
Rivollat, M., Rottier, S., Couture, C. et al. Investigating mitochondrial DNA relationships in Neolithic Western Europe through serial coalescent simulations. Eur J Hum Genet 25, 388–392 (2017). https://doi.org/10.1038/ejhg.2016.180
Received:
Revised:
Accepted:
Published:
Issue Date:
DOI: https://doi.org/10.1038/ejhg.2016.180
This article is cited by
-
The ancient cline of haplogroup K implies that the Neolithic transition in Europe was mainly demic
Scientific Reports (2017)
