
Abstract
The Roma, also known as ‘Gypsies’, represent the largest and the most widespread ethnic minority of Europe. There is increasing evidence, based on linguistic, anthropological and genetic data, to suggest that they originated from the Indian subcontinent, with subsequent bottlenecks and undetermined gene flow from/to hosting populations during their diaspora. Further support comes from the presence of Indian uniparentally inherited lineages, such as mitochondrial DNA M and Y-chromosome H haplogroups, in a significant number of Roma individuals. However, the limited resolution of most genetic studies so far, together with the restriction of the samples used, have prevented the detection of other non-Indian founder lineages that might have been present in the proto-Roma population. We performed a high-resolution study of the uniparental genomes of 753 Roma and 984 non-Roma hosting European individuals. Roma groups show lower genetic diversity and high heterogeneity compared with non-Roma samples as a result of lower effective population size and extensive drift, consistent with a series of bottlenecks during their diaspora. We found a set of founder lineages, present in the Roma and virtually absent in the non-Roma, for the maternal (H7, J1b3, J1c1, M18, M35b, M5a1, U3, and X2d) and paternal (I-P259, J-M92, and J-M67) genomes. This lineage classification allows us to identify extensive gene flow from non-Roma to Roma groups, whereas the opposite pattern, although not negligible, is substantially lower (up to 6.3%). Finally, the exact haplotype matching analysis of both uniparental lineages consistently points to a Northwestern origin of the proto-Roma population within the Indian subcontinent.
Introduction
The Roma constitute one of the less documented human diaspora phenomena and an excellent model to evaluate the consequences of recent, multiple, and widespread dispersals and founder events. Social and political factors preclude the collection of precise census on the Roma, but they are acknowledged as the largest ethnic minority of Europe, with a population of up to 10 million people spread across the continent and mostly concentrated in Central and South-Eastern Europe.1, 2
Based on linguistic, cultural, anthropological, and genetic evidence, the proto-Roma population is thought to have originated on the Indian subcontinent.1, 3, 4, 5, 6, 7, 8, 9 Their migration routes probably encompassed Persia, Armenia, and the Balkans, with a large consensus on their arrival in Eastern Europe around a thousand years ago. Within a period of about two centuries, most Roma became sedentary in the Balkan Peninsula (Balkan Roma), in the relatively ethnically tolerant surroundings of the newly established Ottoman Empire.10 Some groups instead initiated a rapid migration that, by the end of the fifteenth century, had spread all across the European continent.1 Some, whose descendants are now known as Vlax Roma, moved across the Danube into the Danubian Principalities (nowadays Romania, Moldova, and parts of Hungary) where they were forced into slavery and divided into small groups. Another migration group out of the Balkan Peninsula, known as the Romungro, spread within the Austro-Hungarian Empire, where they were subject to attempts at assimilation.11 Other Roma groups continued moving in small groups into Central and Western Europe, where they were persecuted during Medieval times.1, 2 The abolition of Roma slavery in the Danubian Principalities Walachia and Moldova in the nineteenth century was followed by a mass migration, spreading the Vlax Roma into nearby countries and worldwide; most kept their endogamous rules and nomadic lifestyle.1, 3, 12 Recent Roma movements include migrations during the twentieth century triggered by the economic and political transformation of Eastern Europe.13
From a medical perspective, the genetic drift due to multiple founder events and endogamy in the Roma have increased the prevalence of Mendelian disorders caused by variants that are rare in other populations.14, 15 This complex demographic pattern might have also caused an increase of slightly deleterious variants in Roma groups as a result of a lower efficiency of purifying selection in purging deleterious alleles.16
The east-to-west genetic gradient observed in Roma populations is compatible with the postulated waves of migration within Europe.4, 7, 17, 18 All European Roma appear to descend from a low number of founders, and to have diverged into socially distinct endogamous groups after their arrival in Europe.14, 17, 18 The Indian component of the proto-Roma ancestry was supported by the identification of disease-causing mutations described in affected subjects in India and Pakistan.9, 15, 19, 20 Furthermore, the Roma show high frequencies of the H-M69 Y-chromosome4, 17, 21, 22 and mitochondrial DNA (mtDNA) M5, M18, M25, and M35 haplogroups4, 7, 17, 23, 24, 25 reported to have an Indian origin.25, 26, 27 Accordingly, studies of autosomal markers identified the Northwest of India as the most probable homeland of the European Roma.6
Despite these previous genetic studies, the Roma demographic history remains poorly understood. Y-chromosome and mtDNA lineages other than H and the M major haplogroups, respectively, have been attributed to genetic influences from populations along the proto-Roma migration way7, 21 without a more specific definition of their geographic origins. Furthermore, the small numbers and different sets of Y-STRs used in some studies, the insufficient and variable phylogenetic resolution, and the local character of the studies have prevented the reconstruction of a clear general picture.4, 22, 28, 29, 30 Moreover, studies that used a large number of markers were forced to reduce the phylogenetic resolution in order to compare with previous data.21 In addition to these limitations, the information of the Roma volunteers has been restricted to their geography tracks (ie, country of the sampling) ignoring the Roma group affiliation, which might have masked their complex population history.
To overcome these limitations, we analyzed uniparental lineages at high resolution in ~750 European Roma and ~980 non-Roma, in order to: (1) test whether there is a paternal and a maternal signature of the spread of Roma throughout Europe from the Balkan Peninsula; (2) revisit the potential role of geography and migration routes in the genetic structure of Roma; (3) determine the degree of gene flow from hosting populations to Roma and vice versa, and whether this gene flow is sex-biased; and (4) investigate the origins of the Roma ancestors within the Indian subcontinent.
Materials and methods
Sample collection
One thousand seven hundred and thirty-seven unrelated individuals self-identified as Roma (N=753) or non-Roma (N=984) were collected after the corresponding ethical approval and informed consent (Table 1). Greek Roma samples were collected in the villages of Hraklia, Nigrita, Dendropotamos, Xanthi, Volos, Sofades, and Ahaia. Greek hosts were collected from several locations in continental Greece, avoiding big cities. The Bulgarian Roma samples are a sub-sample of those in Morar et al9 and Gresham et al,17 including several Roma groups (Supplementary Table S4) that fall into two broader categories: Balkan and Vlax (Table 1). The Balkan category included the initial settlers in Bulgaria, whereas the Vlax Roma represent groups that migrated to Bulgaria from Wallachia and Moldova. Their genotyping was extended for both Y-chromosome SNPs and STRs, and the mtDNA whole control region. Bulgarian host samples were those in Martinez-Cruz et al.31 Romanian Roma were Vlax Romani speakers sampled in several villages (Garla Mare, Lipovu, Goicea, Barca, and Sadova). Romanian general population was also sampled in the southwest region of the country. Hungarian Roma were those in Pamjav et al22 and Hungarian general population was from Volgyi et al.29 Hungarian Roma included mixed Hungarian Roma from all over the country. In addition, Romungro Roma from Taktaköz and Vlax Roma from Tiszavasvári and Tokaj in Eastern Hungary were also included.22 In the case of the Hungarian general population, no ethnic origin was recorded at sampling29 and, therefore, this sample may include up to 6%–8% Roma.22 The genotyping from the Hungarian samples was extended for both Y-chromosome SNPs and STRs, and the mtDNA whole control region. Slovak Roma samples are Romungro Roma collected in three villages (Moldava nad Bodvou, Jasov, and Medzev) in Eastern Slovakia. Slovak host population was sampled in several geographical areas of Slovakia. Ukrainian Romungro Roma were collected in three localities in the Zakarpattya region (Serednye, Antonivka, and Hudolovo) and Ukrainian hosts were sampled around Lviv.31 Spanish Roma samples were collected in Barcelona7 and Madrid, and they were Spanish speakers. The Spanish host population was obtained from the Spanish National DNA Bank.
Y-chromosome data
One thousand seven hundred and thirty-two unrelated individuals from Roma (N=748) and host populations (N=984) were genotyped for 131 SNPs. A group of 121 SNPs were typed as in Martinez-Cruz et al,32 six SNPs were genotyped in a single multiplex (Multiplex-2),33 and four SNPs were typed with individual TaqMan assays (L48, M458, L2, and L20). Nomenclature of the haplogroups is in accordance with the Y-Chromosome Consortium.34 All individuals were typed for a set of 19 STRs: 17 using the Yfiler kit (Applied Biosystems, Foster City, CA, USA) and two STRs included in Multiplex-2 (Martinez-Cruz et al33 and Supplementary Table S2). Some individuals from previous studies using lower number of markers17, 22 were genotyped to the same resolution level. All individuals with complete genotypes were submitted to the Y-HRD database (accession numbers YA004094–YA004107). As the Yfiler kit amplifies DYS385a/b simultaneously, avoiding the determination of each of the two alleles (a or b), DYS385a/b were excluded from all analyses performed.
mtDNA data
One thousand three hundred and forty-one samples from Roma (N=736) and host (N=605) populations were sequenced for both hypervariable segments (HVS) I and II of the control region (positions 16 001–573; Supplementary Table S3). In addition, 22 coding region SNPs were genotyped using the multiplex GenoCoRe22.35 For 12 samples (8 Spanish and 1 Slovakian Roma, and 3 Romanian non-Roma) only HVS-I could be sequenced. All complete sequences were submitted to EMPOP data base (under the accession number EMP00671). Mitochondrial haplogroup H was subtyped with a specific multiplex.33 Based on HVS and coding SNP data, individuals were assigned to mtDNA haplogroups using Haplogrep36 and the PhyloTree build 15.37 Owing to their phylogenetic uncertainty, indels at nucleotide positions 309, 315, and 16 193 were not taken into account.
Statistical analyses
Haplogroup and haplotype diversities, mean number of pairwise differences, and haplotype frequencies were calculated with Arlequin 3.4.38 The potential role of geography and migration routes was tested through analyses of molecular variance (AMOVAs) by pooling populations into country or migration route (see Supplementary Table S4). Greek and some Hungarian Roma were not included in the AMOVA, owing to the lack of detailed information about their migrational group, and Ukrainian Roma were also excluded because of their low sample size. We used FST distances for the Y-STRs and number of pairwise differences for mtDNA sequence data.
We defined founder lineages as lineages that the Roma most probably incorporated before their spread across Europe.7 Besides those already defined in Mendizabal et al,7 we include as founder lineages those haplogroups common in Roma (with frequencies over 5%) and not present or rare (<2%) in other Europeans. This definition of founder lineages is conservative and the founder nature of the lineages was further explored by studying their internal diversity. Namely, WIMP values (weighted intralineage mean pairwise differences)39 were estimated for the Roma founding lineages. Given the lower resolution of the Y-chromosome compared with the mtDNA in the definition of founders, we also built phylogenetic networks that were computed through sequential reduced median and median joining using the NETWORK v.4610 software package40 and were weighted for intra-haplogroup variance. The STR DYS389II was excluded from network analyses, as indicated by the Network software authors.40 In order to quantify admixture, we counted the exact matches of lineages classified as Roma or non-Roma in origin (ie, founder versus non-founder), assuming that exact matches represent the minimum gene flow between populations.
Under a simple stepping stone model in which sub-populations diverge from the neighboring sub-population, one expects genetic drift to accumulate (intra-population diversity decreased and genetic distances increased) with time. We tested correlations between internal diversity through WIMP (and genetic distances through FST) and geography, taking as a proxy a geographical point related to the Roma migration routes (Plovdiv in Bulgaria for Balkan Roma, Sibiu in Romania for Vlax Roma, Mezökövesd in Hungary for Central Roma, and Zaragoza in Spain for Western Roma) and independently for founder and non-founder lineages.
We constructed a Bayesian skyline plot (BSP) for M mtDNA lineages using BEAST.41 MCMC samples were based on a run of 300 000 000 generations, sampled every 30 000, discarding the first 30 000 000 generations as burn-in. We used a constant linear function of population size change, the HKY substitution model with a gamma site heterogeneity model, and a strict clock with a mean substitution rate of 9.883E−8 substitutions/site/year.42 Results reported were based on three independent runs showing identical results, with values of effective sample sizes higher than 200 for the parameters of interest, and after the visual evaluation of the convergence of the chains in stationary distributions by using the software Tracer v.1.6.43
Indian geographic areas were tested as putative origins for Roma lineages. We used a database with a total of 641 Indian Y-chromosomes from five regions,44 excluding the Northeastern populations, of Tibeto-Burman origin, and searched for identical matches of H-M52 Roma haplotypes. Identical matches for the mtDNA M lineages were assessed by comparison with the Indian database45 as in Medizabal et al.46 The weighted proportion of Roma lineages was used to infer the probabilities of origin.
Results
Y-chromosome diversity and founder lineages
Haplotype diversity was generally low for all Roma, notably for Bulgarian Vlax, Greek, Slovakian, Ukrainian, and Romanian samples (Supplementary Table S1). Conversely, most hosting populations displayed values of haplotype diversity higher than 99.9% for the same STRs markers, in agreement with the occurrence of founder effects among Roma groups.21 Details on haplogroup composition and haplogroup sharing are shown in Supplementary Figure S1 and Supplementary Table S2.
Five paternal lineages were defined as founder in European Roma (Figure 1 and Supplementary Table S6). Up to 63% of Roma show a founder lineage, and from those 30% show founder non-H Indian lineages. More than 44% of the Roma individuals belonged to the Indian H-M52 haplogroup (including H-M82), ranging from 64% in the Balkan Peninsula to 21% in Spain (Supplementary Figure S1). In contrast, the frequency of haplogroup H was extremely low among non-Roma (1% in Bulgaria and 0.6% in Slovakia). It reached 5.3% in the non-Roma Hungarian population, although these individuals might actually be of Roma origin.22

(a) Y-chromosome and (b) mtDNA haplogroup frequencies corresponding to founder lineages in the European Roma populations. Non-founder haplogroups are grouped as ‘others’. WIMP values for the group of founder lineages are shown in brackets at the bottom of each population sample.
In addition to H-M52 and its derivate H-M82 haplogroups, three non-Indian lineages (I-P259, J-M92, and J-M67) were defined as founders (Figure 1 and Supplementary Figure S1). I-P259 is present in all Roma groups (except in Spanish Roma) and absent in our non-Roma populations (with the exception of one Hungarian). The I-P259 network showed a star-like profile with reduced internal diversity (Supplementary Figure S2B). This suggests that the mutation might have appeared in the Roma population very recently and probably once, and spread due to drift. The founder lineages J-M92 and J-M67 are present in both Roma and hosts, as well as in the populations found in the Roma migration way out-of-India.47 Both lineages showed a star-like pattern in Roma with the exception of some individuals. Interestingly, the haplotypes within the star-like cluster were absent in the hosts, with the exception, again, of one Hungarian for J-M92 and one for J-M67 (Supplementary Figure S2). As these haplogroups were present in Europe far before the arrival of Roma,47 not all individuals carrying these lineages might be considered signals of gene flow between Roma and their hosts. Despite this limitation, we could identify one Roma individual with a haplotype far away from the star-like core identified as the founder J-M92 in Roma, suggesting gene flow from host to Roma (see Supplementary Figure S2D). In the case of J-M67, several Roma individuals present haplotypes distant from the founder star-like core, but only for three of them we could infer with little doubt that they show a host haplotype (Supplementary Figure S2F), suggesting again gene flow from hosts to Roma. For the other haplogroups frequent in Roma (E-V13, I-P37.2, J-M410, and R-M17), no pattern of founder lineages was found and may represent gene flow from their hosts (Supplementary Figures S2G–J).
WIMP values for the founding lineages in every Roma population were variable, with very low values in Romanian and Ukrainian Roma (indicating low internal haplotype diversity) and high values in Bulgarian Balkan Roma (Figure 1a). There is a remarkable difference between Bulgarian Roma samples (Balkan and Vlax groups) that may be related to the different demographic history of Bulgarian Romani groups.14, 17
Y-chromosome population substructure and origins
AMOVA analyses showed that Y-chromosome diversity was neither structured by country of residence nor by migration route (Supplementary Table S5), supporting weak population structure in the male Roma chromosomes.
We tested the impact of the Roma demographic history (inferred from the Roma migration routes) on the observed Y-chromosome genetic diversity. We calculated the correlations between intrapopulation genetic diversity (measured by WIMP) or genetic distances (FST) and geographic locations along the migration route. If Roma populations spread from the Balkan Peninsula following the proposed migration routes, we would expect a decrease in the internal genetic diversity within populations and an increase in the genetic distances between them as a result of serial bottlenecks and founder effects. This pattern is expected to be stronger in founder lineages than in non-founder lineages, the majority of which might have been incorporated after the spread of Roma. However, we did not find any significant correlation between migration routes and genetic data for the Y-chromosome (Figure 2, Supplementary Figure S3, and Supplementary Table S7).
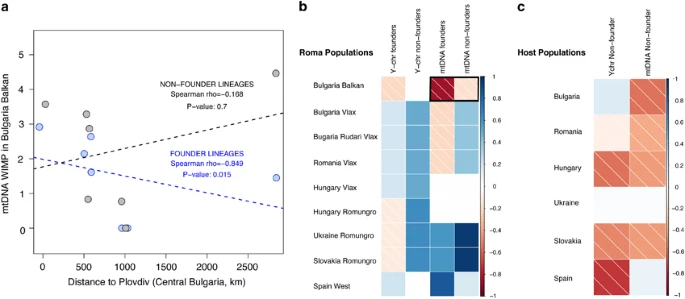
Correlations (Spearman’s rank) between geographical distance and internal diversity measured by WIMP. (a) Example of the correlation (separating founder and non-founder lineages) for the mtDNA taking as a reference Balkan Bulgarian Roma. The dashed lines indicate linear regression (lm() function in R). (b) Correlations for founder and non-founder lineages in Roma samples (in bold, the example shown in a). (c) Correlations in host populations. P-values of the correlations are shown in Supplementary Table S7.
Although we could identify several founder Y-lineages in Roma, the only lineage for which an Indian origin could be unambiguously traced back to the Indian subcontinent was the H-M52 haplogroup (including H-M82).4, 17 The origin of the Roma population in a specific geographical region in India was investigated through the search of identical matches of Roma haplotypes from individuals carrying this haplogroup in India. The highest probability was found in the North (P=0.66) followed by Central India (P=0.19), whereas the rest of regions summed up 15% (Table 2).
mtDNA diversity and founder lineages
The levels of mtDNA genetic diversity were generally low for the Roma populations when compared with their hosts (Supplementary Table S1), similar to the observation in paternal haplotypes. Five hundred and seventy-five different mtDNA sequences were found, 190 in Roma and 421 in hosts, and only 36 were shared between both groups (Supplementary Table S3).
We identified 11 founder maternal lineages in Roma (Supplementary Tables S3 and S6), which represented 58% of the individuals, 35.2% of which carried founder non-M Indian lineages. Besides the founder lineages described by Mendizabal et al,7 we identified a new founder lineage, I1a, the frequency of which ranges from 0% in Spanish Roma to 32% in Slovakian Roma. WIMP values for the founding lineages in Roma varied substantially among populations (Figure 1b). In agreement with Y-chromosome lineages, there are remarkable differences between Bulgarian Roma groups.17 Nonetheless, the most extreme values are observed in Slovakian and Ukrainian Roma, where the WIMP value is null or extremely low. These values might indicate strong local founder effects in those neighboring Roma settlements, probably compounded by small sample size in the case of Ukrainian Roma.
mtDNA population substructure and origins
The AMOVA results supported that the mtDNA genetic variance in the Roma was structured by historical migration routes and not by country of residence (Supplementary Tables S5), in accordance with previous results7, 17 and in contrast with our results for the Y-chromosome.
To evaluate putative signatures of the spread of Roma, we tested the correlation between geographic distances and the observed genetic diversities, as performed for the Y-chromosome. As expected under an out-of-Balkan hypothesis, founder lineages show a significant negative correlation between intrapopulation genetic diversities (ie, WIMP values) and geographic distances from the Balkan area, especially with the Bulgarian Balkan Roma (Figure 2); in other words, founder lineages are more diverse in the Balkan area and decrease progressively with increasing distance. In contrast, the significant positive correlation between internal genetic diversities and geographic distance from Western Europe (ie, Spain) suggests that the Iberian Roma might represent one of the latest settlements in the primary dispersal of Roma within Europe. Similar patterns (although nonsignificant) can be observed studying pairwise genetic distances and geographic distances for founder lineages (Supplementary Figure S3). Conversely, this pattern is diluted in non-founder lineages in Roma and host groups.
We considered the exact matches of both founder and non-founder mitochondrial lineages between Roma and hosts as indicative of gene flow (and directionality) between them. Only seven individuals from the host populations present identical matches with Roma individuals for the founder Roma lineages (one Romanian, two Bulgarians, two Slovakians, one Hungarian, and one Ukrainian, representing between 1.2% and 2.2% of the host populations carrying an exact match). We found that gene flow in the other direction, taking into account non-founder lineages, appears to be much higher. For example, up to 16.5% Hungarian, 10.2% Slovakian, 9.9% Bulgarian Balkan, 9.8% Bulgarian Vlax, 5.8% Greek, 5.5% Romanian, and 2.4% Spanish Roma carry a haplotype also present in the studied non-Roma populations.
From the founder lineages, only the M-lineages could be traced back as original from India,4, 17 mirroring Y-chromosome H haplogroup. We searched for matches of M-haplotypes present in European Roma within India, under the assumption that all the European Roma originated from the same region. The highest probability for the mtDNA in Roma populations was found in NW India (P=0.713; Table 2), in agreement with previous studies,6, 7, 9 linguistic, anthropological, and historical evidences.1
The evolution of the population size through time was modeled for the M-lineages in a BSP (Supplementary Figure S4), assuming that these lineages will reveal the demographic history of the proto-Roma population before its arrival into Europe. We expected a bottleneck signal by the time of the diaspora from India as recently shown for autosomal markers.6 Surprisingly, no signal of founder effect was detected. Otherwise, the BSP showed an increase in Ne starting 3–4 ky ago, which coincides with the expansion of the Indo-European languages in North India.48
Discussion
We inferred founder lineages that were present in the proto-Roma population(s) before their spread across Europe. Despite our conservative definition of founder lineages, these provide an estimation and directionality of gene flow with hosts. Our results are consistent with substantially higher male and female gene flow from European host populations to Roma than vice versa. However, we also obtained minimum estimates of Roma to host gene flow, by considering the set of lineages that are mainly restricted to the Indian subcontinent. The frequencies of the Indian Y-chromosome H haplogroup (present in up to 44% of male Roma) were found to be absent or at very low frequencies in host populations (1.03% in Bulgaria, n=97 and 0.62% in Slovakia, n=161) but at a moderate frequency in Hungary (5.34%, but caution is needed because of sampling strategy29). In the case of host populations where this lineage was absent, we computed the highest frequency F of haplogroup H that could be present but escaped our sampling n with a 95% probability (Poisson distribution 1−e−Fn=0.95) (Supplementary Table S8). For the host populations of Spain (n=253), Greece (n=100), Romania (n=144), and Ukraine (n=42), the probabilities were accordingly low (1.2%, 3%, 2.1%, and 7.1%, respectively). Similarly, the I-P259 haplogroup was only present in one non-Roma Hungarian. We estimated that the highest frequency of this haplogroup in hosts is also low (Bulgaria=3.1%, Slovakia=1.9%, Spain=1.2%, Greece=3%, Romania=2.1%, and Ukraine=7.1%; Supplementary Table S8). In agreement with our results, no traces of haplogroups H-M52, H-M82, or I-P259 were found in an extensive data set of 3136 non-Roma Europeans typed at similar resolution (472 Germans, 96 Danish, 340 Belgians, 90 Dutch, 370 Czechs, 520 Polish, 221 individuals from the United Kingdom, and 1027 Italians, from the Genographic project database, unpublished data), supporting our power to define founder lineages using our data set. With the exception of Hungary, for the reasons mentioned above, the presence of founder lineages in host populations confirms limited male gene flow from Roma to host. In contrast, male gene flow from hosts to Roma is much more frequent, although variable, ranging between 17% in Romania and up to 46% in Hungary. These values are upper-bound estimates of gene flow from hosting populations to Roma, as they could be slightly lower, especially in the case of Hungary. Such differences in the degree of admixture suggest that Roma and hosts might have had different assimilation rates of admixed couples.
Similar to the Y-chromosome patterns, the Indian mitochondrial M haplogroup is present in up to 22.8% of female lineages in Roma. Its scarcity in the European population suggests that female gene flow from Roma to hosts has also been very low. Following the same rationale applied to the Y-chromosome, the highest frequencies of haplogroup M that could be present in these populations is low (Spain, 3.8%; Greece, 3.1%; Hungary, 5.4%; Slovakia, 1.9%; and Ukraine, 7.5%; Supplementary Table S8). Indeed, if we consider the exact matches of mitochondrial haplotypes between Roma and hosts for the different lineages as a relative estimation of gene flow, female gene flow from Roma to non-Roma Europeans has been lower than in the other direction, in agreement with our results of male-mediated gene flow.
Considering (i) the estimates of maximum frequency in those host populations, where no founder lineages were found, and (ii) the maximum value of the confidence interval of the proportions in those host populations that presented founder lineages, a rough estimate of gene flow from Roma to non-Roma populations can be provided. We estimate a Roma-to-host gene flow of 4.6% and 6.2% in male and female founder lineages, respectively, with small differences between hosting populations (see Supplementary Table S8).
The genetic structure of uniparental markers in the Roma populations is not correlated with their country of residence, but it is correlated (at least for the maternal lineages) with the migration classification of the Roma samples. This fact is relevant, as some genetic studies have been based on the country of origin of the Roma volunteers rather than their historical state boundaries (Ottoman Empire, Austro-Hungarian Empire, etc). This result reinforces the relevance of the sampling information when the Roma population history is studied. The variation among Roma groups may reflect high levels of genetic drift and differential admixture along migration routes.6, 17 The lack of correlation between paternal lineages and migrational groups might be explained by different reasons, including the lower phylogenetic resolution of the Y-chromosome compared with the mtDNA, as well as biological and social issues such as differences in assimilation of Roma in different European regions or the different inclusion/exclusion of admixed individuals in Roma groups.
Our study supports the origin of maternal and paternal Roma chromosomes in NW India, in agreement with linguistic, cultural, and previous genetic studies.1, 6, 7 It has been suggested that south India could have also genetically contributed to the proto-Roma based on the exact matches of Y-chromosome H haplotypes.49 However, their Indian sampling was geographically restricted and NW India was not included. Altogether, it seems that a bottleneck pointing to a small number of founder proto-Roma4, 7, 17 is the most likely scenario, which is compatible with a single migration wave rather than with multiple waves either from the same or from different places of origin. The coalescent analysis with BEAST does not support the occurrence of a bottleneck by the time proto-Roma started their journey (around 1.5 kya as estimated with autosomal data6). On the other hand, the rapid population growth of the Roma population few centuries after the founder effect (from few thousands in Medieval Period’s census to current 10 million) could have masked the bottleneck signature in the mtDNA. Alternatively, the mtDNA control region could be underpowered in the short time window of the Romani population founder event. Indeed, the signature of population expansion around 3–4 kya found in the Roma M lineages agrees with the expansion of Indo-Aryan languages in North India.48 This result could indicate that the Indo-Aryan ancestral population of the Roma already carried the Asian-specific M lineages along their expansion in North India. The number and nature of the tribes/castes from Northern India at the origin of the proto-Roma population awaits further studies providing a better phylogenetic, geographical, and social strata coverage, and a precise sampling strategy of the whole Indian subcontinent. Furthermore, the study of Roma groups from other regions where they expanded, such as in Central Asia, may shed additional light on the origins and demographic history of the proto-Roma.
Accession codes
Change history
24 December 2021
A Correction to this paper has been published: https://doi.org/10.1038/s41431-021-01020-7
References
Fraser A : The Gypsies. Blackwell Publishers: Oxford, 1992.
Kenrick D : Historical Dictionary of the Gypsies. The Scarecrow Press, Inc.: Lanham, Maryland, 2007.
Hancock I : The emergence of Romani as a koïné outside of Indiain. Acton T (ed): Scholarship and Gypsy Struggle: Commitment in Romani Studies. University of Hertfordshire Press: Hatfield, 1987, pp 1–13.
Kalaydjieva L, Calafell F, Jobling MA et al: Patterns of inter- and intra-group genetic diversity in the Vlax Roma as revealed by Y chromosome and mitochondrial DNA lineages. Eur J Hum Genet 2001; 9: 97–104.
Kalaydjieva L, Gresham D, Calafell F : Genetic studies of the Roma (Gypsies): a review. BMC Med Genet 2001; 2: 5–5.
Mendizabal I, Lao O, Marigorta UM et al: Reconstructing the population history of European Romani from genome-wide data. Curr Biol 2012; 22: 2342–2349.
Mendizabal I, Valente C, Gusmao A et al: Reconstructing the Indian origin and dispersal of the European Roma: a maternal genetic perspective. PLoS One 2011; 6: e15988.
Moorjani P, Patterson N, Loh P-R et al: Reconstructing Roma history from genome-wide data. PLoS One 2013; 8: e58633.
Morar B, Gresham D, Angelicheva D et al: Mutation history of the Roma/Gypsies. Am J Hum Gene 2004; 75: 596–609.
Marushiakova E, Popov V : Gypsies in the Ottoman Empire. University of Hertfordshire Press: Hatfield, 2001.
Horváthová E . Cigáni na Slovensku (Gypsies in Slovakia). Bratislava: Vydavatelstvo Slovenskej Akadémie Vied, 1964.
Liégeois JP : Roma, Gypsies, Travellers. Council of Europe Press: Strasbourg, 1994.
Marushiakova E, Popov V : Roma identities in Central, Southeastern and Eastern Europe. In: Kyuchukov H, Rawashdeh O (ed): Roma Identity and Anti-Gypsyism in Europe. Lincoln: München, 2013, pp 40–52.
Kalaydjieva L, Morar B, Chaix R, Tang H : A newly discovered founder population: the Roma/Gypsies. BioEssays 2005; 27: 1084–1094.
Morar B, Azmanov DN, Kalaydjieva L : Roma (Gypsies): genetic studies. eLS 2013.
Mendizabal I, Lao O, Marigorta UM, Kayser M, Comas D : Implications of population history of European Romani on genetic susceptibility to disease. Hum Hered 2013; 76: 194–200.
Gresham D, Morar B, Underhill PA et al: Origins and divergence of the Roma (Gypsies). Am J Hum Gene 2001; 69: 1314–1331.
Gusmao A, Valente C, Gomes V et al: A genetic historical sketch of European gypsies: the perspective from autosomal markers. Am J Phys Anthropol 2010; 141: 507–514.
Azmanov DN, Dimitrova S, Florez L et al: LTBP2 and CYP1B1 mutations and associated ocular phenotypes in the Roma/Gypsy founder population. Eur J Hum Genet 2011; 19: 326–333.
Bouwer S, Angelicheva D, Chandler D, Seeman P, Tournev I, Kalaydjieva L : Carrier rates of the ancestral Indian W24X mutation in GJB2 in the general gypsy population and individual subisolates. Genet Test 2007; 11: 455–458.
Gusmao A, Gusmao L, Gomes V et al: A perspective on the history of the Iberian gypsies provided by phylogeographic analysis of Y-chromosome lineages. Ann Hum Genet 2008; 72: 215–227.
Pamjav H, Zalan A, Beres J, Nagy M, Chang YM : Genetic structure of the paternal lineage of the Roma people. Am J Phys Anthropol 2011; 145: 21–29.
Gomez-Carballa A, Pardo-Seco J, Fachal L et al: Indian signatures in the Westernmost edge of the European Romani diaspora: new insight from mitogenomes. PLoS One 2013; 8: e75397.
Malyarchuk BA, Grzybowski T, Derenko MV, Czarny J, Miscicka-Sliwka D : Mitochondrial DNA diversity in the Polish Roma. Ann Hum Genet 2006; 70: 195–206.
Malyarchuk BA, Perkova MA, Derenko MV, Vanecek T, Lazur J, Gomolcak P : Mitochondrial DNA variability in Slovaks, with application to the Roma origin. Ann Hum Genet 2008; 72: 228–240.
Chandrasekar A, Kumar S, Sreenath J et al: Updating phylogeny of mitochondrial DNA macrohaplogroup M in India: dispersal of modern human in South Asian corridor. PLoS One 2009; 4: e7447.
Sun C, Kong QP, Palanichamy MG et al: The dazzling array of basal branches in the mtDNA macrohaplogroup M from India as inferred from complete genomes. Mol Biol Evol 2006; 23: 683–690.
Nagy M, Henke L, Henke J et al: Searching for the origin of Romanies: Slovakian Romani, Jats of Haryana and Jat Sikhs Y-STR data in comparison with different Romani populations. Forensic Sci Int 2007; 169: 19–26.
Volgyi A, Zalan A, Szvetnik E, Pamjav H : Hungarian population data for 11 Y-STR and 49 Y-SNP markers. Forensic Sci Int Genet 2009; 3: E27–E28.
Zalan A, Beres J, Pamjav H : Paternal genetic history of the Vlax Roma. Forensic Sci Int Genet 2011; 5: 109–113.
Martinez-Cruz B, Ioana M, Calafell F et al: Y-chromosome analysis in individuals bearing the Basarab name of the first dynasty of Wallachian Kings. PLoS One 2012; 7: e41803.
Martinez-Cruz B, Ziegle J, Sanz P et al: Multiplex single-nucleotide polymorphism typing of the human Y chromosome using TaqMan probes. Invest Genet 2011; 2: 13.
Martinez-Cruz B, Harmant C, Platt DE et al: Evidence of pre-Roman tribal genetic structure in Basques from uniparentally inherited markers. Mol Biol Evol 2012; 29: 2211–2222.
Karafet TM, Mendez FL, Meilerman MB, Underhill PA, Zegura SL, Hammer MF : New binary polymorphisms reshape and increase resolution of the human Y chromosomal haplogroup tree. Genome Res 2008; 18: 830–838.
Haak W, Balanovsky O, Sanchez JJ et al: Ancient DNA from European early Neolithic farmers reveals their near Eastern affinities. PLoS Biol 2010; 8: e1000536.
Kloss-Brandstaetter A, Pacher D, Schoenherr S et al: HaploGrep: a fast and reliable algorithm for automatic classification of mitochondrial DNA haplogroups. Hum Mutat 2011; 32: 25–32.
van Oven M, Kayser M : Updated Comprehensive phylogenetic tree of global human mitochondrial DNA variation. Hum Mutat 2009; 30: E386–E394.
Excoffier L, Laval G, Schneider S : Arlequin (version 3.0): an integrated software package for population genetics data analysis. Evol Bioinformatics 2005; 1: 47–50.
Hurles ME, Nicholson J, Bosch E, Renfrew C, Sykes BC, Jobling MA : Y chromosomal evidence for the origins of Oceanic-speaking peoples. Genetics 2002; 160: 289–303.
Bandelt HJ, Forster P, Rohl A : Median-joining networks for inferring intraspecific phylogenies. Mol Biol Evol 1999; 16: 37–48.
Drummond AJ, Rambaut A : BEAST: Bayesian evolutionary analysis by sampling trees. BMC Evol Biol 2007; 7: 214.
Soares P, Ermini L, Thomson N et al: Correcting for purifying selection: an improved human mitochondrial molecular clock. Am J Hum Gene 2009; 84: 740–759.
Rambaut A, Suchard MA, Xie D, Drummond AJ : Tracer v1.6. http://beast.bio.ed.ac.uk/Tracer, 2014.
Sengupta S, Zhivotovsky LA, King R et al: Polarity and temporality of high-resolution Y-chromosome distributions in India identify both indigenous and exogenous expansions and reveal minor genetic influence of central Asian pastoralists. Am J Hum Gene 2006; 78: 202–221.
Dubut V, Murail P, Pech N, Thionville MD, Cartault F : Inter- and extra-Indian admixture and genetic diversity in Reunion Island revealed by analysis of mitochondrial DNA. Ann Hum Genet 2009; 73: 314–334.
Mendizabal I, Sandoval K, Berniell-Lee G et al: Genetic origin, admixture, and asymmetry in maternal and paternal human lineages in Cuba. BMC Evol Biol 2008; 8: 213.
Semino O, Magri C, Benuzzi G et al: Origin, diffusion, and differentiation of Y-chromosome haplogroups E and J: inferences on the neolithization of Europe and later migratory events in the Mediterranean area. Am J Hum Genet 2004; 74: 1023–1034.
Mallory JP, Adams DQ : The Oxford Introduction to Proto-Indo-European and the Proto-Indo-European World. Oxford University Press: Oxford, United Kingdom, 2006.
Regueiro M, Rivera L, Chennakrishnaiah S et al: Ancestral modal Y-STR haplotype shared among Romani and South Indian populations. Gene 2012; 504: 296–302.
Acknowledgements
We thank all the DNA donors who made this study possible. We are really grateful to the Banco Nacional de ADN (www.bancoadn.org) for providing part of the Spanish samples, and to Judit Béres for providing some Hungarian (Vlax and Romungro) samples, and Melinda Nagy for Slovakian Roma samples. We also thank Paula Sanz, Maria López-Valenzuela, Mònica Vallés, and the Genomic Core Facility at the UPF for their valuable technical help and advice. This study was partly supported by the Spanish Ministerio de Economía y Competitividad Grant CGL2013-44351-P.
Author information
Authors and Affiliations
Consortia
Corresponding author
Ethics declarations
Competing interests
The authors declare no conflict of interest.
Additional information
The Genographic Consortium includes
Li Jin, Hui Li, and Shilin Li (Fudan University, Shanghai, China); Pandikumar Swamikrishnan (IBM, Somers, NY, USA); Asif Javed, Laxmi Parida, and Ajay K Royyuru (IBM, Yorktown Heights, NY, USA); R John Mitchell (La Trobe University, Melbourne, VIC, Australia); Pierre A Zalloua (Lebanese American University, Chouran, Beirut, Lebanon); Syama Adhikarla, Arun Kumar, Ganesh Prasad, Ramasamy Pitchappan, Arun Varatharajan Santhakumari, and Kavitha Valampuri (Madurai Kamaraj University, Madurai, Tamil Nadu, India); R Spencer Wells and Miguel G Vilar (National Geographic Society, Washington, DC, USA); Himla Soodyall (National Health Laboratory Service, Johannesburg, South Africa); Elena Balanovska and Oleg Balanovsky (Research Centre for Medical Genetics, Russian Academy of Medical Sciences, Moscow, Russia); Chris Tyler-Smith (The Wellcome Trust Sanger Institute, Hinxton, UK); Fabrício R Santos (Universidade Federal de Minas Gerais, Belo Horizonte, Minas Gerais, Brazil); Jaume Bertranpetit, Marc Haber, Marta Melé, and David Comas (Universitat Pompeu Fabra, Barcelona, Spain); Christina J Adler, Alan Cooper, Clio SI Der Sarkissian, and Wolfgang Haak (University of Adelaide, SA, Australia); Matthew E Kaplan and Nirav C Merchant (University of Arizona, Tucson, AZ, USA); Colin Renfrew (University of Cambridge, Cambridge, UK); Andrew C Clarke and Elizabeth A Matisoo-Smith (University of Otago, Dunedin, New Zealand); Jill B Gaieski and Theodore G Schurr (University of Pennsylvania, Philadelphia, PA, USA).
Supplementary Information accompanies this paper on European Journal of Human Genetics website
The original online version of this article was revised.
Access to the supplementary Tables in this article has been removed because of concerns that the data presented could be potentially identifiable.
Rights and permissions
About this article

Cite this article
Martínez-Cruz, B., Mendizabal, I., Harmant, C. et al. Origins, admixture and founder lineages in European Roma. Eur J Hum Genet 24, 937–943 (2016). https://doi.org/10.1038/ejhg.2015.201
Received:
Revised:
Accepted:
Published:
Issue Date:
DOI: https://doi.org/10.1038/ejhg.2015.201
This article is cited by
-
Europe’s Roma people are vulnerable to poor practice in genetics
Nature (2021)
-
Phylogeographic review of Y chromosome haplogroups in Europe
International Journal of Legal Medicine (2021)
-
Sex-biased patterns shaped the genetic history of Roma
Scientific Reports (2020)
-
“Do my Roma and non-Roma patients need different care?” A brief step-by-step guideline for clinical practitioners
International Journal of Public Health (2019)
-
Tau haplotypes support the Asian ancestry of the Roma population settled in the Basque Country
Heredity (2018)
