The rapid proliferation of complex 3D cell and tissue culture models in recent years has highlighted the need for robust live-cell deep imaging solutions. A category of these advanced cell culture models is popularly called “organs-on-chips” because they often employ microfabrication and lithographic technologies adapted from the semiconductor industry to engineer architecturally complex microenvironments that more closely resemble what cells experience in vivo. For instance, Emulate, Inc. has commercialized the Organ-Chip (Chip-S1™), a PDMS ‘chip’ containing two overlapping micromolded channels that are vertically separated by a flexible, microporous membrane. After the channel surfaces are coated with tissue-specific extracellular matrix, cells can be independently seeded into each channel to form monolayers along both sides of the membrane. The Organ-Chip platform is particularly well suited for modeling many barrier tissues. For instance, epithelial cells such as Caco-2 colorectal adenocarcinoma cells can be grown on the top side of the membrane in the top channel while cells such as human endothelial vascular cells are cultured on the underside of the membrane in the bottom channel, to model the intestinal epithelial barrier (referred to as a “Caco-2 Intestine-Chip” in short). This innovative chip design enables the precise control of epithelial–endothelial interactions and paracrine signaling through the microporous membrane, nutrient–waste exchange and fluid shear via media perfusion through the channels, as well as the transmission of mechanical forces through uniaxial stretch of the flexible membrane, which emulates gut peristalsis.
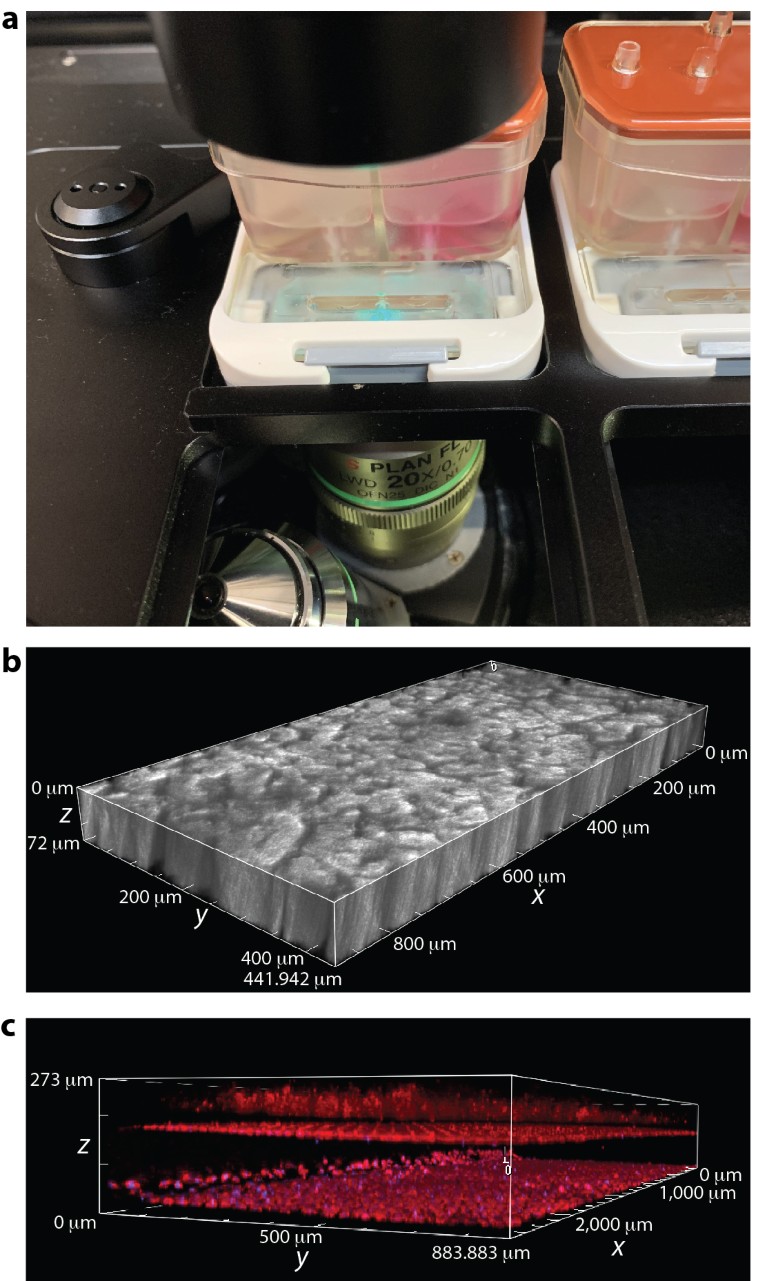
While organ-on-chip technologies like the Emulate Organ-Chip continue to gain acceptance in fields such as toxicology, they are challenging to use in live-cell imaging applications due to the three-dimensional nature of the chip design. For example, a cross-sectional view of the Organ-Chip reveals an underlying PDMS support slab (600 µm), bottom channel (200 µm) and membrane interface (50 µm), which add up to be more than 850 µm thick. In addition, live Organ-Chips are housed in Pod-1™ modules (Fig. 1a) for media perfusion and microenvironmental control, which adds many micrometers of extra empty space between the objective lens and the bottom of the Organ-Chip. To address the need for a robust deep imaging solution for Organ-Chips, as well as other 3D cell culture systems, Nikon developed the CFI S Plan Fluor LWD 20XC objective (Fig. 1a). With a working distance of 2,300 µm, this objective enables imaging through the entire top channel, which is another 1,000 µm in height. As such, with the CFI S Plan Fluor LWD, users can easily image Caco-2 villus-like structures that form on top of the membrane interface (Fig. 1b) and extend upwards more than 70 µm in the Caco-2 Chip. Moreover, the CFI S Plan Fluor LWD has a remarkably high numerical aperture (0.7) for a 20× objective with such a long working distance, making it suitable for fluorescence imaging applications. These features are particularly magnified on the A1R HD25 point-scanning confocal system, which possesses an industry-leading 25-mm field of view and a high-definition resonant scanning mode for high-speed acquisition (up to 30 frames per second at full frame). As an example, Fig. 1c shows a denoised, resonant, 3 × 1 stitched z-stack image of a Caco-2 Chip containing living cells that have been fluorescently stained with Hoechst 33342 and tetramethylrhodamine ethyl ester (TMRE) to visualize nuclei and active mitochondria, respectively. The 25-mm field of view captures nearly the entire channel width at 20× magnification. Moreover, resonant scanning rapidly traverses the z-stack range to capture Caco-2 villus-like structures growing on top of the membrane interface, as well as endothelial cells lining the bottom and top surfaces of the bottom channel. Artificial intelligence technology used in the NIS-Elements Denoise.ai module allows simple, rapid and powerful post-acquisition removal of image shot noise, resulting in image quality that is comparable to that of the more time-intensive galvano mode. Taken together, this configuration enables rapid acquisition of high-quality confocal images through hundreds of micrometers of air, PDMS and cells on a time scale that is relevant for live-cell and/or high-content 3D imaging applications.

Figure 1 | Rapid, deep imaging of live Emulate Organ-Chips. a, Chip-S1 in Pod-1 module positioned within the Nikon-designed stage adaptor (TI2-SHP). b, Transmitted light z stack showing Caco-2 villus-like structures in the top channel. c, Large stitched z stack spanning the bottom channel and part of the top channel. Endothelial monolayers line the top (z = 180 μm) and bottom (z = 30 μm) surfaces of the bottom channel. Caco-2 villus-like structures extend upwards from the membrane surface (z = 200 μm). Cells labeled with TMRE (red) and Hoechst 33342 (blue).
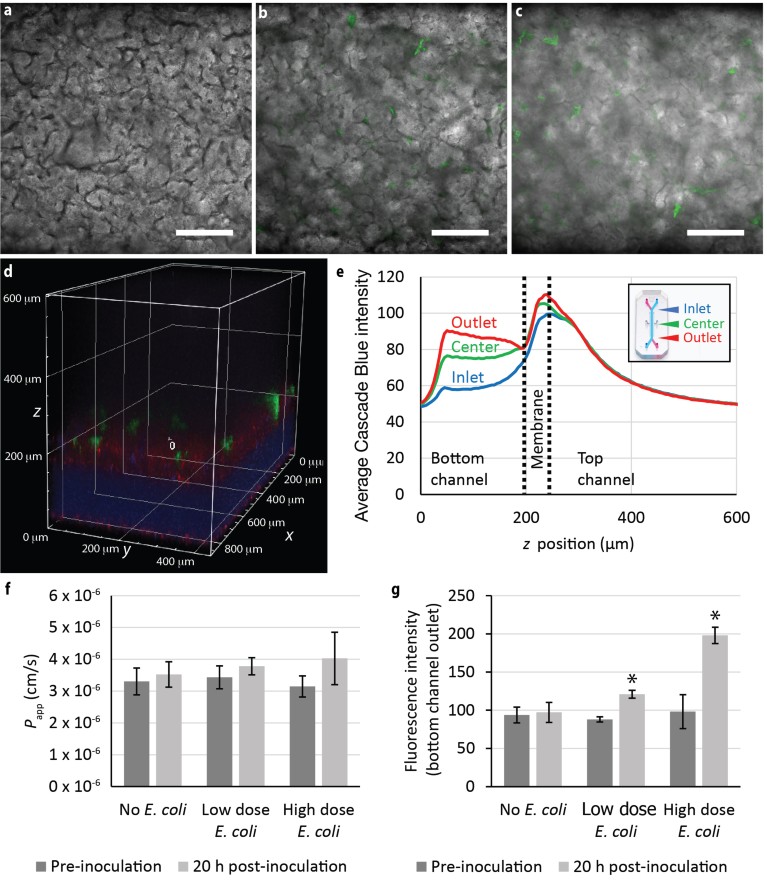
To demonstrate the utility of the A1R HD25 confocal system and CFI S Plan Fluor LWD 20XC objective in a biologically relevant, functional assay, the Caco-2 Chip was inoculated with different doses of GFP-expressing Escherichia coli bacteria after formation of Caco-2 villus-like structures to model human intestine–microbiome interactions. Co-culture with GFP E. coli for 20 hours leads to a deterioration of the Caco-2 villus-like structures in an inoculation-dose-dependent manner (Fig. 2a–c). To assess how this affects permeability through the Caco-2 epithelial barrier, Cascade Blue, a polar, cell-impermeant tracer, is perfused with culture medium through the top channel, where it can pass through a compromised Caco-2 monolayer and the microporous membrane into the bottom channel. The rapid, deep-imaging capability of the A1R HD25 resonant scanner and CFI S Plan Fluor LWD 20XC objective is exploited to acquire z-stack band scans of the Cascade Blue fluorescence spanning the bottom channel through much of the top channel (Fig. 2d). From this z stack, the intensity z profile of Cascade Blue fluorescence can be quantified using General Analysis 3 in NIS-Elements. Notably, z stacks acquired at different x positions along the length of the channel show Cascade Blue dye gradually accumulating in the bottom channel over the channel length (Fig. 2e). This is not surprising given that permeation of dye into the bottom channel occurs primarily through molecular diffusion. Nonetheless, it highlights the spatial sensitivity of the A1R HD25 in detecting, in situ, subtle changes in Cascade Blue fluorescence intensity as a surrogate for dye accumulation and epithelial barrier function. Typically, a plate reader is used to measure bulk fluorescence of effluent medium to estimate the apparent permeability coefficient, but this method was not able to detect significant changes in permeability in the Caco-2 Chip after 20 hours of exposure to GFP E. coli (Fig. 2f). In contrast, the A1R HD25 consistently detected significant increases in Cascade Blue fluorescence in the bottom channel, indicative of weakening barrier integrity, in response to GFP E. coli exposure for the same duration (Fig. 2g). Moreover, it was able to differentiate the changes in fluorescence in response to escalating doses of GFP E. coli.

Figure 2 | Quantitative imaging of Caco-2 epithelial barrier function in live Emulate Organ-Chips. a–c, Galvano images of Caco-2 villus-like structures in the absence (a) or presence of low (b, OD600 = 0.01) and high (c, OD600 = 0.1) doses of GFP E. coli (green) for 20 hours. Scale bars are 200 μm. d, Resonant z stack shows the permeation of Cascade Blue fluorescent dye through the Caco-2 monolayer (red) and GFP E. coli (green) atop the membrane (z = 200 μm) separating the top and bottom channels. e, Quantification of the z profile of Cascade Blue intensity at different positions within the Emulate Chip-S1 (inset). f, Plate-reader-based quantification of apparent permeability (Papp) of Cascade Blue in response to the inoculation conditions in a–c. g, A1R HD25 confocal-based measurement of Cascade Blue fluorescence intensity in situ for the same inoculation conditions. *P < 0.05 determined with paired t-test. Error bars are s.d. with n = 4 Organ-Chips per condition.
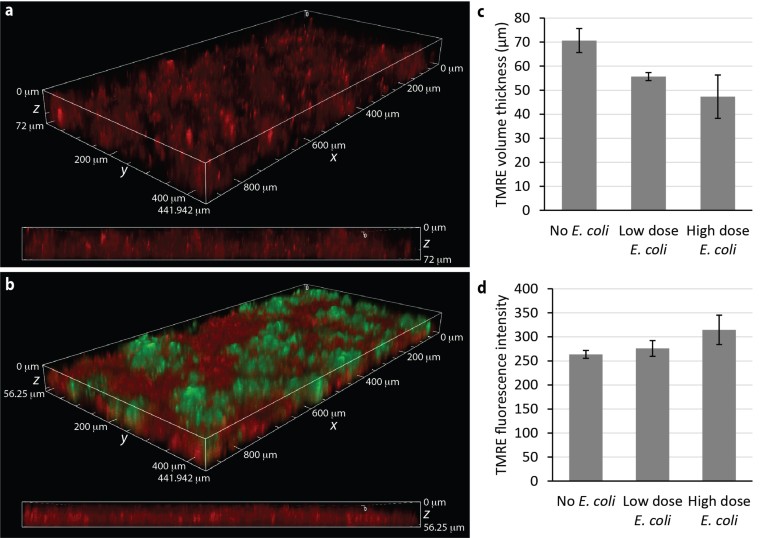
In addition to measuring changes in barrier function, the A1R HD25 and CFI S Plan Fluor LWD 20XC can be used to assess mitochondrial activity in the Caco-2 monolayer through the use of the TMRE dye. In the established Organ-Chip gut microbiome model, TMRE fluorescence is more intense in Caco-2 cells that have been co-cultured with GFP E. coli, suggestive of hyperpolarization in the mitochondria (Fig. 3a,b). Furthermore, the volumetric distribution of the TMRE signal reveals a thinner, flattened monolayer of Caco-2 cells in the presence of GFP E. coli, in agreement with the observed deterioration of the villus-like structures. To obtain a more quantitative assessment, General Analysis 3 in NIS-Elements was used to perform 3D thresholding on TMRE z stacks to identify voxels containing fluorescence signal. Measurement of the minor axis length (or thickness) and intensity showed inverse trends in Caco-2 epithelial monolayer thickness and mitochondrial membrane potential in response to E. coli–induced damage, thus supporting the qualitative observations.

Figure 3 | Imaging mitochondrial membrane potential in live Emulate Organ-Chips. a,b, z-stack 3D projections and cross-sections of Caco-2 cells in Chip-S1 in the absence (a) or presence (b) of GFP E. coli (green) for 20 hours. Cells were subsequently stained with TMRE (red), which readily accumulates in active mitochondria. c,d, 3D thresholding of the TMRE signal in the z stacks is used to estimate Caco-2 monolayer thickness (c) and TMRE fluorescence intensity (d) as a measure of mitochondrial membrane potential. Error bars are s.d. with n = 2 Organ-Chips per condition.
Conclusion
With the A1R HD25 high-speed point-scanning confocal system, long-working-distance CFI S Plan Fluor LWD 20XC objective, and versatile AI-enabled image processing and analysis software built into NIS-Elements, Nikon Instruments offers robust solutions for rapid, deep, quantitative live-cell imaging. Although we highlight here imaging applications for the Emulate Organ-Chip platform, the versatility of the Nikon A1R HD25 and associated imaging technologies will enable users to develop imaging applications, including high-content and live time-lapse, for other complex 3D cell culture systems such as organoids, spheroids and engineered microtissues that would be infeasible with other imaging platforms.


 Nature Methods