Confocal imaging is the current standard for fluorescence imaging in the life sciences. Functional imaging goes beyond the traditional recording of the location and concentration of molecular species, and enables further investigation of molecular function: their interactions with other biomolecules as well as their activity, conformation, molecular environment and post-translational modifications. Ideally, this must be accomplished at high spatiotemporal resolution. Fluorescence lifetimes are exquisitely suited to report on biomolecular functional states, because the time a molecule stays in the excited state is highly dependent on its environment and interactions with other nearby species1,2. As lifetime information is independent of fluorophore concentration, it is a method of choice for functional imaging3. However, several factors have limited the widespread application of FLIM. For one, traditional time-correlated single photon counting (TCSPC) solutions are intrinsically slow and difficult to implement, particularly for complex imaging workflows. Therefore, FLIM imaging has been limited so far to specialized laboratories and, even with expert knowledge, traditional TCSPC has been unable to deliver the speed for biological processes occurring at time scales below tens of seconds.

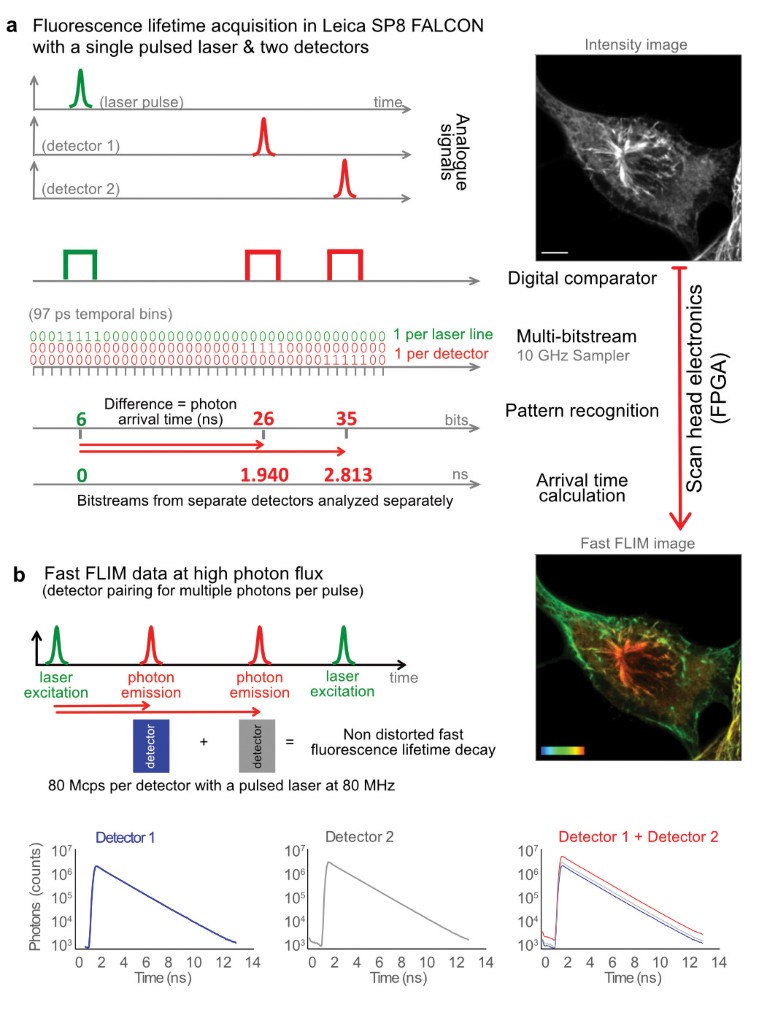
Fig. 1 | Inside the Leica SP8 FALCON. a, Analogue signals from pulsed laser excitation and emitted photons are recorded, digitized with separate comparators, and fed into 10-GHz samplers. Pattern recognition analysis of the resulting bitstreams transforms it into photon arrival times (Fast FLIM). Results are given as Fast FLIM, fluorescence intensity images, overall decay curves and fitted lifetime values. The example images are U2OS cells immunostained with α-tubulin (AF546) and vimentin (AF555), respectively. Color bar, 0–3 ns. Scale bar, 5 μm. b, The system can combine the detected photons from multiple detectors into one for working at higher photon fluxes.
To overcome such limitations in speed and experimental complexity, we developed an innovative concept for measuring lifetime (Fig. 1a). The FLIM approach on SP8 FALCON is based on a confocal scan head with field-programmable gate array (FPGA) electronics, pulsed laser excitation and fast, spectral single-photon counting detectors. The signals of both laser pulses and photon arrival pulses from each detector are digitized at very high speed with a temporal resolution of 97 ps. The data flow as a bitstream that is analyzed by an FPGA-controlled pattern recognition algorithm. This step determines the photon arrival time from the difference between the detection pulse and the laser pulse arrival times. Jitter artifacts are avoided by measuring the time difference from the laser pulse to the detector pulse. These steps are performed directly at the system electronics, ensuring maximum speed and preserving signal quality. The data are then transferred to the computer to generate the image, build the decay curve from the total photon arrival times and calculate the fluorescence lifetime. These direct measurements from the differences in arrival times between detection and excitation pulses are rendered directly online as ‘Fast FLIM’ images.
The speed limitations of traditional TCSPC arise from long electronics and/or detector dead times, making the system unable to keep up with the photon flux typical of modern confocal regimes. To avoid the underestimation of lifetimes due to the so-called pile-up effect4,5, traditional TCSPC systems are operated at photon fluxes between 0.01 and 0.1 photons per laser pulse5,6, with measurement errors around 2.5%7. Efforts to correct pile-up effects have been previously described4,8,9,10,11,12.
The SP8 FALCON implements two complementary approaches that enable lifetime acquisitions at high photon fluxes. The first approach consists of combining multiple detectors and treating them as one (Fig. 1b). This is possible thanks to the full spectral flexibility of the SP8 platform and the SP8 FALCON electronics. The spectral flexibility enables a free adjustment of the detectors’ range to cover a single emission spectrum, and the electronics handle the information coming from the multiple detectors as if it was coming from a single one. This addition of detectors increases the photon flux, which can be set before the acquisition or at the analysis step. In fact, SP8 FALCON keeps the information of the individual detector bitstreams so they can be analyzed together or separately at any time. This multidetector approach, together with the overall system dead time below 1.5 ns, enables accurate FLIM measurements at rates of 1 photon per pulse (Fig. 2e, see below for details; each detector can reach up to 80 Mcps when used with 80 MHz pulsed lasers). The second approach is the implementation of a high-speed FLIM photon filter to avoid pile-up effects. This filter ensures a faithful representation of the overall lifetime decay at high photon fluxes.
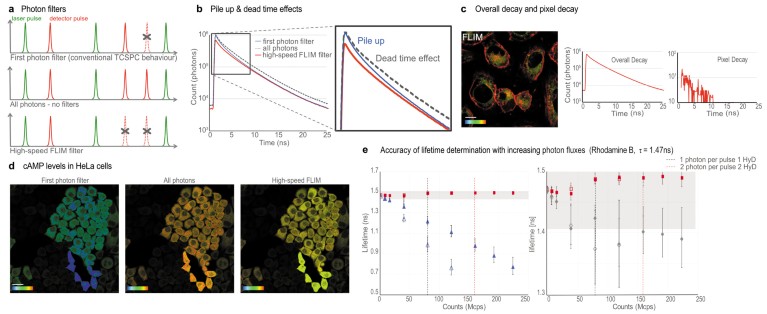
In addition to the high-speed FLIM filter, we implemented two additional modes to assess the quality of the data (Fig. 2): a ‘first photon’ filter and an ‘all photons’ mode. The ‘first photon’ filter (Fig. 2a) builds the fluorescence decay exclusively from the first photon detected after each pulse. This filter mimics traditional TCSPC and its inherent pile-up effect (Fig. 2b), with the resulting underestimation of the lifetime values. At higher counting rates, the measured lifetimes artificially decrease2 (Fig. 2e). The ‘all photons’ mode (Fig. 2a) builds the fluorescence decay with all the photons detected. Although this option has the advantage of significantly increasing photon statistics, it also introduces some bias and, if left uncorrected, it might lead to erroneous lifetimes (Fig. 2e). Nevertheless the ‘all photons’ approach yields a measured lifetime with a smaller error than traditional TCSPC.

Fig. 2 | Accuracy of lifetime measurements with SP8 FALCON. a, Schematics of the SP8 FALCON FLIM modalities. b, Pile-up and dead-time effects on the lifetime decay built with the different photon filters. c, Flipper-TR® in U2OS cells. Color bar, 2-4 ns; scale bar, 10 µm. Overall decay versus pixel-based decay curves. d, cAMP signaling in HeLa cells transfected with the EPAC FLIM-FRET biosensor. FLIM data quality at high photon flux with the three photon modalities. Color bar, 2.5–3.7 ns. Scale bar, 30 μm. e, Rhodamine B lifetime measurements (reference value of 1.47 ns) with increasing photon fluxes (in mega counts per second, Mcps). Red squares: results with high speed FLIM filter. Blue triangles: results from first photon filter (classical TCSPC behavior; open). Grey diamonds: unfiltered results. The grey box indicates the region of 2.5% error. Open symbols, results with a single detector; filled symbols with 2 paired detectors.
Using the high-speed FLIM filter (Fig. 2a), we achieve high photon statistics and accurate lifetime values, with minimal error, at the same time (Fig. 2e). With this filter, we ensure that only single-photon events between pulses are used for building and fitting the overall decay. Then, the SP8 FALCON electronics and novel architecture allows us to directly use this overall model and equation (1) from Patting et al.12 for the pixel-by-pixel FLIM image fit. This leads to:

where the fluorescence decay, f(t), is corrected with the model function; with IRF, the instrument response function; Ai, the amplitudes of the lifetime components; B, the background; P, the number of laser pulses; τ, the lifetime; and td, the dead time.
After obtaining an accurate overall decay curve from the high-speed FLIM filter, we can apply the proper mathematical model for the pixel-by-pixel calculation. At each pixel, we use the unfiltered data to build the decay and the overall mathematical model for fitting. With this dual approach, we ensure that the best possible fitting model is used, together with the appropriate photon statistics (Fig. 2c). This is particularly useful for samples that exhibit sub-regions with very different photon regimes. To illustrate this point, we imaged HeLa cells with very variable expression of the EPAC cAMP FLIM sensor13 (Fig. 2d). All cells have equal cAMP levels, corresponding to a measured lifetime of ~3.5 ns (yellow pixels in Fig. 2d). The ‘first photons’ and ‘all photons’ filters show severe mistakes in the apparent lifetime at high-photon fluxes. The high-speed FLIM filter captures accurate lifetime values for all photon fluxes, up to 2.5 photons per pulse.

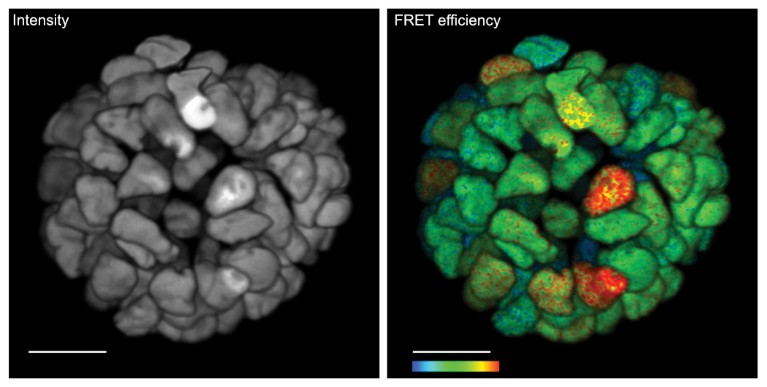
Fig. 3 | Live 3D FLIM on patient-derived organoid. Monitoring cancer-derived increased of signal transduction activity in live organoids with an ERK FRET-FLIM biosensor14 (right). Corresponding fluorescence intensity image with no functional information. Functional information showing FRET efficiency of the ERK biosensor. Higher FRET efficiency indicates higher ERK activity. Color bar, 2–12% FRET efficiency. Scale bar, 20 μm
To quantify the effects of each filter, we performed lifetime measurements with a rhodamine B solution at increasing laser powers, with a minimum of 1 million counts per decay (Fig. 2e). We initially performed a measurement with 0.01 photons per pulse and set it as the reference lifetime value. These measurements allowed us to directly see the effect of increasing count rates on the accuracy of lifetime determination. We note that with the ‘first photon’ filter, the pile-up effect already becomes a significant issue at 20–40 Mcps. When using the ‘all photons’ approach, the measured lifetime comes closer to the reference value but still yields lower values. The standard high-speed FLIM filter on the SP8 FALCON (red squares in Fig. 2e) allows a consistent rhodamine B lifetime determination at photon regimes of up to 225 Mcps, with an error between 0.2% and 1.6%. The data show that SP8 FALCON significantly increases the photon flux regimes available for reliable lifetime measurements.
The high-speed FLIM recording of the SP8 FALCON is a crucial asset for demanding biological experiments. For example, it enabled time-lapse recording of ERK activity in live-patient-derived colorectal cancer organoids14 (Fig. 3). The ERK signaling, which is an important driver of malignant cell growth in colorectal and several other cancer types, was recorded using a modified version of the EKAREV biosensor15. A 3D-rendered movie is accessible at www.leica-microsystems.com/SP8-FALCON-3DLiveOrganoids. Another example is the recording of calcium oscillations with a commercially available calcium sensor16 in live cells with video-rate FLIM contrast (movie available at www.leica-microsystems.com/ SP8-FALCON-fastCalcium). In summary, this new-found speed performance in confocal and multiphoton functional imaging, along with seamless integration of lifetime imaging into all intensity-based confocal imaging and processing tools, enables studying biological processes at time scales previously unattainable.


 Nature Methods