A man picks through a rubbish bin outside a gated house in a wealthy suburb of Johannesburg, South Africa, in 2019.Credit: Waldo Swiegers/Bloomberg via Getty
At the onset of the COVID-19 pandemic, with job losses affecting 17% of all UK workers by early April 2020, women in the United Kingdom were 4.8 percentage points more likely than men to have lost their jobs1. In South Africa in 2017, the average income for a household of white people (adjusted for size and composition of households) was 5.6 times that for a household of African people (‘African’ is a recognized racial classification in South Africa2). And in the United States, a 2018 report found that people born in the 1980s to parents who were in the bottom half of the ‘years of schooling’ distribution had only a 13% chance of making it to the top quartile of the schooling distribution in their generation3.
In all of these cases, the gaps between the groups are not defined by how hard people work or study, by how much they save or by how responsible they have been. Instead, the gaps are solely down to characteristics over which individuals have no control: gender, race and upbringing, respectively. These are examples of what economists call inequality of opportunity.
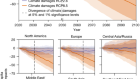
How COVID has deepened inequality — in six stark graphics
Various lines of evidence show that inequality of opportunity is the component of inequality that is least acceptable and most harmful to society. Yet too few economists or other researchers try to quantify its contribution in their measures of a population’s inequality in education, income, employment, health or other outcome of interest.
Doing so requires as much data as possible about people’s circumstances — their race or ethnicity, the neighbourhood they grew up in, their parents’ level of education and so on. Even when such data can be obtained, there isn’t widespread agreement on how best to quantify the share of inequality in a population that is due to inequality of opportunity. This needs to change.
Given the importance of inequality of opportunity in public discourse and in emerging economic research, governments and researchers should be collecting the data needed to construct credible estimates of it. And economists and others should be developing better tools and methods to make those estimates.
Circumstances matter
The ideal of equal opportunity has featured in Western political discourse since the Enlightenment in the seventeenth and eighteenth centuries, and remains prominent to this day.
In his 10 June 1936 address at Little Rock, Arkansas, for example, US President Franklin Roosevelt said, “We know that equality of individual ability has never existed and never will, but we do insist that equality of opportunity still must be sought.” Likewise, the US philosopher John Rawls, in his highly influential 1971 treatise A Theory of Justice, reasoned that fair equality of opportunity — the idea that everyone in society should have the same access to goods, services and employment opportunities — is one of two principles of social justice. (The other is that all citizens should have the highest amount of freedom consistent with everyone else.)
These experiments could lift millions out of dire poverty
Yet the concept remained intangible until economists, including Marc Fleurbaey, John Roemer and Dirk Van de gaer, attempted to formalize these ideas in the 1990s4–6. They suggested that all determinants of a particular social outcome (such as earnings) could, in principle, be divided into factors that individuals can and cannot control. They defined the first category as a person’s efforts, and the second as circumstances. This simple formulation provided a basis for an economic theory of inequality of opportunity.
Subsequent work — mainly in behavioural economics — has shown that it’s not just philosophers and economists who care about the distinction between circumstances and efforts. In multiple laboratory and field experiments since the early 2000s, individuals have been given real money and told to distribute it in whatever way they wish — such as between themselves and another participant, or among a group of fellow participants.
In such situations, only a few people make choices in line with those expected from ‘Homo economicus’ — a figurative species that is characterized, among other things, by purely self-interested preferences. When a participant is given US$100, for instance, they are more likely to give away a sizeable chunk ($30 or $50) instead of giving away $1 and keeping $99. What’s more, if the participant distributing the money proposes an allocation that is deemed too unfair, potential recipients often give up the chance of a real monetary payment to punish the distributor7.
In short, humans (and even some animals) demonstrate an intrinsic preference for fairness and equity.

Early in the COVID-19 pandemic, UK women were more likely than men to have lost their jobs.Credit: Luke MacGregor/Reuters
When economists dug deeper into these behaviours, it became evident that the type of inequality people find most objectionable is that arising from factors seemingly beyond an individual’s control.
In a 2010 study, for example, economists hired 238 students to type as many words as possible during a 10- or 30-minute period8. Each student could choose either the short or the longer task. They were paid according to the number of words they got right, but, at random, some were paid $0.08 for each correct word, others $0.16.
When the students were subsequently organized into pairs, and each member of a pair was told the working time, word output and payment of the other, each student could propose some redistribution of earnings within the pair. Most chose to compensate participants who had been randomly allocated a low wage. Fewer chose to compensate for the duration or quality of work, both of which were seen as being within the individual’s control8.
A social bad
There is also growing evidence that inequality of opportunity is especially detrimental to other social outcomes, such as economic growth.
Since the 1990s, researchers have investigated associations between income inequality and factors such as levels of violent crime9 or disease and death10. This work has generally found that inequality leads to worse health and social outcomes. But the evidence for the relationship between inequality and growth has been much less conclusive, with different data sets and methods leading to disparate results11,12.
In the past decade, associations between growth and inequality have become clearer, thanks to researchers separating out the share of inequality that stems from inequality of opportunity13,14.
Tackling inequality takes social reform
One study, for instance, found that there was no statistically significant association between inequality and economic growth across 26 US states between 1970 and 2000 when total income inequality was considered. But once total inequality was broken down into one component that was due to predetermined circumstances (inequality of opportunity) and another that was due to other factors, the former did have a significant negative impact on growth13.
Other work supports the idea that when sizeable groups are denied access to productive opportunities — simply on the basis of their personal circumstances — the resulting waste of human potential leads to lower economic efficiency and dynamism. A 2019 study, for example, examined the proportion of white men in the population of doctors and lawyers in the United States — a figure that fell from 94% in 1960 to 62% in 2010. The work found that this decrease (and similar declines in other professions) could account for 20–40% of the growth in gross domestic product per person over that 50-year period. The authors suggest that these gains could have arisen from a more efficient allocation of talent, as women and Black men (the two other groups studied) increasingly took professional opportunities that had previously been closed to them15.
But if inequality of opportunity really does constitute the ‘active ingredient’ of inequality — the part that is most widely disliked, and which accounts for its most pernicious social effects — why are measures of the concept still relatively rare in public debate?
Data deficit
‘Opportunity’ refers to the set of possibilities that are open to a person. As such, it is a difficult concept to quantify. Yet, building on the work of Roemer, Van de gaer and Fleurbaey, economists have proposed relatively simple ways to measure inequality of opportunity.
Essentially, these seek to quantify how much of the inequality in an outcome of interest (in income or education, say) is due to circumstances over which people have no control, while accounting for the fact that a person’s efforts are themselves influenced by their circumstances16–18.
Obtaining such a measure requires accurate information on as many predetermined circumstance variables for each person in the sample or population as possible. Data on race or ethnicity, sex or gender and place of birth are relatively straightforward to acquire. But ideally, quantifying inequality of opportunity also requires detailed, long-term information on a person’s family history — including the education, income and occupations of their parents, and even parenting behaviours.

Surgeons Robert Bloodwell, Denton Cooley and Grady Hallman (from left) in the 1960s, when some 90% of US doctors and lawyers were white men.Credit: AP/Shutterstock
Such data are rare in low- and middle-income countries, and even in some affluent ones. They do exist, however, for some high-income countries, such as the United States, Germany, the United Kingdom and most of Scandinavia.
Ultimately, two gold-standard kinds of data should be collected and made available in all countries for researchers and policymakers to gain a better understanding of the unequal opportunities people face across the world.
Equity must be baked into randomized controlled trials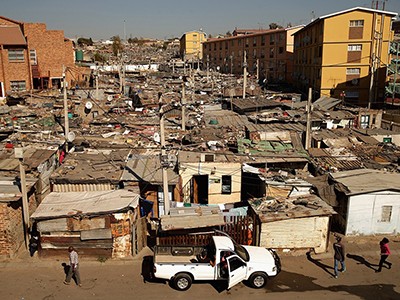
The first comes from detailed, longitudinal household surveys. Examples include the US Panel Study of Income Dynamics, which began in 1968, and Germany’s Socio-Economic Panel, which has run since 1984. Such panels provide rich information on the parents and parenting behaviours of today’s adults, and allow economists to link information across generations. Similar initiatives have begun in emerging economies, such as Mexico and Indonesia, but they are still very much the exception.
The second kind comes from administrative data sets that connect personal identifiers across generations, and across different aspects of people’s lives: educational outcomes can be linked to employment and health histories, social-security contributions, tax payments and so on.
Providing researchers with access to such rich and sensitive data brings challenges around privacy and confidentiality. But these data are available to researchers in countries such as Denmark and Norway — subject to procedural constraints designed to protect people’s privacy. Similar advances are happening elsewhere, including in Chile.
In short, with sufficient investment, it is not hard to imagine how the collection of data on people’s circumstances could be bolstered worldwide.
Statistical conundrum
Even with the best possible data, economists can accurately assess inequality of opportunity only if they work out precisely how variables should be used to partition a population into groups with homogeneous circumstances.
In theory, when data are available for an entire population, all the circumstance variables in those data should be used. Even then, some variables will go unobserved. Researchers might have information, for instance, on whose parents went to university, but not on the rankings of the universities. Because some circumstances will always be overlooked, any estimate of inequality of opportunity will be an underestimate.
On the flip side, when data are available only for a sample of the population (as is typically the case), using a large number of variables to partition the sample can lead to over-fitting. Ever-finer subgroups have ever-fewer people in them, causing group-specific estimates to be noisy. This sampling error tends to inflate the share of variation that is explained by inequality of opportunity. Given these two contradictory biases, how can researchers decide how best to partition a population into subgroups by circumstance variables?
Will COVID force public health to confront America’s epic inequality?
One promising approach is to use machine-learning techniques19,20. Given a data set with a certain number of circumstance variables and subcategories (‘race’, for example, could be divided into ‘Black’, ‘white’ and ‘Asian’), an algorithm tries every possible way of splitting the sample into two groups, and makes the split that generates the most significant statistical difference between the two means. This process is then repeated for each subgroup until no further significant differences are found (for some standard level of statistical significance agreed in advance).
In an unpublished analysis, my colleagues and I applied this method to a sample of just over 6,000 South African households, whose income and other data had been collected by the country’s National Income Dynamics Study in 2017. Our sample included people who self-identified as one of four groups: African, Coloured (a recognized racial classification in South Africa), Asian/Indian, or white.
We instructed an algorithm to split this sample, leaving at least 100 observations in each final group, and used 1% as the cut-off for statistical significance between two groups. Given these parameters — and using only predetermined circumstances such as parental education and parental occupation to make each split — the algorithm divided the sample into ten subgroups or types.
Next, we gave every person in each subgroup an income equal to that subgroup’s average, and computed inequality over this ‘smoothed’ distribution, so that only inequality of opportunity (between the subgroups) is left.
Inequality of opportunity estimated in this way is between 66% and 74% of the overall income inequality in South Africa, as measured by a Gini coefficient of 0.61. (The Gini coefficient measures inequality in the distribution of household income, with lower values indicating a more equal distribution.) Using our lower estimate, 66% of 0.61 is 0.40, which is similar to the latest Gini coefficient reported by the World Bank for the United States (0.42 in 2019; see go.nature.com/3xpjmwp). In other words, the inequality between those ten subgroups of the South African population is essentially the same as the overall inequality in all of the United States. Using a more conservative measure (the mean logarithmic deviation), the share ranges from 39% to 48% of the total. For comparison, a 2015 study of South Africa using 54 types found that inequality of opportunity accounted for only 17–24% of the mean logarithmic deviation21.
This machine-learning approach must be tested in many settings to assess whether it truly represents the extent of inequality of opportunity in a society. Some might worry that certain algorithms are methodological ‘black boxes’. But in a context where no causal hypothesis is being tested, and researchers are seeking only the most efficient way of using the available data to measure inequality of opportunity, a machine-learning approach seems difficult to beat.
One and all
Inequality of opportunity is the conduit through which inequality is reproduced between generations. Combined with improved data-collection efforts, new computational statistical approaches could help to quantify its true extent in regions and countries around the world.
Such information would complement measures of economic mobility (the association between an adult’s income and that of their parents), which rely on a single circumstance variable: parental income. It could also complement measures of overall inequality in outcomes, such as earnings, wealth or education.
Indeed, opportunities and outcomes are best seen as two sides of the same coin: a family’s outcomes today help to shape the opportunities of their children tomorrow, and those opportunities, in turn, help to determine those children’s future outcomes.
 How COVID has deepened inequality — in six stark graphics
 These experiments could lift millions out of dire poverty
 Equity must be baked into randomized controlled trials
 I have funds to buy reagents, but not remedies
 Tackling inequality takes social reform
 The rise of inequality research: can spanning disciplines help tackle injustice?
 Shark researcher attacks lack of diversity in marine science
 Will COVID force public health to confront America’s epic inequality?