The accuracy of survey results is often thought to increase with sample size. However, writing in Nature, Bradley et al.1 show that this is not always the case. Although ‘big’ surveys can, under certain conditions, be useful for tracking changes in a population measure over time and across space, their estimates of population variables can be considerably biased.
Read the paper: Unrepresentative big surveys significantly overestimated US vaccine uptake
Early in the COVID-19 pandemic, many nations lacked essential epidemiological data — even those with well-developed public-health monitoring infrastructures. There was a scarcity of timely information on regional increases in SARS-CoV-2 infections, on adherence to physical-distancing measures and on the social and economic effects of the pandemic. The state-sponsored data collections that existed at the time were often too slow to meet the demands generated by the pandemic.
As a result, some private companies jumped in to offer data; for example, Google, in Mountain View, California, provided anonymized, aggregated data on people’s mobility (go.nature.com/3htjccv), and Facebook in Menlo Park, California, presented anonymized and aggregated data about the development of connections between different geographical regions (go.nature.com/3lwknax). The London-based lifestyle company ZOE built the ZOE COVID Study app in collaboration with academic partners (go.nature.com/3i7ypxj). The app surveyed participants who downloaded it, to identify infection hotspots and track the effect of mitigation measures. And when vaccination programmes were rolled out, it was used to record COVID-19 vaccine side effects. In addition, various private-sector surveys — many of which were archived by the US-based Societal Experts Action Network (go.nature.com/3rcmkwh) — produced data on changes in the public’s response to the pandemic.
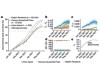
The US Census Bureau, in partnership with various federal agencies, and the Delphi group at Carnegie Mellon University, based in Pittsburgh, Pennsylvania, in partnership with Facebook, designed and performed massive surveys to forecast the spread of COVID-19 and measure its effects; questions about vaccination were added in early 2021. With more than 3 million and 25 million responses collected, respectively (as of November 2021; see go.nature.com/3dg0qvy and go.nature.com/3y2r1bk), these are now probably the largest US surveys relating to the pandemic. However, using a subset of responses, Bradley and colleagues demonstrate that the US Census Bureau–federal agencies survey (dubbed the Census Household Pulse survey) and the Delphi–Facebook survey overestimated the vaccination uptake compared with the benchmark data from the US Centers for Disease Control and Prevention (CDC) (Fig. 1).

Figure 1 | Big surveys can give biased estimates of population variables. Bradley et al.1 compared estimates of the uptake of SARS-CoV-2 vaccines among US adults, as reported by large surveys, with numbers of administered vaccine doses reported by the US Centers for Disease Control and Prevention (CDC) on 26 May 2021. Results from a survey carried out by the US Census Bureau in partnership with various federal agencies (Census Household Pulse), and another survey by the Delphi group at Carnegie Mellon University in Pittsburgh, Pennsylvania, in partnership with Facebook (Delphi–Facebook), overestimated vaccine uptake, but were useful in tracking the increase in vaccination over time in the first half of 2021. Bradley and colleagues explain how design choices in these surveys could account for the bias in the surveys’ absolute estimates of vaccine uptake.
The authors conclude that having more data does not necessarily lead to better estimates. They discuss how design choices in survey-data collection can lead to error — in this case, the overestimation of vaccination uptake. Their findings are a reminder to researchers that statistical precision does not equate to unbiased population estimates.
Bradley and co-workers focus on three elements that can contribute to the size of the error — that is, the difference between estimates from big surveys and actual population values. These elements are data quantity (the fraction of a population that is captured in the sample), problem difficulty (how much variation in the outcome of interest there is in the population) and data quality. The quality is very difficult to assess, because there is usually no independently verified ‘ground truth’ or ‘gold standard’ with which to compare survey data. In this case, the CDC’s reports of the numbers of vaccines administered provide benchmark data with which the estimates reported in the surveys could be compared. Under the strong assumption that these reports are indeed the gold standard and reflect the correct vaccination rates, the survey estimates can be compared with these official numbers (which the CDC frequently updates; state-level estimates updated more recently than those used by Bradley et al. can be found at go.nature.com/3dtrdit). Using this approach, Bradley et al. evaluated estimates from several surveys and found that they did not match the CDC’s reported rates of vaccination uptake.
Tracking inequalities in education around the globe
However, what the metric used by Bradley and colleagues does not enable us to answer — at least, not quantitatively — is the cause of the differences in data quality. To address this issue, the authors used a conceptual framework from survey methodology2 called the total survey error (TSE) framework3, which can help to optimize survey-data quality in three key ways.
First, the TSE framework seeks to ensure that the population of interest and the members included in the ‘frame’ from which the sample is drawn are aligned. Facebook’s active user base is an example of a population that is not aligned with the entire population of the United States. Therefore, if Facebook users have different vaccination habits from those who do not use Facebook, estimates from a survey of Facebook users will be biased. Second, the framework aims to minimize the extent to which those who are sampled and respond differ from the sample members who do not respond. For example, some people who don’t trust the government might be less likely to respond to a government survey. Third, the accordance between the survey measure and the construct of interest should be maximized, and the respondents need to answer in the way intended. For example, questions about vaccination are at risk of being answered positively if respondents feel that they need to present themselves in a favourable light.
For certain inferential tasks, surveys with deficiencies can be useful4. The usefulness of a data set can be evaluated only in the context of a specific research question. For example, data from samples that are known to be biased have provided useful information for monitoring inflation rates, as exemplified by the Billion Prices Project (go.nature.com/3i6qock)5 — which, for years, used prices of online goods and services to estimate alternative indices of inflation. The project was able to do this because, even though not all goods and services were online, online and offline price changes tracked each other. Similarly, the data produced by the US Census Bureau and its partner agencies, and by the Delphi–Facebook partnership, can help to create early-warning systems when administrative data are lacking, as well as help to track cases6 and evaluate the effectiveness of measures designed to mitigate the spread of SARS-CoV-2 infections, if the errors of these surveys stay constant over time.
Helpline data used to monitor population distress in a pandemic
Large sample sizes can also reveal relationships between variables — such as reasons for vaccine hesitancy in subgroups of the population, and changes in these reasons over time — unless these relationships for survey respondents differ from those for people who do not respond. Samples collected at a high frequency over time and across relatively small geographical areas, such as some of the samples discussed by Bradley and colleagues, can also be used to evaluate the need for and effectiveness of policy interventions, such as mask-wearing mandates, lockdowns and school-based measures to limit COVID-19 spread7–9.
The world is moving towards making decisions on the basis of data — as reflected, for example, in the US Foundations for Evidence-Based Policymaking Act of 2018 and the European Data Strategy (go.nature.com/3cp1f7o). In response to these changes, we will probably see more data from all kinds of sources, not just surveys. Strong hopes rest on having more available administrative data, such as those from the CDC, that can in some instances replace survey data10 and, in others, improve survey estimates11.
However, as with survey data, we will need robust frameworks and metrics to assess the quality of the data provided by governments, academic institutions and the private sector, and to guide us in using such data. The work by Bradley and colleagues reminds us that, alongside the studies themselves, research is needed on how best to use data — and on their quality and relevance to the question being asked.
 Read the paper: Unrepresentative big surveys significantly overestimated US vaccine uptake
 Tracking inequalities in education around the globe
 Helpline data used to monitor population distress in a pandemic