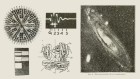
Norman Lockyer’s figure of a solar spectrum, published in the first issue of Nature.Credit: Nature
Science is a fundamentally visual endeavour. It pivots on the material — whether that is an atom, a gene, a crystal, a whale or a distant galaxy. Its aim is elucidation. Thus, communicating research has always been predicated on combining image and text to share discoveries, ideas and observations.
When it came on the market in November 1869, Nature stated its commitment to the visual with a beautifully drawn masthead showing Earth emerging from clouds. (The artist might have been engraver James Davis Cooper, who illustrated Charles Darwin’s 1872 book Expression of Emotions in Man and Animals.) Under the masthead were the words ‘A Weekly Illustrated Journal of Science’. The banner, if not the subtitle, remained on Nature’s front page until just after the Second World War.
Over the years, Nature adapted through its succession of editors, with, in recent decades, ‘sister’ journals carving out their own space in increasingly specialized scientific disciplines. Images remained central throughout. For instance, in 1896, Nature published physicist Wilhelm Röntgen’s first X-ray plates1; in the 1920s, maps to debate Alfred Wegener’s theory of continental drift2; and in 1968, the graphs that described astrophysicist Jocelyn Bell Burnell’s discovery of pulsars3.
Celebrating 150 years of Nature
In some ways, the role of images in science publishing hasn’t changed much over the past 150 years. Much scientific evidence takes the form of visualizations: illustrations, graphics and latterly photographs. What has shifted, inevitably, are the tools. Initially, Nature and other science journals featured monotone printed engravings. Now, its visual landscape is digitized, often mobile, presented in vivid colour and vastly expanded to reflect changes in technological capacity and science itself, as the cover of this anniversary issue attests.
The late nineteenth century saw intense flux in scientific disciplines; boundaries between them were more porous. Images of discoveries sat cheek by jowl on journal pages with diatoms and archaeological artefacts (such as 800–450 bc stone tools found in Scotland by archaeologist Robert Munro4). Whereas many images are now used to interpret or visualize data, these early examples were mainly representations of scientific data — a photograph of an eclipse, say, or a drawing of a geological formation.

The illustration on Nature’s inaugural cover, in 1869.Credit: Nature
In Nature’s inaugural issue, such data-led, representational images had an important role. The journal’s first editor, astronomer Norman Lockyer, had co-discovered helium in 1868 using electromagnetic solar spectroscopy. He illustrated his article ‘The Recent Total Eclipse of the Sun’ with two photographic images: a solar spectrum and an engraving derived from a photograph of a solar eclipse.
These are not photographs as we would understand them. Before the 1890s, most images reproduced for journals were wood engravings, which were inked and set for printing alongside the typeset. To make them, the engraver would either copy by eye or lay a photograph directly onto the woodblock while carving.
The art of precision
Precision was centrally important. If a line on Lockyer’s spectrum was in the wrong place, it might suggest that the Sun is composed of calcium rather than hydrogen. So, to ensure accuracy, skill and collaboration were necessary. The era’s illustrators and engravers were often scientists themselves, or worked closely with researchers. Illustrators might even copy the image directly onto the block or plate ready for the engraver to do their work.
In their book Objectivity (2007), science historians Lorraine Daston and Peter Galison describe such collaborative processes of image-making as “four-eyed sight”. Authors and image-makers worked together to shape and construct an observationally reliable image5. Similar collaborations were common throughout the century. For the first issue of his Magazine of Natural History, for instance, botanist John Claudius Loudon had an engraver copy the prints from John James Audubon’s Birds of America (1827–1838). These worked as field guides for readers, even as the magazine became a forum for debating new findings with an expert community.

Drawing in the Magazine of Natural History.Credit: Magazine of Natural History/Audubon’s Birds of America
By the time Nature appeared, the model of a journal targeting a professional scientific community was emerging. Researchers might be ‘amateur’ naturalists who collected and described species, such as the botanist Alfred William Bennett and cryptogamist Miles Joseph Berkeley, who sent images to Nature depicting the cause of ‘rust’ on wheat and barberry plants6. Or they might belong to the nascent class of university-based laboratory scientists such as physicist Peter Guthrie Tait, who sent in a sketch visualizing his apparatus for measuring the wavelength of monochromatic light7. Specialist journals such as the Journal of Physiology, launched in 1878, reflected emergent disciplines while also making space for both amateurs and professionals.
Compelling imagery was becoming a competitive factor in this burgeoning marketplace of ideas. The non-scientific Illustrated London News, launched in 1842, had established a precedent for capturing large readerships through abundant visuals. As I described in my book From a Photograph (2016), Nature responded to this pressure to some degree8. Yet as historian Melinda Baldwin points out in Making Nature (2015), it wasn’t until 1890 that the journal first made a profit9. The cost of images had a big effect on the bottom line. The geologist Edward Charlesworth, who took over ownership of the Magazine of Natural History from Loudon, had to slim issues down to squeeze in more images on each page10.
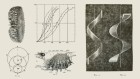
Nature, with its all-encompassing one-word title, also catalysed direct competition, such as astronomer Richard Anthony Proctor’s Knowledge (subtitled ‘An Illustrated Magazine of Science’) and the US illustrated weekly Science. In 1883, one of the latter’s early editors, the entomologist and palaeontologist Samuel Hubbard Scudder, published a description of a giant fossil stick insect discovered in coal deposits in France by another entomologist, Charles Brongniart. Its accompanying engraving (see page 25) effectively stitches together two pieces of observational data — the body and wings of the insect, separated in the coal bed.
Such simple line engravings had become a staple. The same year in Nature, Canadian botanist Grant Allen published a series depicting the shapes of leaves, arguing that their shapes reflect levels of competition with other plants for access to energy sources.

A drawing of ‘Titanophasma Fayoli Brongniart’, published in Science in 1883.Credit: Science Vol. 1, February–June 1883
Between the 1880s and 1900, the old collaborations gave way to technological interlocutors: photographers. Science journals viewed photography as a way of seeing that enabled “mechanical objectivity”. There was greater trust in the power of ground lenses and silver halides to capture the world in a way that the eye cannot. As with all visual technologies, however, it needed selection, organization and interpretation for data to be rendered into a comprehensible image.
The work of French physiologist Étienne-Jules Marey is an iconic example. Following Eadweard Muybridge, who had captured animal locomotion through ‘instantaneous photography’ in the 1870s, Marey developed his own method: chronophotography. In an 1882 issue of Nature, he described his ‘photographic gun’, which used a rotating photographic plate to take sequential images of a flying bird11, helping to pave the way to understanding powered flight. Meanwhile, the Carte du Ciel project at the Paris Observatory, which ran from 1887 to 1950, led to the creation of 22,000 glass-plate negatives of stars from more than 20 observatories12.
Throughout the first half of the twentieth century, photography became crucial to science. Kathleen Lonsdale pioneered the form of crystallography in which X-rays are directed at a sample to measure diffraction and determine its atomic and molecular structure. Lonsdale published her 1928 findings on the benzene ring in the Proceedings of the Royal Society13. Her X-ray diffraction photographs — such as the 1941 series of eight, on diamonds — regularly appeared in Nature’s pages14.
The technique became crucial to the explosive discovery15 of DNA’s structure by molecular biologists James Watson and Francis Crick, published in Nature in 1953. The key piece of evidence, ‘Photograph 51’, showed the diffraction pattern of DNA and was taken, under the supervision of crystallographer Rosalind Franklin, by then-graduate student Raymond Gosling16.
Photography was also used to disprove one of the biggest twentieth-century scientific hoaxes. In 1912, amateur archaeologist Charles Dawson claimed to have discovered the missing link between humans and apes in what looked like an early human skull found in Piltdown, Sussex. In 1913, the anatomist David Waterson published a Nature article including three drawings taken from X-rays, revealing that the mandible of the Piltdown ‘skull’ was almost identical to a chimpanzee’s17. By the 1950s, ‘Piltdown Man’ had been debunked. Nature had become a site for exposing bad science through visual evidence.
By the mid-twentieth century, the long-term boom in science journals (there were already 10,000 by 1900)18 was unabated, keeping pace with the growth in academic science and the proliferation of fields. Photographic technologies remained central, but visual content was diverse and included graphs and early digital images. And starting in the 1970s, technological imaging innovations allowed science to see further and deeper. The cryo-electron microscope, first announced in Nature19, allowed electron microscopy to be applied to organisms by freezing and suspending them in an aqueous solution. (In 2017, its inventors — James Dubochet, Joachim Frank and Richard Henderson — won the chemistry Nobel prize for their work on the structure of viruses.)

Nature cover illustration from August 2019.Credit: Nature
The invention of the charge-coupled device in 1969 meant that images could be captured on a silicon chip: photography had entered the digital realm. Digital-imaging sensors in telescopes have had a vast impact on astronomy. In 2018, Michael Koss and colleagues verified the theory that black holes merge through the use of visual data from the Sloan Digital Sky Survey20. And in 2019, the first image of a black hole was released, created using the Event Horizon Telescope. Nature was key to communicating these new technologies and providing a platform for debating them.
Now, digital imaging is reaching further, with techniques such as hybrid multiplexed sculpted light microscopy under development to measure neuroactivity21, and NASA’s grand database of multi-wavelength images of the galaxy (see go.nature.com/2bdrua5). There are extraordinary shots of nebulae snapped by the Hubble Space Telescope, ‘extreme zoom’ images of single atoms, and the burgeoning field of data visualization — graphical representations of data.
Macro to micro, imaging today is exquisitely precise and often beautiful, able to capture worlds and structures far beyond the scope of human vision. The ‘Drawn Together’ cover image for the 8 August 2019 issue of Nature is a case in point. Crafted by illustrator Inna-Marie Strazhnik, it provides a visualization of work by bioengineer Tyler Ross and colleagues, who used light-activated motor proteins to move microtubules into networked structures22. Strazhnik translated the models, images and graphs in the paper into a dynamic, almost three-dimensional image.
The visual continues to work as a foundation for making sense of data. The tools, as we have seen, have radically changed. The power of images has not.
 Celebrating 150 years of Nature
 10 extraordinary Nature papers
 Nature’s reach: narrow work has broad impact
 Explore Nature’s archive in an interactive graphic
 The design decisions behind Nature’s new look
 How to land a journal cover
 Curating the cosmos: a lens on nature
 How seventeenth-century sisters broke the mould on scientific illustration
 Beatrix Potter: A scientist's eye