The Nature Index is a database of author affiliations and institutional relationships. The index tracks contributions to research articles published in 82 high-quality natural science journals, chosen by an independent group of researchers.
The Nature Index provides absolute and fractional counts of publication productivity at the institutional, national and regional level and, as such, is an indicator of global high-quality research output and collaboration. Data in the Nature Index are updated regularly, with the most recent 12 months made available under a Creative Commons licence at natureindex.com. The database is compiled by Springer Nature.
Nature Index metrics
The Nature Index provides several metrics to track research output and collaboration. These include article count, fractional count, adjusted fractional count and bilateral collaboration score.
The simplest is the article count (AC). A country/region or institution is given an AC of 1 for each article that has at least one author from that country/region or institution. This is the case regardless of the number of authors an article has, and it means that the same article can contribute to the AC of multiple countries/regions or institutions.
To get a sense of a country/region’s or institution’s contribution to an article, and to ensure they are not counted more than once, the index uses fractional count (FC), which takes into account the share of authorship on each article. The total FC available per article is 1, which is shared among all authors under the assumption that each contributed equally. For instance, an article with 10 authors means that each author receives an FC of 0.1. For authors who are affiliated with more than one institution, the individual author’s FC is then split equally between those institutions.
The total FC for an institution is calculated by summing the FC for individual affiliated authors. The process is similar for countries/regions, although complicated by the fact that some institutions have overseas labs that will be counted towards host country/region totals.
When comparing data over time, FC values are adjusted to 2017 levels to account for the small annual variation in the total number of articles in Nature Index journals. The adjustment of FC values in each year is done by calculating the percentage difference in the total number of articles in the index in a given year relative to the number of articles in 2017, and applying this adjustment to FC values.
Another metric is bilateral collaboration score (CS). A bilateral collaboration can be between any two institutions or countries/regions co-authoring at least one article in the journals tracked by the Nature Index. CS is derived by summing the FCs from articles with authors from both institutions. The collaboration score between two institutions A+B is the sum of each of their FCs on the papers to which both have contributed.
The supplement
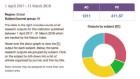
Nature Index 2018 Science Cities is based on data from natureindex.com, covering articles published from 1 January 2012 to 31 December 2017 at the city and country/region level, and articles from 1 January 2015 to 31 December 2017 at the institution level. Most analyses within the supplement use FC as the primary metric, with time series figures adjusted to 2017 levels. Each city’s FC is calculated by summing the output of institutions located in it. For institutions spanning multiple cities, such as CAS, entities were assigned to the city where they are located, where possible.
For a selection of the most populous conurbations with significant output in the index in the United States, Canada, Japan, South Korea, India and Europe, we defined boundaries based on official specifications from census bureaus, statistical offices, government offices, or as described in legal documents. The specifications typically group adjacent areas that have a high degree of social and economic integration, as measured by commuting ties. These cities are labelled as metropolitan areas (MA) in the tables and graphs.
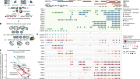
The tables rank cities and metro areas by FC in 2017. They also provide each city’s AC in 2017, contribution to their country/region’s total FC, and percentage of papers co-authored with researchers not based in the city. Separate tables on natureindex.com rank the top cities for corporate output, and in four broad fields. The tables also show each of the five profiled city’s leading institutions for high-quality science, ordered by FC in 2017.
 Counting capital costs
 The cape of change
 A venture under pressure
 City links
 A European heavyweight
 Discovery central
 Peripheral forces
 Standing firm