A satellite view of North Africa by night reveals sparse settlement compared with Middle Eastern neighbours.Credit: Planet Observer/UIG/Getty
Climate scientists in the UK who want to test their ideas against the latest computer models will soon have an easier time. JASMIN — a facility that is part supercomputer, part data centre — is doubling its storage capacity, allowing scientists to access vast quantities of data and perform their own analyses. By the end of 2018, the facility, run by the Centre for Environmental Data Analysis (CEDA), will be able to hold 44 petabytes of information, the rough equivalent of 10 billion photos.
The multi-million-dollar upgrade across its sites is needed to accommodate the furious pace at which information is gathered and analysed in Earth and environmental sciences, says Victoria Bennett, director of CEDA. The European Space Agency’s (ESA) series of Sentinel satellites alone generate terabytes every day, amounting to more than 10 petabytes every year. A petabyte is 1,024 terabytes, or more than 16,000 64-GB iPhone X’s.
Huge amounts of Earth and environmental science data are produced from instruments on land and sea, in the air and in space. The sheer volume, along with ever-increasing computational capacity and machine learning algorithms, allows researchers to get a finer-grained understanding of the processes involved in climate change. But so much data from diverse sources makes categorizing and sharing the information difficult.
Part of Nature Index 2018 Earth and Environmental Sciences
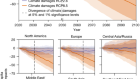
JASMIN takes data produced by individual research groups, as well as from the ESA and other agencies. It also holds the results of climate simulations generated at supercomputing centres in the UK and Germany, which were sponsored by the Partnership for Advanced Computing in Europe, a non-profit organization that seeks to provide supercomputing capabilities to European countries. Researchers can test ideas and data against these simulations. For instance, a group of scientists from China, South Korea, and Sweden studied how arable land turned to desert under 27 climate models, and concluded that the transition takes place at an average global temperature increase of between 1.5 and 2°C.
A big challenge for open data platforms like JASMIN is ensuring the information is in a format that researchers can work with. “We have to make data useable,” says Robert Downs, an informatics researcher and digital archivist at Columbia University’s Center for International Earth Science Information Network (CIESIN). Like most Earth science archives, CIESIN makes its content available to anyone, after processing to ensure it is in a shareable condition.
Consistency is a key factor. In the 1990s, data was often available in incompatible file formats, making it difficult to combine datasets or compare groups of measurements. “We’ve tried to go from the wild west to get folks to stick to three or four formats,” says Jeanne Behnke, a software engineer and deputy project manager for NASA’s Earth Science Data and Information System (ESDIS) project, which holds 24 petabytes of data in its archive and distributed 1.3 billion files to about 3 million users in 2017. Sharing is getting easier, says Behnke.
No universal standards for Earth science data exist, but groups such as the Committee on Data of the International Council for Science (ICSU) are working to promote a common set of best practices by bringing together standards being developed by the ICSU, the Earth Science Information Partners, EU2020, and others. NASA is promoting the standardization of metadata. ESDIS has adopted international metadata standards developed by the International Organization for Standardization (ISO), which specify how datasets should be labelled and suggest keywords to describe them.
Charles Zender, an Earth scientist and computer scientist at the University of California, Irvine, who helped write data interoperability recommendations for NASA in 2016, says: “We were researchers in the field, so we attacked the issues that were most annoying to us.”
Combining datasets can extend our knowledge in ways not previously possible. For instance, in 2016 researchers at Stanford University took satellite imagery of five African countries and applied machine learning to compare how much light areas gave off in the daytime versus the night. Based on the supposition that areas with electricity, and therefore a higher standard of living, are brighter at night, and comparing those to daytime images to check for the presence of infrastructure, the researchers were able to see which regions were worst off.
Another 2016 study, at Wuhan University in China, used satellite remote sensing of Shanghai to count buildings and roads to determine how built-up an area was, and watch how rapidly it changed. They also looked at geotagged social media messages coming from the same area. Combining the two, the researchers say, gave them a more granular picture of how urbanization (as represented by physical objects) and human activity were related, providing information on the growth of cities that could be useful to policy-makers.
 The search for solutions
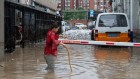
 In the line of fire
 Gravitational pull
 Casting a net for knowledge
 Core values
 Paving the way to an urban future
 Zoom in on the big picture
 Pooled resources
 Making waves
 A guide to the Nature Index