Abstract
Mitochondrial membrane potential provides a valuable indicator of cells’ health and functional status. Cytometry- and microscopy-based analyses, in combination with fluorescent probes, are widely used to study mitochondrial behavior related to cellular pathways, most notably – apoptosis. The cyanine dye JC-1 (5,5′,6,6′-tetrachloro-1,1′,3,3′-tetraethylbenzimi- dazolylcarbocyanine iodide) facilitates discrimination of energized and deenergized mitochondria because the normally green fluorescent dye forms red fluorescent aggregates when concentrated in energized mitochondria in response to their higher membrane potential. JC-1 fluorescence is usually excited by the 488 nm laser wavelength common in flow cytometers. In this study, we show that in practice this approach is not optimal for monitoring mitochondrial behavior. Investigation of fluorescence of JC-1 in solution and in cells using spectrofluorimetry, microscopy and flow cytometry reveals that excitation at 405 nm wavelength, now available on standard instruments, produces signals from aggregate fluorescence with considerably less spillover from dye monomer fluorescence than can be obtained using 488 nm excitation. The improved data are more accurate and eliminate the necessity for fluorescence compensation, making the use of the alternative excitation wavelengths beneficial for mitochondria-related biological and biomedial research.
Main
Mitochondrial membrane potential (Δψm), as estimated using microscopy and cytometry and fluorescent probes, has provided a valuable indicator of cells’ functional status for several decades. Energization of mitochondria was found to be critical in the transition of lymphocytes from a quiescent to a proliferative state of the cell cycle in 1981,1 and deenergization of the organelles in response to cytotoxic drugs was reported in 1982.2 Since 1995, however, when loss of Δψm early in apoptosis was noted and implicated in the mechanism of this form of cell death,3, 4 most publications in which Δψm measurements have figured prominently have dealt with apoptosis.
The fluorescent probes first used for estimation of membrane potential in individual cells and organelles were lipophilic cations, notably symmetric cyanine dyes, such as dihexyloxacarbocyanine (DiOC6(3))5, 6 and rhodamines, such as rhodamine 123.7, 8 These dyes cross cell membranes freely, but are concentrated in membrane-bounded structures with interior-negative membrane potentials both by a Nernstian (charge-dependent) mechanism and by their affinity for lipophilic components in the structures’ interiors. As there are typically interior-negative potential gradients of tens of millivolts between the cytosol and the medium in which cells are suspended and of over a hundred millivolts between the mitochondrial interior and the cytosol, the equilibrium concentration of a cationic indicator will be higher in mitochondria than in the cytosol and higher in the cytosol than in the medium.
The initial applications of fluorescent lipophilic cations were to bulk measurement of the average membrane potential of cells or organelles in suspension; the dye concentrations used were sufficiently high that the fluorescence of most the dye molecules in the interior was quenched by virtue of the high dye concentration there. An increase in the magnitude of the interior-negative membrane potential (hyperpolarization) would draw additional dye in from the medium, decreasing overall fluorescence of the suspension; a decrease in potential (depolarization) would release dye into the medium, increasing overall fluorescence. It was not reported until the dyes were applied in flow cytometry5, 6 that even at high dye concentrations, enough intracellular dye remained unquenched to leave the cells substantially more fluorescent than the background medium.
Although the fluorescence excitation and emission spectra of many dyes, including those initially used for Δψm estimation, change somewhat with concentration, the change is not sufficient to permit the emission from dye in the mitochondria to be distinguished from dye in the cytosol when fluorescence measurements of whole individual cells are made. In the case of DiOC6(3), the fluorescence of cells in micromolar exterior concentrations of the dye is typically unaffected by agents known to affect either cytoplasmic or mitochondrial membrane potential, because most dye in both the mitochondria and cytosol is quenched. At exterior concentrations of tens of nanomolar, most dye in energized mitochondria is quenched, but cellular fluorescence typically changes in response to manipulation of cytoplasmic membrane potential.6 At concentrations less than a few nanomolar, cellular fluorescence is primarily responsive to changes in Δψm.9
The cyanine dye JC-1 (5,5′,6,6′-tetrachloro-1,1′,3,3′-tetraethylbenzimidazolocarbo-cyanine iodide)10, 11 has become widely used for microscopic and cytometric estimation and measurement of Δψm because it forms J-aggregates spectrally distinguishable from dye monomers at the high concentrations reached in energized mitochondria of cells exposed to near-micromolar external concentrations of the dye. The only wavelength, 488 nm, available in most of the older and simpler optical flow cytometers, and still used in a majority of such instruments, excites JC-1 with the highest efficiency. When excited at 488 nm, JC-1 monomers emit green fluorescence with a maximum at 530 nm (green), whereas J-aggregates emit orange-red fluorescence with a maximum at 595 nm (orange-red). Most cytometers are equipped to detect emission at both wavelengths; populations of cells with energized and deenergized mitochondria can be separated by gating in the two-parameter measurement space.
More sophisticated cytometers now available offer additional excitation wavelengths; the most common of these, red (∼640 nm) and violet (∼405 nm), are considered standard laser lines in most commercial cytometers. Whereas the former is of no use for this application,10 the latter can, in principle, be useful for JC-1 excitation. We thought it appropriate to investigate cytometry-based approaches, alternative to the traditional 488-nm excitation, to better discrimination between JC-1 monomers and aggregates, and thus improve cytometric analysis of Δψm, with relevance to apoptosis and mitochondrial-related research.
Results and Discussion
Our first goal was to evaluate the use of optical flow cytometry for detecting JC-1 aggregates (J-aggregates) in murine L1210 lymphoblasts. L1210 cells are optimal for flow cytometry application due to their small size and spherical shape.12, 13 We first incubated the exponentially growing cell population with 2.5 μM JC-1 and used the Gallios flow cytometer (Beckman-Coulter, Miami, FL, USA) for quantifying 488-nm-excited fluorescence signals at 585/42 nm (FL2; ‘red’) and 525/50 nm (FL1; ‘green’). The dye concentration and cytometer settings were typical of protocols recommended by JC-1 suppliers (see e.g., links to two webpages in Materials and Methods). As expected, both green and red signals from the stained cells were strong, indicating the presence of both cytoplasmic JC-1 monomer and mitochondrial J-aggregates in these cells (Figure 1, top left panel and Supplementary Figure S1).
Standard methods for JC-1 detection are not optimal. L1210 cells were first incubated with 1 μM valinomycin or DMSO (control) for 30 min at room temperature (RT) and then stained with 2.5 μM JC-1 for additional 15 min (RT). Valinomycin and mock-treated cell populations were analyzed either separately or mixed by the Gallios Flow Cytometer (Beckman-Coulter), using a 488 laser, following standard protocols provided by JC-1 manufacturers. Data were processed by FlowJo v7.6.4. FL2 (585/42)−FL1 (525/50) subtraction (compensation) are shown in percentages.
Valinomycin, a potassium ionophore and an uncoupler of mitochondrial respiration, causes collapse of the mitochondrial membrane potential and eventually apoptosis.14, 15 Treating cells with valinomycin completely eliminates J-aggregates.10 Incubating L1210 cells with 1 μM valinomycin before JC-1 staining indeed reduced the intensity of the red (585 nm) fluorescence signal for 95% of the population (Figure 1, top mid panel). However, the valinomycin-treated cells were poorly separated from the control cells (Figure 1, top right panel), and the intensity at 585 nm was roughly two orders of magnitude higher than the background level we measured for unstained cells (Supplementary Figure S1). The near-optimal excitation wavelength for JC-1 monomers is 488 nm; however, monomers, are present throughout the cytoplasmic volume and are thus highly abundant, have significant emission at 585 nm. Therefore, the 585-nm emission from JC-1 in the valinomycin-treated cells results almost entirely from spillover of JC-1 monomer fluorescence, explaining the strong correlation (R2=0.876) between red and green fluorescence in these cells (see gating in Supplementary Figure S2).
In cytometry, emission spectral overlap is routinely corrected by compensation, which, in this case, is done primarily by subtracting a fraction of the green fluorescence signal, which comes exclusively from monomers, from the red fluorescence signal, which represents contributions from both monomers and aggregates. Some but not all (compare Ogata et al.14 and Inai et al.15) of the companies supplying JC-1 or JC-1 assay kits for flow cytometry recommend the use of valinomycin or other mitochondrial uncouplers, like carbonylcyanide m-chlorophenylhydrazone (CCCP), in order to determine the degree (in percentages) of compensation required for genuinely quantifying 488-excited J-aggregates.
In our experiments, eliminating the spillover signal of JC-1 monomers from the 585 channel required subtraction of 30% of the green signal (Figure 1, mid and bottom right pannels). The compensated red and green fluorescence signals are essentially independent (R2 of the valinomycin treated cells =0.013); the valinomycin-treated cells are clearly separated from the controls cells and can be easily gated. In the properly compensated plots, it becomes clear that cells with energized and deenergized mitochondria can be distinguished simply by their aggregate-dependent JC-1 red fluorescence.
We revisited the fluorescence characteristics of JC-1 in a cell-free system using a luminescence spectrometer. We noticed that the solubility, and therefore the degree of aggregate formation, of JC-1 in aqueous media containing dimethyl sulfoxide (DMSO) vary with DMSO concentration; at 2.5 μM JC-1 concentration, in the presence of <1% DMSO, 488 nm-excited JC-1 emits only at 595 nm, indicating that almost all JC-1 is present as aggregates, whereas in 35% DMSO, JC-1 emission peaks only at 530 nm, indicating that almost all JC-1 is monomeric (Figures 2a and b). At an intermediate concentration of DMSO (15%), 488-nm-excited JC-1 emits at both 530 and 595 nm (Figure 2c), indicating that both forms of JC-1 are present.
Emission/excitation spectra of JC-1 monomers and aggregates reveals the potential use of 405 nm wavelength to specifically detect J-aggregates. JC-1 was dissolved in the presence of 0.1 (a), 35 (b) or 15% (c) DMSO to a final concentration of 2.5 μM. Emission spectra (a–c) at 405 (black) and 488 nm (gray), and excitation spectra (d) at 530 (black) and 595 nm (gray) were determined by Aminco Bowman Series 2 luminescence spectrometer. Excitation spectra of JC-1 at 0.1% DMSO (aggregates) and 35% DMSO (monomers) were determined separately (d). The black arrow indicates excitation at 405 nm. Also presented are the normalized emission (405 nm) and excitation (530nm) spectra for better visualization of the weaker signal (dotted line). The normalization factor for the emission spectra is the ratio between the fluorescent intensities measured at 595 nm of the 405 and the 488 nm-excited JC-1, and was determined to be 16.1 (a), 23.6 (b) and 13.3 (c). The normalization factor for the excitation spectrum of the 530 nm-emitted signal (=8.42) is the ratio between the 488 nm-excited fluorescence intensities at 530 nm and 595 nm (d).
We next characterized the emission spectra of J-aggregates at 405 nm excitation in comparison with the recommended 488-nm excitation. Interestingly, much as with 488-nm excitation, 405-nm-excited J-aggregates emitted at 595 nm (Figure 2a). At 488 nm excitation, the emission intensity at 595 nm was 16-fold higher as would be expected. To permit comparison, we defined the ratio between the 488-nm- and the 405-nm-excited fluorescent intensities at 595 nm as a normalization factor and re-plotted the normalized spectra (Figures 2a–c, dotted lines) to show that the emission spectra of 405-nm- and 488-nm-excited J-aggregates are perfectly superimposed.
Emission intensity of monomers at 530 nm excited at 488 nm was ∼five fold higher than normalized monomer emission excited at 405 nm (Figure 2b). This relationship was also seen when emission spectra of both JC-1 monomers and aggregates were analyzed simultaneously (Figure 2c). Therefore, although 405 nm excites both JC-1 monomers and J-aggregates much less efficiently than does 488 nm (see also excitation spectra in Figure 2d), spillover emission at 595 nm coming from monomers is nearly five-fold lower when 405 nm is used. The reason for that is evident in the JC-1 excitation spectra, showing that the emission efficiency of monomers (530 nm) excited at 405 nm is nearly zero (Figure 2d). Therefore, despite the relatively inefficient, yet sufficient, excitation of J-aggregates by 405 nm, the signal (aggregates) to noise (monomers) ratio is 7.8-fold higher than with excitation at 488 nm. Figures 1 and 2 suggested that 405-nm excitation might therefore provide better discrimination of aggregates from monomers in cells.
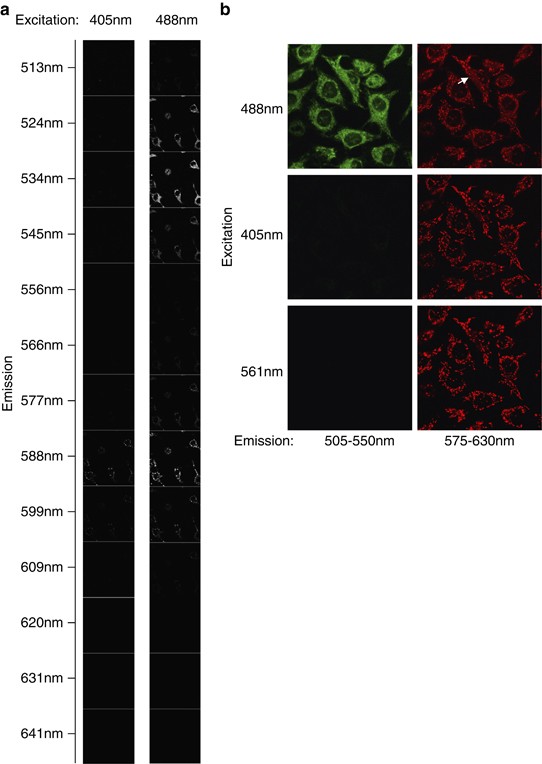
This hypothesis was supported by results obtained when JC-1-stained HeLa cells were visualized. Figure 3a compares 405-nm and 488-nm excitation in images made at 10 nm intervals over the range 513–641 nm. Excitation at 488 nm resulted in higher emission of the J-aggregates and brighter images of mitochondria (see emission scan; 588–599 nm). However, JC-1 monomers, although as bright as aggregates, when excited at 488 nm (see emission scan; 520–540 nm), were barely detectable with 405 nm excitation, opposite to J-aggregates that provided a bright signal in the energized mitochondria.
Excitation at 405 nm specifically detects J-aggregates in the mitochondria. (a) HeLa cells were stained with 2.5 μM JC-1 (15 min, RT). Cells were excited at 405 or 488 nm and imaged by an upright Leica SPE confocal microscope (Leica, Wetzlar, Germany) ( × 40 water deep lens), using a single spectral detector. Emission spectra ranging from 513–641 nm in 10 nm intervals are depicted. (b) HeLa cells were grown in 35 mm glass-bottom dishes and stained with JC-1 (see a). Cells were imaged by Zeiss LSM 510 META confocal microscope (Carl Zeiss, Jena, Germany) using × 63 lens and the 405, 488 and 561 nm lasers. Filters used: BP 505-550 for the green channel and BP 575-630 for the red channel.
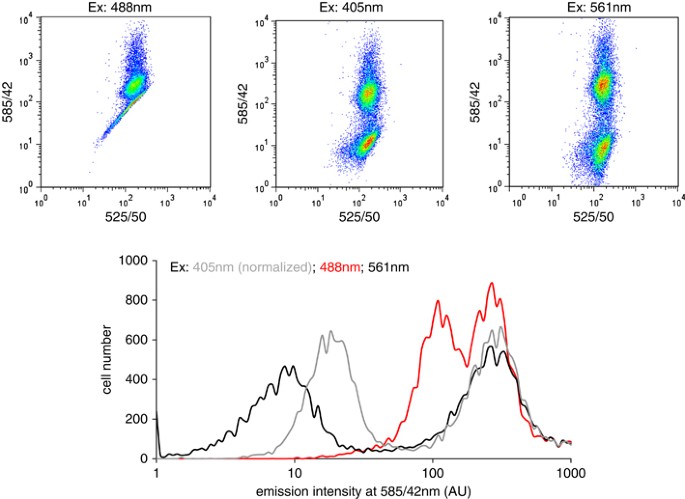
The excitation wavelength 561 nm is above the emission spectra of JC-1 monomers and selectively excites J-aggregates. Higher-resolution images of HeLa cells using 405-, 488- and 561-nm excitation enable clear visualization of mitochondria (Figure 3b) in images made using a 575–630-nm band pass filter (detector characteristics – gain and offset, pixel time, optical path and resolution remained constant, and the power of the 405, 488 and 561 lasers was adjusted to provide comparable images). With 488-nm excitation, J-aggregates in mitochondria are seen against a high background of cytoplasmic JC-1 monomer fluorescence at 505–550 nm; spillover from the cytoplasm is noticeable in the 575–630 nm image (see arrow). Excitation at 405 nm produces little detectable emission in the 505–550 nm images; 405-nm excitation of monomers is, as previously noted (Figure 2d), less efficient than excitation of aggregates at this wavelength. As expected, 561 nm provides essentially no excitation for monomers but is efficient for excitation of aggregates. As aggregates are only likely to be found in energized mitochondria, 575–630 nm images taken with either 405- or 561-nm excitation provide better discrimination than do images at the same emission wavelength made using 488-nm excitation, which produces spillover from extramitochondrial JC-1 monomers. This mirrors what is shown in Figure 1; substantial compensation is required to provide clean separation of cell populations with energized and deenergized mitochondria when green and red fluorescence signals are collected in the flow cytometer using 488-nm excitation. We therefore reasoned that little or no compensation would be necessary if red signals were collected using either 405 or 561-nm excitation. We tested this hypothesis, using a BD LSRII flow cytometer (Becton Dickinson, San Jose, CA, USA) equipped with 405, 488 and 561 nm lasers, and analyzed mixed populations of control and valinomycin-treated L1210 cells stained with JC-1. 561-nm excitation was now used as a reference for optimal specificity for J-aggregates (Figure 4, right panel). As we observed using the Gallios flow cytometer (Beckman Coulter), at 488 nm excitation, valinomycin-treated cells (JC-1- aggregates negative) were poorly separated from the control cells (JC-1-aggregates positive) in bivariate plots of uncompensated data, and the 525/50-nm and 585/42-nm signals were strongly correlated (R2=0.88). These findings strengthened our conclusion that 488-nm excitation is not optimal for quantifying J-aggregates (Figure 4, left panel). In contrast, when 405-nm excitation was used (Figure 4, mid panel), the separation of control cells from valinomycin-treated cells was nearly optimal (see excitation at 561 nm [right panel] for comparison); the R2 value of 0.18 for the correlation of 525/50-nm and 585/42-nm signals from valinomycin-treated cells substantiates insignificant spillover of JC-1 monomer fluorescence into the J-aggregate spectrum. As the bottom plot of Figure 4 indicates, histograms of uncompensated 585-nm fluorescence obtained using either 405 nm or 561 nm excitation can provide a basis on which to discriminate between cells with functional and deenergized mitochondria, at least equivalent to that obtained by compensation of green and red signals excited at 488 nm (Figure 1). Of the three laser lines, the 561-nm line is preferable because it does not excite JC-1 monomers, yet is efficient at exciting J-aggregates (Figures 2 and 3). However, unlike the 405-nm lasers, 561-nm lasers are only now gradually integrated in modern instruments, they are expensive and installed on substantially fewer instruments. The 405-nm laser is clearly preferable to the 488-nm laser in distinguishing J-aggregates from monomers. In practice, the former’s selectivity for aggregates matches that of the 561-nm laser. We therefore conclude that 405-nm and if available, 561-nm laser lines are optimal for monitoring mitochondrial functionality and cells’ apoptotic status. The 532-nm lasers used in some relatively simple and inexpensive new flow cytometers should also be usable for J-aggregate measurements, although they are likely to produce a small amount of spillover fluorescence from monomers. In case 488 is the sole laser line, compensation can account for the poor J-aggregate selectivity.
Excitation at 405 nm, like 561 nm, is optimal for flow cytometric analyses of J-aggregates. L1210 cells were incubated with DMSO (control) or 1 μM valinomycin for 30 min at RT and then stained with 2.5 μM JC-1 for additional 15 min. The control and valinomycin treated cell populations were mixed and analyzed by the LSRII flow cytometer (Becton Dickinson) using 405, 488 and 561 lasers, and 525/50 and 585/42 nm filters. Data were processed using FlowJo v7.6.4. Emission intensities at 585/42 were plotted also as histograms. The 405-nm-excited signal (grey) was normalized by a factor of 1.5-fold for better visualization.
The traditional use of the 488 nm wavelength as a mean to detect J-aggregates most likely originated from two main reasons: first, for years 488 nm was the only applicable, affordable and available wavelength. Second, although 405-nm excitation distinguishes J-aggregates from monomers well (Figures 2, 3, 4), excitation of JC-1 by 488 is substantially more efficient (Figure 2d) and thus, even today the use of 488-nm excitation is mistakenly considered the natural choice for this application, and the use of 405-nm excitation is counterintuitive. Today, modern flow cytometry facilities are much more likely to contain multilaser instruments than was the case in the past. Although 405- and 561-nm lasers have not been added to modern cytometers with the notion that they might improve mitochondrial membrane potential measurements using JC-1, they can and should be used to do so. We encourage colleagues who share our belief that cytometry worth doing is worth doing well to take advantage of their cytometers’ full capabilities, for the application we have just discussed and otherwise. Those who manufacture and distribute JC-1 products might consider modifying their protocols and data sheets accordingly.
Materials and Methods
Tissue culture and cell manipulation
L1210 murine lymphoblasts (ATCC, CCL-219) were maintained in L-15 media (Gibco, Paisley, UK) supplemented with 10% fetal bovine serum (FBS), and penicillin and streptomycin (Gibco) at 37 °C. HeLa cells were maintained in DMEM (Gibco) supplemented with 10% FBS and penicillin and streptomycin at 37 °C, 5% CO2 and humidified environment. Valinomycin (1 μM, unless otherwise is indicated) and JC-1 (2.5 μM) were purchased from Sigma-Aldrich (St Louis, MO, USA) and Enzo Life Sciences (Farmingdale, NY, USA), respectively. JC-1 was dissolved in 100 mM Tris, pH 8.2. Before FACS analysis cells were passed through a cell strainer (Becton Dickinson).
Data acquisition and analyses
Flow cytometry
The Gallios (Beckman-Coulter) and LSR-II (BD) flow cytometers were used in this study with the following lasers: 405 and 488 nm (Gallios), and 405, 488 and 561 nm (LSR-II), and filters: 525/50 and 585/42 nm. Data were processed by FlowJo v7.6.4. Gating strategy is illustrated in Supplementary Figures S1, S2 and S3.
Imaging
HeLa cells were cultured in plastic dishes, excited at 405 or 488nm and imaged by an upright Leica SPE confocal microscope (Leica, × 40 water deep lens, NA=1), using a single spectral detector. For high resolution imaging HeLa cells were cultured in 35-mm glass-bottom dishes (MatTek, Ashland, MA, USA), excited at 405, 488 and 561 nm lasers and imaged by Zeiss LSM 510 META confocal microscope using × 63 lens (NA=1.4) using the filters BP 505-550 for the green channel, and BP 575-630 for the red channel.
Spectroscopy
JC-1 was dissolved to a final concentration of 2.5 μM in the presence of 0.1, 15 or 35% DMSO. Emission spectra at 405 and 488 nm and excitation spectra at 530 and 595 nm were determined by Aminco Bowman Series 2 luminescence spectrometer.
Links to protocols by JC-1 providers:
Abbreviations
- JC-1:
-
5,5′,6,6′-tetrachloro-1,1′,3,3′-tetraethylbenzimidazolylcarbocyanine iodide
- Δψm:
-
mitochondrial membrane potential
- DiOC6(3):
-
3,3′-dihexyloxacarbocyanine iodide
- J-aggregates:
-
JC-1 aggregates
- DMSO:
-
dimethyl sulfoxide
References
Darzynkiewicz Z, Staiano-Coico L, Melamed MR . Increased mitochondrial uptake of rhodamine 123 during lymphocyte stimulation. Proc Natl Acad Sci USA 1981; 78: 2383–2387.
Bernal SD, Shapiro HM, Chen LB . Monitoring the effect of anti-cancer drugs on L1210 cells by a mitochondrial probe, rhodamine-123. Int J Cancer 1982; 30: 219–224.
Cossarizza A, Franceschi C, Monti D, Salvioli S, Bellesia E, Rivabene R et al. Protective effect of N-acetylcysteine in tumor necrosis factor-alpha-induced apoptosis in U937 cells: the role of mitochondria. Exp Cell Res 1995; 220: 232–240.
Petit PX, Lecoeur H, Zorn E, Dauguet C, Mignotte B, Gougeon ML . Alterations in mitochondrial structure and function are early events of dexamethasone-induced thymocyte apoptosis. J Cell Biol 1995; 130: 157–167.
Shapiro HM . Flow cytometric probes of early events in cell activation. Cytometry 1981; 1: 301–312.
Shapiro HM, Natale PJ, Kamentsky LA . Estimation of membrane potentials of individual lymphocytes by flow cytometry. Proc Natl Acad Sci USA 1979; 76: 5728–5730.
Johnson LV, Walsh ML, Bockus BJ, Chen LB . Monitoring of relative mitochondrial membrane potential in living cells by fluorescence microscopy. J Cell Biol 1981; 88: 526–535.
Johnson LV, Walsh ML, Chen LB . Localization of mitochondria in living cells with rhodamine 123. Proc Natl Acad Sci USA 1980; 77: 990–994.
Rottenberg H, Wu S . Quantitative assay by flow cytometry of the mitochondrial membrane potential in intact cells. Biochim Biophys Acta 1998; 1404: 393–404.
Reers M, Smith TW, Chen LB . J-aggregate formation of a carbocyanine as a quantitative fluorescent indicator of membrane potential. Biochemistry 1991; 30: 4480–4486.
Smiley ST, Reers M, Mottola-Hartshorn C, Lin M, Chen A, Smith TW et al. Intracellular heterogeneity in mitochondrial m embrane potentials revealed by a J-aggregate-forming lipophilic cation JC-1. Proc Natl Acad Sci USA 1991; 88: 3671–3675.
Tzur A, Kafri R, LeBleu VS, Lahav G, Kirschner MW . Cell growth and size homeostasis in proliferating animal cells. Science 2009; 325: 167–171.
Tzur A, Moore JK, Jorgensen P, Shapiro HM, Kirschner MW . Optimizing optical flow cytometry for cell volume-based sorting and analysis. PLoS One 2011; 6: e16053.
Ogata E, Rasmussen H . Valinomycin and mitochondrial ion transport. Biochemistry 1966; 5: 57–66.
Inai Y, Yabuki M, Kanno T, Akiyama J, Yasuda T, Utsumi K . Valinomycin induces apoptosis of ascites hepatoma cells (AH-130) in relation to mitochondrial membrane potential. Cell Struct Funct 1997; 22: 555–563.
Acknowledgements
We thank Dr. Joseph Orly for the valinomycin, and Dr. Roxane Lahmi, Dr. Manuela Vecsler, Dr. Ayala Sharp and Mr. Eitan Ariel for technical assistance. Funding by the Marie Curie International Reintegration Grant PIRG-GA-2010-277062 (AT), the Israeli Centers of Research Excellence (I-CORE), Gene Regulation in Complex Human Disease, Center No. 41/11 (AT), and the Israel Cancer Association Grant 20120067 (AT) is gratefully acknowledged.
Author information
Authors and Affiliations
Corresponding author
Ethics declarations
Competing interests
The authors declare no conflict of interest.
Additional information
Edited by A Finazzi-Agro'
Supplementary Information accompanies the paper on Cell Death and Disease website
Supplementary information
Rights and permissions
This work is licensed under the Creative Commons Attribution-NonCommercial-No Derivative Works 3.0 Unported License. To view a copy of this license, visit http://creativecommons.org/licenses/by-nc-nd/3.0/
About this article
Cite this article
Perelman, A., Wachtel, C., Cohen, M. et al. JC-1: alternative excitation wavelengths facilitate mitochondrial membrane potential cytometry. Cell Death Dis 3, e430 (2012). https://doi.org/10.1038/cddis.2012.171
Received:
Accepted:
Published:
Issue Date:
DOI: https://doi.org/10.1038/cddis.2012.171
Keywords
This article is cited by
-
Trophoblast-derived miR-410-5p induces M2 macrophage polarization and mediates immunotolerance at the fetal-maternal interface by targeting the STAT1 signaling pathway
Journal of Translational Medicine (2024)
-
Deep learning enables the discovery of a novel cuproptosis-inducing molecule for the inhibition of hepatocellular carcinoma
Acta Pharmacologica Sinica (2024)
-
Potential Impact of Hypoxic Astrocytes on the Aggravation of Depressive Symptoms in Parkinson’s Disease
Journal of Molecular Neuroscience (2024)
-
Adipsin inhibits Irak2 mitochondrial translocation and improves fatty acid β-oxidation to alleviate diabetic cardiomyopathy
Military Medical Research (2023)
-
Engineering antioxidant ceria-zirconia nanomedicines for alleviating podocyte injury in rats with adriamycin-induced nephrotic syndrome
Journal of Nanobiotechnology (2023)

